. 2024 Sep;300(9):107686.
doi: 10.1016/j.jbc.2024.107686. Epub 2024 Aug 17.

ISGylation enhances dsRNA-induced interferon response and NFκB signaling in fallopian tube epithelial cells

Affiliations

ISGylation enhances dsRNA-induced interferon response and NFκB signaling in fallopian tube epithelial cells

Vidushi Madaan et al. J Biol Chem. 2024 Sep.

Abstract

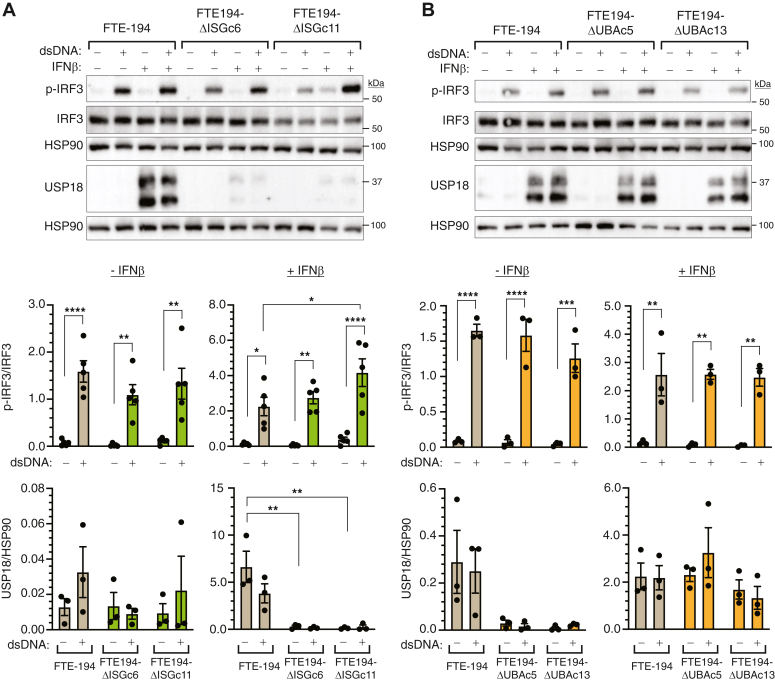
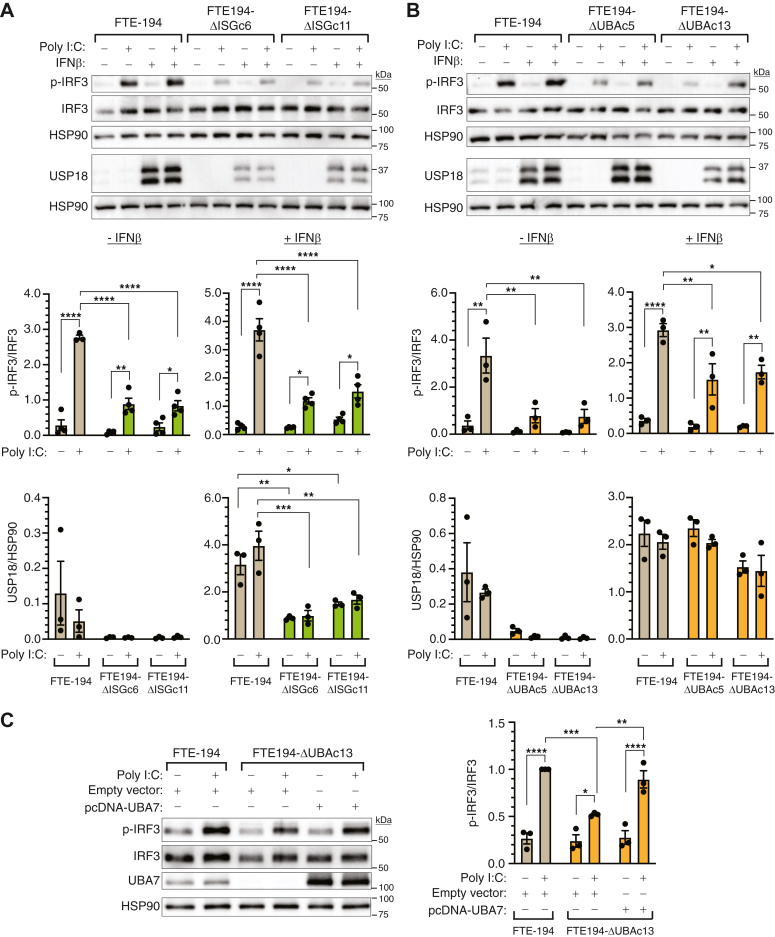
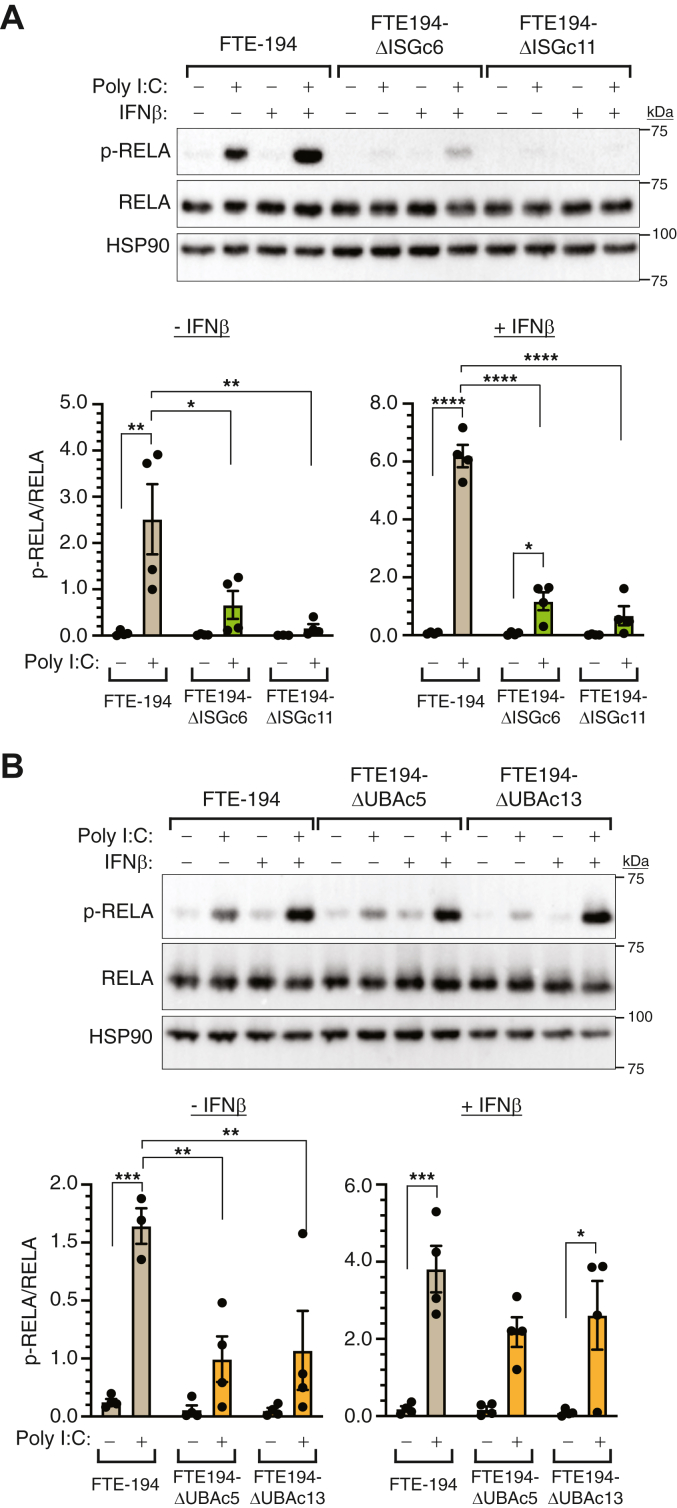
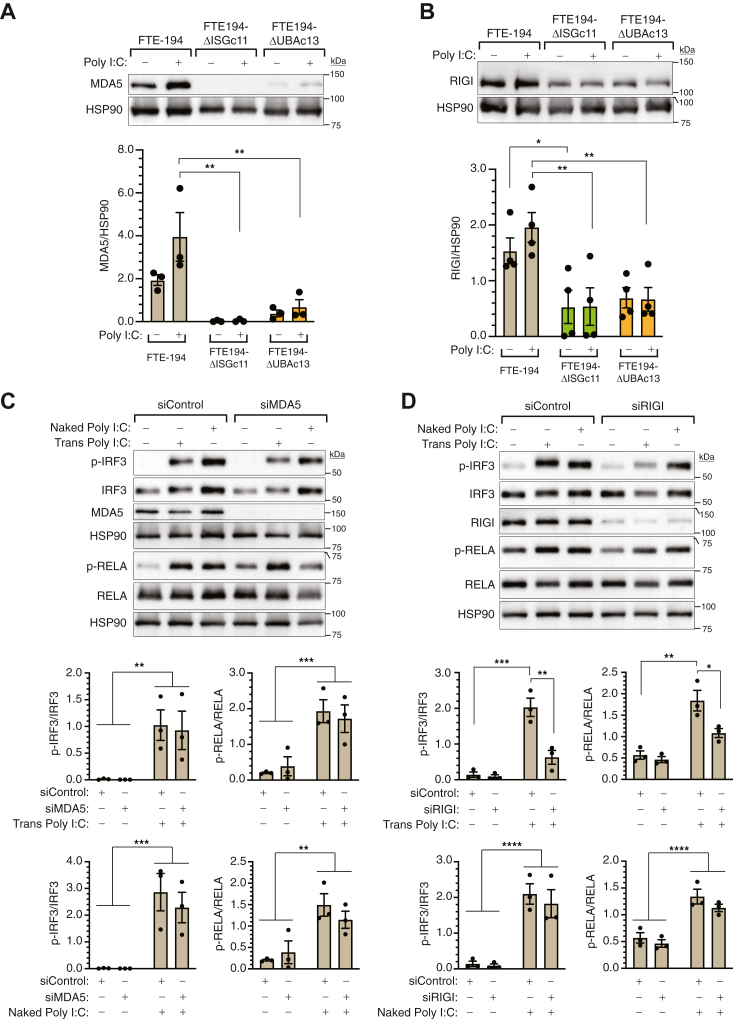
Heritable mutations in BRCA1 associate with increased risk of high-grade serous tubo-ovarian cancer. Nongenetic risk factors associated with this cancer, which arises from fallopian tube epithelial (FTE) cells, suggests a role for repetitive ovulation wherein FTE cells are exposed to inflammatory signaling molecules within follicular fluid. We previously reported increased NFκB and EGFR signaling in BRCA1-deficient primary FTE cells, with follicular fluid exposure further increasing abundance of interferon-stimulated gene (ISG) transcripts, including the ubiquitin-like protein ISG15 and other ISGylation pathway members. Both NFκB and type I interferon signaling are upregulated by stimulation of cGAS-STING or MDA5 and RIGI pattern recognition receptors. Since some pattern recognition receptors and their signal transduction pathway members are ISGylated, we tested the impact of ISG15 and ISGylation on interferon regulatory factor 3 (IRF3) and NFκB signaling through cGAS-STING or RIGI and MDA5 activation. Expression of ISG15 or UBA7, the E1-like ISG15-activating enzyme, in immortalized FTE cells was disrupted by CRISPR gene editing. Activation of IRF3 by RIGI or MDA5 but not cGAS-STING was attenuated by loss of either ISG15 or UBA7 and this was reflected by a similar effect on NFκB activation and downstream targets. Loss of ISGylation decreased levels of both MDA5 and RIGI, with knockdown of RIGI but not MDA5, decreasing IRF3 and NFκB activation in parental cells. These finding indicate that ISGylation enhances the ability of dsRNA to activate cytokine release and proinflammatory signaling. Further work to explore ISGylation as a target for prevention of high-grade serous tubo-ovarian cancer in BRCA1 mutation carriers is warranted.

Keywords: CRISPR/cas; ISGylation; NF-kappa B; RIGI-like receptor; dsRNA; fallopian tube cells; inflammation; innate immunity; interferon; ovarian cancer.


Conflict of interest statement

Conflict of interest The authors declare that they have no conflicts of interest with the contents of this article.

Figures

Figure 1
Figure 1
Screening of FTE cell lines for ISG15, UBA7, and USP18 expression. FTE-194, FTE-246, and OE-E6/7 cells were treated with 1000 IU/ml IFNβ 24 h prior to harvesting. A, relative abundance of ISG15 transcript levels in cells treated with or without IFNβ as determined by qPCR. B, representative Western blot showing levels of overall ISGylated proteins, free ISG15, UBA7, and USP18. GAPDH was used as a loading control for normalization. C, bar graphs showing protein levels of free and conjugated ISG15, UBA7, and USP18 in cells treated with or without IFNβ. Bars represent the group mean ± SEM of three independent experiments. Bars with the same letter are not statistically different from one another as determined by a two-way ANOVA, followed by a Holm–Sidak multiple comparison test. FTE, fallopian tube epithelial; IFNβ, interferon β; ISG, interferon-stimulated gene; qPCR, quantitative PCR; SE, short exposure.
Figure 2
Figure 2
Loss of ISG15 (ΔISG), but not ISGylation (ΔUBA), decreased USP18 protein levels. FTE-194 cells and two clonally selected FTE-194 cell lines with disrupted ISG15 (FTE-194ΔISGc6 cells generated by conventional CRISPR and FTE-194ΔISGc11 cells generated by prime editing) or UBA7 (FTE-194ΔUBAc5 and c13 cells generated by conventional CRISPR) were treated with or without 1000 IU/ml IFNβ 24 h prior to harvesting. Representative Western blots showing levels of overall ISGylated proteins, free ISG15, UBA7, and USP18. HSP90 was used as a loading control for normalization. A, representative Western blot and bar graphs showing levels of UBA7 and USP18 in FTE-194 and FTE-194ΔISG cells treated with or without IFNβ. B, representative Western blot and bar graphs showing levels of free ISG15 and USP18 in FTE-194 and FTE-194ΔUBA cells treated with or without IFNβ. Bars represent the group mean ± SEM of 3 to 6 independent experiments. ∗∗p ≤ 0.01, ∗∗∗p ≤ 0.001, ∗∗∗∗p ≤ 0.0001. FTE, fallopian tube epithelial; IFNβ, interferon β; ISG, interferon-stimulated gene; SE, short exposure.
Figure 3
Figure 3
Loss of ISGylation does not impact activation of IRF3 by dsDNA90. Representative Western blots and bar graphs summarizing phosphorylated IRF3 (p-IRF3) levels in parental FTE-194 cells and two clonally selected ISG15-null cell sublines (panel A) or in parental FTE-194 cells and two clonally selected UBA7-null cell sublines (panel B). Cells pretreated with or without 500 IU/ml IFNβ were transfected with 0.3 μg dsDNA90 3 h before harvesting. Representative Western blots of p-IRF3, total IRF3, and USP18 are shown with bar graphs summarizing the results of 3 to 5 independent experiments. HSP90 was used as a loading control. Bars represent the group mean ± SEM. ∗p ≤ 0.05, ∗∗p ≤ 0.01, ∗∗∗p ≤ 0.001, and ∗∗∗∗p ≤ 0.0001. FTE, fallopian tube epithelial; IFNβ, interferon β; ISG, interferon-stimulated gene.
Figure 4
Figure 4
Loss of ISGylation decreases activation of IRF3 by Poly I:C transfection.A and B, representative Western blots and bar graphs summarizing p-IRF3, total IRF3, and USP18 levels in parental FTE-194 cells and two clonally selected ISG15-null cell sublines (panel A) or in parental FTE-194 cells and two clonally selected UBA7-null cell sublines (panel B). Cells pretreated with or without 500 IU/ml IFNβ were transfected with 0.3 μg Poly I:C 1 h before harvesting. C, representative Western blot and bar graphs summarizing p-IRF3 and total IRF3 levels in parental FTE-194 cells and UBA7-null cells transfected with pcDNA-UBA7 cDNA or empty vector. Cells were transfected with or without 0.3 μg Poly I:C 1 h before harvesting. Bar graphs summarize the results of 3 to 4 independent experiments. HSP90 was used as a loading control. Bars represent the group mean ± SEM. ∗p ≤ 0.05, ∗∗p ≤ 0.01, ∗∗∗p ≤ 0.001, and ∗∗∗∗p ≤ 0.0001. FTE, fallopian tube epithelial; IFNβ, interferon β; ISG, interferon-stimulated gene; Poly I:C, polyinosinic:polycytidylic acid.
Figure 5
Figure 5
Loss of ISGylation decreases activation of NFκB by Poly I:C transfection. Representative Western blots and bar graphs summarizing p-RELA levels in parental FTE-194 cells and two clonally selected ISG15-null cell sublines (panel A) or in parental FTE-194 cells and two clonally selected UBA7-null cell sublines (panel B). Cells pretreated with or without 500 IU/ml IFNβ were transfected with 0.3 μg Poly I:C 1 h before harvesting. Representative Western blots of p-RELA and total RELA are shown with bar graphs summarizing the results of 3 to 4 independent experiments. HSP90 was used as a loading control. Bars represent the group mean ± SEM. ∗p ≤ 0.05, ∗∗p ≤ 0.01, ∗∗∗p ≤ 0.001, ∗∗∗∗p ≤ 0.0001. FTE, fallopian tube epithelial; IFNβ, interferon β; ISG, interferon-stimulated gene; Poly I:C, polyinosinic:polycytidylic acid.
Figure 6
Figure 6
Loss of ISG15 or UBA7 decreases activation of downstream targets of IRF3 and NFκB.A and B, relative IFNB1 (panel A) and PTGS2 (panel B) transcript levels measured by qPCR in parental, ISG15-null, and UBA7-null FTE-194 cells transfected with 0.3 μg Poly I:C for 1.5 h. Values are relative to levels measured in parental cells treated with Poly I:C. C, relative TNFα transcript levels measured in cells transfected with 0.3 μg Poly I:C for 3 h. Cells were treated with or without 500 IU/ml IFNβ. Values are relative to levels measured in parental cells treated with Poly I:C in the absence of IFNβ pretreatment. D, relative CCL5 transcript levels measured in cells transfected with 0.3 μg Poly I:C for 8 h. Cells were treated with or without 500 IU/ml IFNβ. Values are relative to levels measured in parental cells treated with Poly I:C in the absence of IFNβ pretreatment. Bars represent the group mean ± SEM of 3 to 4 independent experiments. ∗p ≤ 0.05, ∗∗p ≤ 0.01, ∗∗∗p ≤ 0.001, and ∗∗∗∗p ≤ 0.0001. FTE, fallopian tube epithelial; IFNβ, interferon β; ISG, interferon-stimulated gene; Poly I:C, polyinosinic:polycytidylic acid; qPCR, quantitative PCR.
Figure 7
Figure 7
Loss of ISGylation decreases both MDA5 and RIGI levels and RIGI mediates transfected Poly I:C effects.A and B, representative Western blots and bar graph summarizing MDA5 (panel A) or RIGI levels (panel B) in cells transfected with or without 0.3 μg Poly I:C for 1 h. Two-way ANOVA indicated an effect of ISG15 and MDA5 status (p = 0.0002) and for ISG15 and RIGI status (p = 0.0003). C and D, representative Western blots and bar graph summarizing p-IRF3 and p-RELA levels in parental FTE-194 cells transfected with nontargeting siRNA or siRNA targeting either MDA5 (panel C) or RIGI (panel D) 72 h prior to transfection of 0.3 μg Poly I:C (Trans Poly I:C) for 1 h or addition of 0.3 μg naked Poly I:C for 2 h. Panel C: two-way ANOVA indicated a significant effect of Poly I:C transfection or addition on both p-IRF3 and p-RELA levels (p < 0.005), but no effect of siMDA5 or interaction. Panel D: two-way ANOVA indicated a significant effect of Poly I:C and siRIGI transfection on both p-IRF3 and p-RELA levels (p < 0.02) and a significant interaction between Poly I:C and siRIGI on p-IRF3 levels (p = 0.0037). For naked Poly I:C treatment, two-way ANOVA indicated a significant effect of Poly I:C treatment on both p-IRF3 and p-RELA levels (p < 0.0001), but no effect of siRIGI or interaction. Bars represent the group mean ± SEM of 3 to 4 independent experiments. Significant group comparisons as determined by Holm–Sidak’s multiple comparison testing are shown. ∗p ≤ 0.05, ∗∗p ≤ 0.01, ∗∗∗p ≤ 0.001, and ∗∗∗∗p ≤ 0.0001. FTE, fallopian tube epithelial; ISG, interferon-stimulated gene; Poly I:C, polyinosinic:polycytidylic acid.
Figure 8
Figure 8
Loss of ISG15 or ISGylation did not impact cell culture growth but decreased cell migration.A, cells were treated with IFNβ (500 IU/ml) or vehicle 24 h after seeding. Absorbance, reflecting relative cell number, was determined 0, 24, 48, and/or 72 h later using an XTT dye reduction assay. Two-way ANOVA performed on 72 h data indicated an effect of IFNβ treatment (p < 0.0001) only. Individual group comparisons by a Holm–Sidak multiple comparison test are shown. B, cells were transfected with or without Poly I:C (0.3 μg) for 1 h and seeded into 96-well plates. Absorbance was determined 72 h later. Two-way ANOVA indicated an effect of Poly I:C treatment (p = 0.0054) only. Individual group comparisons by a Holm–Sidak multiple comparison test are shown. C, representative images of scratch-wound healing in parental, ISG15-null, and UBA7-null FTE-194 cells treated with 0.3 μg Poly I:C for 1 h and bar graph summarizing the amount of open wound remaining at 22 h from 3 to 4 independent experiments, each with 2 to 3 replicates. The scale bar represents 300 μm. ∗p ≤ 0.05, ∗∗p ≤ 0.01, and ∗∗∗p ≤ 0.001. FTE, fallopian tube epithelial; IFNβ, interferon β; ISG, interferon-stimulated gene; Poly I:C, polyinosinic:polycytidylic acid.
Figure 9
Figure 9
Impact of loss of ISG15 or UBA7 on spheroid formation and transcript levels of stemness genes.A, representative images of spheroids formed by parental, ISG15-null, and UBA7-null FTE-194 cells transfected with or without 0.3 μg Poly I:C for 1 or 3 h. Identical results were obtained in three independent experiments, each with 2 to 3 replicates. The scale bar represents 300 μm. B, relative transcript levels of NANOG, CD44, SOX2, OCT4, ALDH1, and SSEA4 measured by qPCR in parental, ISG15-null, and UBA7-null FTE-194 cells 3 h after transfection with or without 0.3 μg Poly I:C. Values are relative to levels measured in parental cells treated with Poly I:C. Bars represent the group mean ± SEM of 3 to 6 independent experiments. Significant group comparisons as determined by ANOVA followed by Holm–Sidak’s multiple comparison testing are shown. ∗∗p ≤ 0.01, ∗∗∗p ≤ 0.001, and ∗∗∗∗p ≤ 0.0001. FTE, fallopian tube epithelial; ISG, interferon-stimulated gene; Poly I:C, polyinosinic:polycytidylic acid; qPCR, quantitative PCR.
Figure 10
Figure 10
Schematic model of the impact of ISGylation on proinflammatory signaling stimulated by intracellular dsRNA in FTE cells. Intracellular Poly I:C is sensed by MDA5 or RIGI, which results in recruitment and aggregation of MAVS that facilitates constitutively expressed IRF3 phosphorylation by TBK1 or IKK-ε. Activated IRF3 induces expression and secretion of type I interferons, which bind to their plasma membrane receptors, IFNAR1/2, to result in phosphorylation of STAT1 and STAT2. The activated transcription factors partner with IRF9 and translocate to the cell nucleus to activate expression of IFN-stimulated genes. Among these are IRF3 and IRF7, which further promote IFN production, and genes involved in ISGylation, such as ISG15, UBA7, HERC5, and USP18, as well as numerous other immune related genes such as IFIT1 and IFIT2, MDA5, RIGI, cGAS, and SNAI1. In addition to its action as an ISG15 deconjugase, USP18 acts to inhibit activation of STAT proteins by type I interferons, an activity that is promoted by free ISG15. Thus, free ISG15 and USP18 act to inhibit interferon signaling to limit the immune response. Aggregation of MAVS also leads to activation of NFκB signaling and downstream proinflammatory cytokines. In this study, we demonstrate that loss of ISGylation results in markedly decreased ability of intracellular dsRNA to activate IRF3 and NFκB signaling, and thus may be an attractive target to mitigate risk of HGSTOC in BRCA1 mutation carriers. FTE, fallopian tube epithelial; HGSTOC, high-grade serous tubo-ovarian cancer; IFN, interferon; ISG, interferon-stimulated gene; Poly I:C, polyinosinic:polycytidylic acid.

References

    1. Phung M.T., Pearce C.L., Meza R., Jeon J. Trends of ovarian cancer incidence by histotype and race/ethnicity in the United States 1992-2019. Cancer Res. Commun. 2023;3:1–8. - PMC - PubMed
    1. Torre L.A., Trabert B., DeSantis C.E., Miller K.D., Samimi G., Runowicz C.D., et al. Ovarian cancer statistics, 2018. CA Cancer J. Clin. 2018;68:284–296. - PMC - PubMed
    1. Bowtell D.D., Bohm S., Ahmed A.A., Aspuria P.J., Bast R.C., Jr., Beral V., et al. Rethinking ovarian cancer II: reducing mortality from high-grade serous ovarian cancer. Nat. Rev. Cancer. 2015;15:668–679. - PMC - PubMed
    1. Labidi-Galy S.I., Papp E., Hallberg D., Niknafs N., Adleff V., Noe M., et al. High grade serous ovarian carcinomas originate in the fallopian tube. Nat. Commun. 2017;8:1093. - PMC - PubMed
    1. Kuchenbaecker K.B., Hopper J.L., Barnes D.R., Phillips K.A., Mooij T.M., Roos-Blom M.J., et al. Risks of breast, ovarian, and contralateral breast cancer for BRCA1 and BRCA2 mutation carriers. JAMA. 2017;317:2402–2416. - PubMed

MeSH terms

LinkOut - more resources