. 2024 Oct:491:117073.
doi: 10.1016/j.taap.2024.117073. Epub 2024 Aug 17.

High-Throughput Transcriptomics Screen of ToxCast Chemicals in U-2 OS Cells

Affiliations

High-Throughput Transcriptomics Screen of ToxCast Chemicals in U-2 OS Cells

Joseph L Bundy et al. Toxicol Appl Pharmacol. 2024 Oct.

Abstract

New approach methodologies (NAMs) aim to accelerate the pace of chemical risk assessment while simultaneously reducing cost and dependency on animal studies. High Throughput Transcriptomics (HTTr) is an emerging NAM in the field of chemical hazard evaluation for establishing in vitro points-of-departure and providing mechanistic insight. In the current study, 1201 test chemicals were screened for bioactivity at eight concentrations using a 24-h exposure duration in the human- derived U-2 OS osteosarcoma cell line with HTTr. Assay reproducibility was assessed using three reference chemicals that were screened on every assay plate. The resulting transcriptomics data were analyzed by aggregating signal from genes into signature scores using gene set enrichment analysis, followed by concentration-response modeling of signatures scores. Signature scores were used to predict putative mechanisms of action, and to identify biological pathway altering concentrations (BPACs). BPACs were consistent across replicates for each reference chemical, with replicate BPAC standard deviations as low as 5.6 × 10⁻³ μM, demonstrating the internal reproducibility of HTTr-derived potency estimates. BPACs of test chemicals showed modest agreement (R2 = 0.55) with existing phenotype altering concentrations from high throughput phenotypic profiling using Cell Painting of the same chemicals in the same cell line. Altogether, this HTTr based chemical screen contributes to an accumulating pool of publicly available transcriptomic data relevant for chemical hazard evaluation and reinforces the utility of cell based molecular profiling methods in estimating chemical potency and predicting mechanism of action across a diverse set of chemicals.

Keywords: Computational toxicology; High Throughput Transcriptomics; Signature scoring; U-2 OS.


Conflict of interest statement

Declaration of competing interest The authors declare no conflict of interest. This manuscript has been reviewed by the Center for Computational Toxicology and Exposure, Office of Research and Development, U.S. Environmental Protection Agency, and approved for publication. Approval does not signify that the contents reflect the views of the Agency, nor does mention of trade names or commercial products constitute endorsement or recommendation for use.

Figures
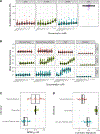
Figure 1.
Figure 1.. Reproducibility of Transcriptomic Signal Across Reference Chemical Replicates
A) Euclidian norm of log2 fold changes across reference chemicals. B) Mean signature score for selected signatures across reference chemicals. Plot is divided into vertical sections that show signature scores for signatures that are annotated for mechanism-relevant super-targets (Glucocorticoids, Topoisomerase Inhibition, RAR). The right-most panel contains scores for 1000 “Random” signatures that were generated by selecting genes at random. Each row is results for a reference chemical (DEX, ETOP, ATRA) C) Reproducibility of BPAC05 values across reference chemical replicates. D) Reproducibility of number of active signatures across reference chemical replicates.
Figure 2.
Figure 2.. Screen-Wide Evaluation of Test Chemical Bioactivity
A) Comparison of BPACM to BPAC05 for test chemicals. Dot size corresponds to the number of active gene expression signatures. Red points identify the 11 most potent “high spread” chemicals, which have a BPAC05 that is an order of magnitude lower than the BPACM. Blue points identify the 11 most potent chemicals that are not “high spread”. B) Distribution of signature level BMCs for 11 most potent “high spread” chemicals. C) Distribution of signature level BMCs for 11 most potent chemicals that were not “high spread”.
Figure 3.
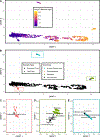
Figure 3.. UMAP Embedding of Test Chemicals and Reference Chemical Samples
A) UMAP embedding of test and reference samples. Points are shaded to indicate the number active signatures associated with each chemical, with yellow points corresponding to many active signatures, and blue / purple corresponding to few. B) UMAP embedding of test and reference samples. All test samples are shown in black, with reference chemical replicates and their corresponding clusters shown with red, green, and cyan. C-E) UMAP embedding for dexamethasone, etoposide, all-trans retinoic acid clusters and co-clustering test chemicals.
Figure 4.
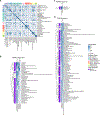
Figure 4.. Comparison of signature bioactivity between target-annotated chemicals and query chemicals
A) Heatmap of signature derived similarity of chemicals annotated for molecular targets via RefChemDB. Only targets linked to at least two chemicals in RefChemDB with a support level of at least 5 are shown. Tile colors are scaled to represent Jaccard indices of signature sets for chemical-pairs, and chemicals are grouped by common molecular target annotations. B-D) Pairwise comparisons between test chemicals with no target annotation and chemicals annotated for NR3C1 agonism (B), RARA agonism (C), or PGR agonism (D). Test chemicals were considered if at least two Jaccard indicies were significant for a single target via empirical t-test (p ≤ 0.05), and putative targets were assigned based on the highest median Jaccard index across all targets. In all panels, dot annotation within each cell indicates p ≤ 0.05 via empirical significance test versus null Jaccard index distribution and ≥ 5 intersecting signatures.
Figure 5.
Figure 5.. Comparison of HTTr and HTPP Derived Bioactivity
A) Pie graph showing proportion of test chemicals that were found to be bioactive in HTTr but not HTPP (blue), both HTTr and HTPP (pink), bioactive in HTPP but not HTTr (red), and, bioactive in neither HTTr nor HTPP (green). B) Distribution of BPAC05 values for chemicals bioactive in both HTTr and HTPP (pink), and chemicals bioactive only in HTTr (blue). C) Distribution of active signature count for chemicals bioactive in both HTTr and HTPP (pink), and chemicals bioactive only in HTTr (blue). D) Comparison of HTTr and HTPP derived bioactivities for test chemicals linked to selected molecular targets in RefChemDB. Blue tiles indicate the chemical was active in the HTTr or HTPP assays. Gray tiles indicate that the chemical was inactive.
Figure 6.
Figure 6.. Comparison of PODs from HTTr, HTPP, and Targeted High-Throughput assay data
A) Comparison of PODs for three reference chemicals and 25 most potent test chemicals by HTTr BPAC05. For reference chemicals, a single BPAC05 value was calculated by taking the median across replicates. HTTr BPAC05 values are shown in teal. HTPP derived BPACs are shown in red. Weighted median ToxCast AC50 values are shown in blue closed circles. ToxCast median cytotoxic burst values are shown with blue open circles. B) Comparison of HTTr BPAC05 and HTPP derived PAC values (in μM). Chemicals inactive in one or both assay formats were plotted in grey rectangles with jitter. C) Comparison of HTTr BPAC05 and ToxCast median AC50 values for test chemicals that were bioactive in both assay formats. D) Comparison of HTTr BPAC05 and ToxCast cytotoxic burst values.

References

    1. Judson R, et al. , The toxicity data landscape for environmental chemicals. Environ Health Perspect, 2009. 117(5): p. 685–95. - PMC - PubMed
    1. Patlewicz G, et al. , Integrating publicly available information to screen potential candidates for chemical prioritization under the Toxic Substances Control Act: A proof of concept case study using genotoxicity and carcinogenicity. Comput Toxicol, 2021. 20: p. 1–100185. - PMC - PubMed
    1. Thomas RS, et al. , The Next Generation Blueprint of Computational Toxicology at the U.S. Environmental Protection Agency. Toxicol Sci, 2019. 169(2): p. 317–332. - PMC - PubMed
    1. Harrill JA, et al. , High-Throughput Transcriptomics Platform for Screening Environmental Chemicals. Toxicol Sci, 2021. 181(1): p. 68–89. - PMC - PubMed
    1. Nyffeler J, et al. , Bioactivity screening of environmental chemicals using imaging-based high-throughput phenotypic profiling. Toxicol Appl Pharmacol, 2020. 389: p. 114876. - PMC - PubMed

Publication types