. 2024 Aug 19;15(1):7111.
doi: 10.1038/s41467-024-51134-x.

A roadmap to the molecular human linking multiomics with population traits and diabetes subtypes

Affiliations

A roadmap to the molecular human linking multiomics with population traits and diabetes subtypes

Anna Halama et al. Nat Commun. .

Abstract

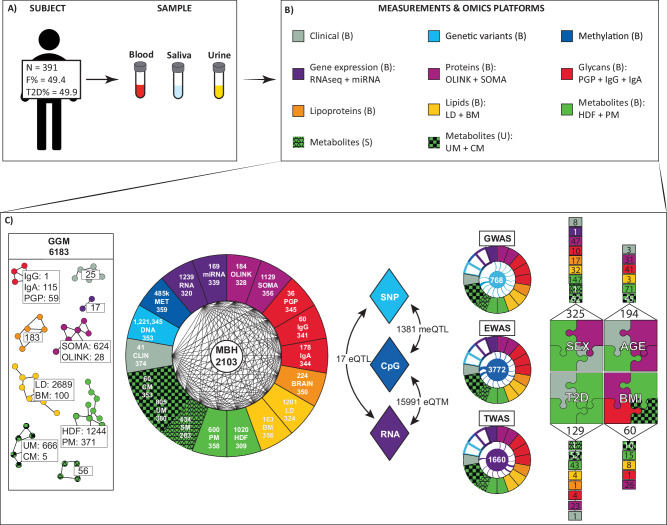
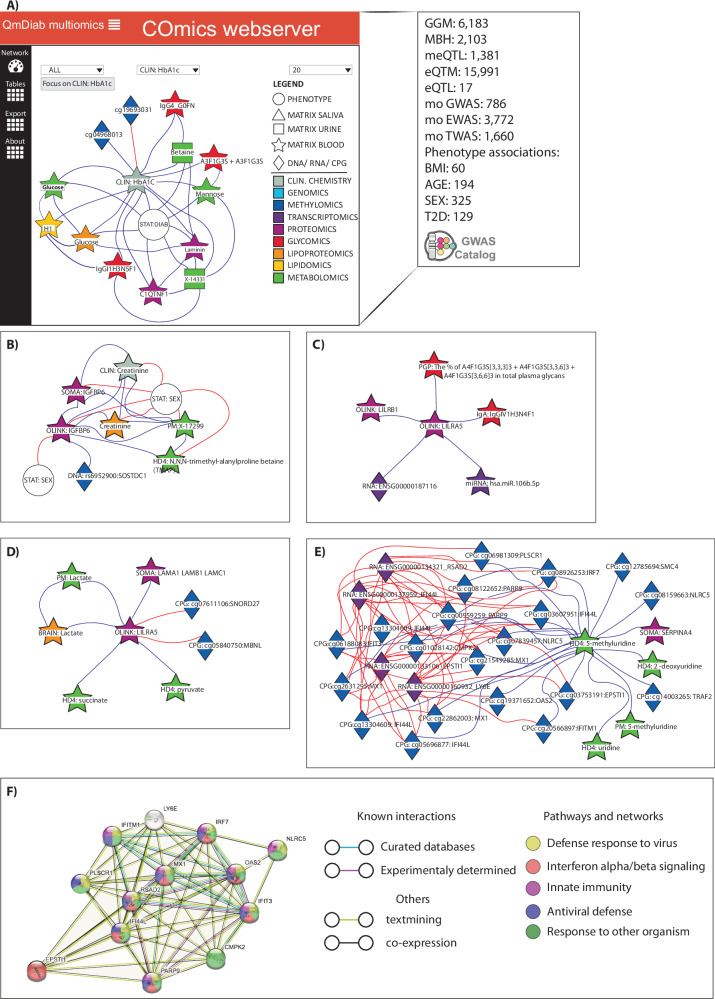
In-depth multiomic phenotyping provides molecular insights into complex physiological processes and their pathologies. Here, we report on integrating 18 diverse deep molecular phenotyping (omics-) technologies applied to urine, blood, and saliva samples from 391 participants of the multiethnic diabetes Qatar Metabolomics Study of Diabetes (QMDiab). Using 6,304 quantitative molecular traits with 1,221,345 genetic variants, methylation at 470,837 DNA CpG sites, and gene expression of 57,000 transcripts, we determine (1) within-platform partial correlations, (2) between-platform mutual best correlations, and (3) genome-, epigenome-, transcriptome-, and phenome-wide associations. Combined into a molecular network of > 34,000 statistically significant trait-trait links in biofluids, our study portrays "The Molecular Human". We describe the variances explained by each omics in the phenotypes (age, sex, BMI, and diabetes state), platform complementarity, and the inherent correlation structures of multiomics data. Further, we construct multi-molecular network of diabetes subtypes. Finally, we generated an open-access web interface to "The Molecular Human" ( http://comics.metabolomix.com ), providing interactive data exploration and hypotheses generation possibilities.


Conflict of interest statement

The authors declare the following conflicts of interest: M.P.B. and G.L. are working for or have stakes in Genos Ltd., a private company specialized in glycomics analyses. All the other authors declare no competing interests.

Figures

Fig. 1
Fig. 1. Overview of the subject and data sets.
A Study cohort and collected samples; B Data and omics platforms used for data generation; C Calculation strategies used to define: Within platform significant associations GGM—(Gaussian Graphical Model); Between platform significant associations MBH—(Mutual best hit); Multiomics GWAS—(Genome-wide association studies); Multiomics EWAS—(Epigenome-wide association studies); and Multiomics TWAS—(Transcriptome-wide association studies); as well as statistical associations between each platform and the phenotype such as SEX, AGE, type 2 diabetes (T2D) and body mass index (BMI). CLIN clinical chemistry parameters, DNA genotype data, MET DNA methylation sites, RNA RNA transcripts determined with RNA-sequencing, miRNA microRNA profiles, SOMA blood circulating proteins measured with aptamer-based technology (SomaLogic), OLINK blood circulating proteins measured using high-multiplex immunoassays (Olink), PGP glycan traits N-glycosylation, IgG IgG-glycopepdides, IgA IgA and IgG-glycopeptides BRAIN plasma lipoproteins, LD plasma lipids quantified using Lipidyzer, BM plasma lipids quantified with Biocrates p150 kit, HDF plasma metabolic traits profiled on HD4 platform (Metabolon), PM plasma metabolic traits profiled on HD2 platform (Metabolon), SM saliva metabolic traits profiled on HD2 platform (Metabolon), UM urine metabolic traits profiled on HD2 platform (Metabolon), CM urine metabolites quantified with 1H NMR deploying Chenomx. N number of subjects, F female, B blood, U urine, S saliva. The source data for (C) is available in the Supplementary Data (SD) 2−9 and 11−14.
Fig. 2
Fig. 2. The cross-talk between human body fluids captured by Mutual Best Hit (MBH) and Gaussian Graphical Model (GGM) reassembles caffeine metabolism.
Green indicates measurements conducted with metabolomics. The Supplementary Data (SD) 2 and 3 serves as data source for this figure.
Fig. 3
Fig. 3. Examples of findings from multiomics GWAS, EWAS, and TWAS associations.
A Glycome GWAS revealed associations between ST3GAL1 variants and IgA1 glycosylation. (Referee to SD2 and SD7 as the data source); B miRNA regulation throughout genetic and epigenetic changes as determined with GWAS and EWAS. (Referee to SD2, SD4, and SD8 as the data source); C Venn diagram showing an overlap between molecules associated with gene transcripts of GATA2, HDC, MS4A3, and FCER1A but not PDK4. (Referee to SD9 as the data source); D Ingenuity pathway analysis (IPA) revealed potential interaction between GATA2, HDC, MS4A3, and FCER1A but not PDK4; E The molecules associated with PDK4. (Referee to ST9 as the data source); F Associations between lipids structures and GATA2, HDC, MS4A3 and FCER1A. (Referee to SD9 as the data source). Molecules measured across platforms are depicted by different colors: DNA (light blue), Methylation (dark blue), RNA (violet), IgA (red), BRAIN (orange), BM (yellow), HDF, PM, UM, CM (green) form the multiomics network.
Fig. 4
Fig. 4. Multiomics interactions of molecular (proteins and metabolites) signatures of MARD cluster.
Molecules measured across 11 platforms CLIN (gray), DNA (blue), RNA (violet), SOMA & OLINK (purple), BRAIN (orange), BM (yellow), HDF, PM, UM, CM (green) form the multiomics network. The Supplementary Data (SD) 2, 3, 7, 9, and 17 serves as data source for this figure.
Fig. 5
Fig. 5. Overview on COmics functionality.
A COmics webpage layout and the information on integrated data; B COmics generated molecular network of IGFBP6. (Referee to SD2, SD3, SD8 as the data source); C COmics generated molecular network of LILRA5. (Referee to SD3 and SD9 as the data source); D COmics generated molecular network of lactate. (Referee to SD2, SD3 and SD8 as the data source); E COmics generated molecular network of 5-methyluridine; (Referee to SD3, SD5, and SD8 as the data source); F STRING generated clusters of molecules associated with 5-methyluridine showed their involvement in immune responses. The color code for the network representation (B-E) represents following omics: Dark blue diamond—Methylomics, Vialet diamond—Transcriptomics, Purple star—Proteomics, Red star—Glycomics, Orange star—Lipoproteomics, Green star—Metabolomics, Gray star—clinical chemistry.

References

    1. Borges, L., Kubin, M. & Kuhlman, T. LIR9, an immunoglobulin-superfamily-activating receptor, is expressed as a transmembrane and as a secreted molecule. Blood101, 1484–1486 (2003). 10.1182/blood-2002-05-1432 - DOI - PubMed
    1. Campeau, A. et al. Multi-omics of human plasma reveals molecular features of dysregulated inflammation and accelerated aging in schizophrenia. Mol. Psychiatry27, 1217–1225 (2022). 10.1038/s41380-021-01339-z - DOI - PMC - PubMed
    1. Marabita, F. et al. Multiomics and digital monitoring during lifestyle changes reveal independent dimensions of human biology and health. Cell Syst.13, 241–255.e247 (2022). 10.1016/j.cels.2021.11.001 - DOI - PubMed
    1. Sailani, M. R. et al. Deep longitudinal multiomics profiling reveals two biological seasonal patterns in California. Nat. Commun.11, 4933 (2020). - PMC - PubMed
    1. Benson, M. D. et al. Protein-metabolite association studies identify novel proteomic determinants of metabolite levels in human plasma. Cell Metab.35, 1646–1660.e1643 (2023). 10.1016/j.cmet.2023.07.012 - DOI - PMC - PubMed

LinkOut - more resources