. 2024 Aug 19;15(1):6911.
doi: 10.1038/s41467-024-50347-4.

How urban form impacts flooding

Affiliations

How urban form impacts flooding

Sarah K Balaian et al. Nat Commun. .

Abstract

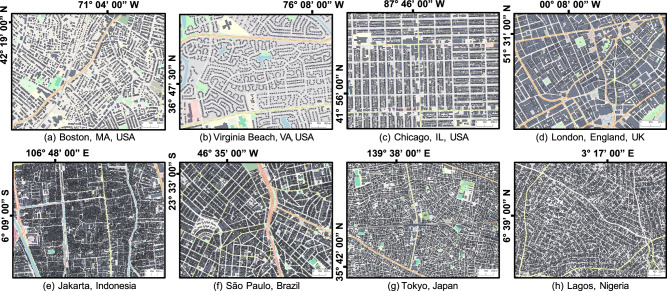
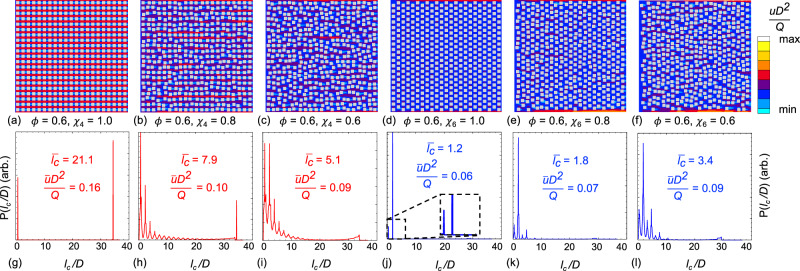
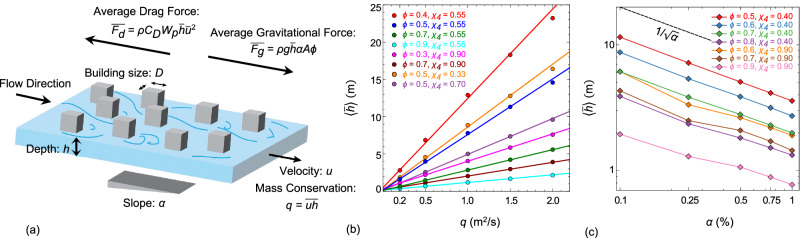
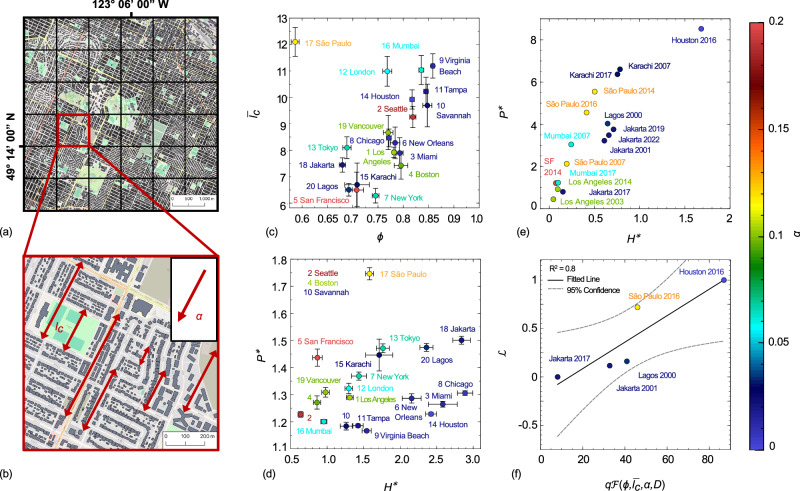
Urbanization and climate change are contributing to severe flooding globally, damaging infrastructure, disrupting economies, and undermining human well-being. Approaches to make cities more resilient to floods are emerging, notably with the design of flood-resilient structures, but relatively little is known about the role of urban form and its complexity in the concentration of flooding. We leverage statistical mechanics to reduce the complexity of urban flooding and develop a mean-flow theory that relates flood hazards to urban form characterized by the ground slope, urban porosity, and the Mermin order parameter which measures symmetry in building arrangements. The mean-flow theory presents a dimensionless flood depth that scales linearly with the urban porosity and the order parameter, with different scaling for disordered square- and hexagon-like forms. A universal scaling is obtained by introducing an effective mean chord length representative of the unobstructed downslope travel distance for flood water, yielding an analytical model for neighborhood-scale flood hazards globally. The proposed mean-flow theory is applied to probe city-to-city variations in flood hazards, and shows promising results linking recorded flood losses to urban form and observed rainfall extremes.


Conflict of interest statement

The authors declare no competing interest.

Figures

Fig. 1
Fig. 1. Urban form across the cities in North and South America, Europe, Africa, and Asia is highly varied.
Selected areas from (a) Boston, (b) Virginia Beach, (c) Chicago, (d) London, (e) Jakarta, (f) Sao Paulo, (g) Tokyo, and (h) Lagos. The building footprints, streets, highways, parks, and rivers are displayed in gray, yellow, orange, green, and blue, respectively. The coordinates of each city are defined along the top and left sides of the panel. Basemaps provided by OpenStreetMap (https://www.openstreetmap.org/copyright) used in conjunction with Microsoft’s Building Footprints and Google’s Open Buildings, data made available via an Open Database License (https://opendatacommons.org/licenses/odbl/).
Fig. 2
Fig. 2. The qualitative study of flow pathways in synthetic urban forms shows the impact of urban porosity, order, and chord length on flood velocity distribution.
Non-dimensionalized flood velocity maps for unit cells of urban forms with (ac) square and (df) hexagon-like patterns with porosity ϕ=0.6 and Mermin order χ=1.0, 0.8, and 0.6, respectively. The color bar on the right represents the velocity scale for all velocity maps. Gray squares represent flow obstructions. While the unit cell lu is ~ 33D, the channel length is set to 20lu to mitigate size effects. The normalized chord length distribution P(lc) for each urban form is placed below each velocity map in panels (gl); see the text for the definition.
Fig. 3
Fig. 3. Considering mass and momentum conservation laws to develop a non-dimensionalized relation between flood height, driving forces, and urban form attributes.
a A schematic of the control volume through which water, shown in blue, flows between gray square obstacles. In dense urban environments, the floor shear is negligible compared to the other forces, and the gravitational force balances the form drag at the steady state. A limited number of one-factor-at-a-time flow simulations corroborate with the proposed dimensionless relationship, showing the flood height (b) scales linearly with flow rate per width (q), and (c) is proportional to the inverse square root of the bottom slope (α−1/2).
Fig. 4
Fig. 4. Dimensional analysis collapses simulation data across urban forms (0.4 ≤ ϕ ≤ 1, 0.3χcn1, 0.001 ≤ α ≤ 0.1) into a dimensionless flood depth, h¯gD/q.
This depth depends on (a) separate functions of slope, porosity, and order for rectangular and hexagonal symmetry and (b) a single function of slope, porosity, and average chord length.
Fig. 5
Fig. 5. The application of mean-flow theory to probe flood hazard globally.
Flood hazards across cities worldwide are examined by (a) Subdividing cities into 1 km x 1 km tiles (shown in Vancouver, BC, Canada) and evaluating the topographic slope α, porosity ϕ, and order χ and (b) estimating the average chord length in the direction of descent to reveal (c) the porosity and chord length across 20 twenty cities; error bars show the margin of error with 90 percent confidence. Application of the mean-flow theory reveals: (d) the flow rate-normalized flood inundation H*=h¯/href and non-dimensionalized flood intensity P*=hu¯/huref for twenty cities with constant flow rate of Q = 1m3/s, (e) the theoretical flow rate-normalized flood inundation H* and non-dimensionalized flood intensity P* for recorded flood events. Finally, (f) The normalized monetary damages L are compared to the product of the inflow rate q and urban form factor F(ϕ,lc,α,D) among different flash flooding events. In panels (c-f), the markers' colors represent the average bottom slope of each city defined by the color bar to the right side. Building footprint data for Karachi and Mumbai may not be sufficient. Basemaps provided by OpenStreetMap (https://www.openstreetmap.org/copyright) used in conjunction with Microsoft’s Building Footprints and Google’s Open Buildings, data made available via an Open Database License (https://opendatacommons.org/licenses/odbl/).

References

    1. Kousky, C. Informing climate adaptation: a review of the economic costs of natural disasters. Energy Econ.46, 576–592 (2014).10.1016/j.eneco.2013.09.029 - DOI
    1. Douris, J. & Kim, G. The Atlas of Mortality and Economic Losses from Weather, Climate and Water Extremes (1970–2019). WMO No. 1267 (World Meteorological Organization, 2021).
    1. National Academies of Sciences, Engineering, and Medicine. Framing the Challenge of Urban Flooding in the United States (The National Academies Press, Washington, DC). https://nap.nationalacademies.org/catalog/25381/framing-the-challenge-of... (2022). - PubMed
    1. Sanders, B. F. et al. Large and inequitable flood risks in Los Angeles, California. Nat. Sustain. 1–11, https://www.nature.com/articles/s41893-022-00977-7 (2022).
    1. Seneviratne, S. et al. Weather and Climate Extreme Events in a Changing Climate, 1513–1766 (Cambridge University Press, Cambridge, United Kingdom and New York, NY, USA, 2021).