. 2024 Aug 19;14(1):19213.
doi: 10.1038/s41598-024-70154-7.

Simulation of CRISPR-Cas9 editing on evolving barcode and accuracy of lineage tracing

Affiliations

Simulation of CRISPR-Cas9 editing on evolving barcode and accuracy of lineage tracing

Fengshuo Liu et al. Sci Rep. .

Abstract

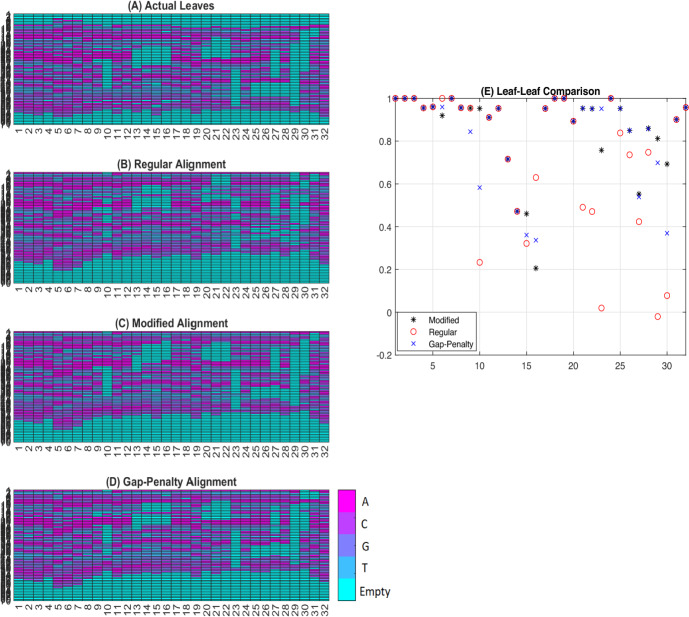
We designed a simulation program that mimics the CRISPR-Cas9 editing on evolving barcode and double strand break repair procedure along with cell divisions. Emerging barcode mutations tend to build upon previously existing mutations, occurring sequentially with each generation. This process results in a unique mutation profile in each cell. We sample the barcodes in leaf cells and reconstruct the lineage, comparing it to the original lineage tree to test algorithm accuracy under different parameter settings. Our computational simulations validate the reasonable assumptions deduced from experimental observations, emphasizing that factors such as sampling size, barcode length, multiple barcodes, indel probabilities, and Cas9 activity are critical for accurate and successful lineage tracing. Among the many factors we found that sampling size and indel probabilities are two major ones that affect lineage tracing accuracy. Large segment deletions in early generations could greatly impact lineage accuracy. These simulation results offer insightful recommendations for enhancing the design and analysis of Cas9-mediated molecular barcodes in actual experiments.


Conflict of interest statement

The authors declare no competing interests.

Figures

Figure 1
Figure 1
Comparison of Alignment Algorithms. (A) Leaf barcodes that contain structural information. This information is available in simulations but is lost in actual DNA sequencing. (B) Aligned barcodes using regular alignment. (C) Aligned barcodes using modified alignment. (D) Aligned barcodes using gap penalty alignment. (E) Leaf-leaf comparison scores using the three alignment algorithms.
Figure 2
Figure 2
Evolution of Matching Scores. (A) Average matching score decays geometrically as cell division/barcode mutation continues. (B) Standard deviation of matching scores also decreases as cell division/barcode mutation continues.
Figure 3
Figure 3
Accuracy of NBJNF method on in vitro dataset. (x ticks represent the upper-bound of the sub-interval. For example, 8.3 represents the interval [0, 8.3]; 16.6 represents the interval (8.3, 16.6], etc.).
Figure 4
Figure 4
A barcode evolution scenario where lineage is perfectly rebuilt using NBJNF method. The rebuilt lineage is identical to this original tree, hence is omitted.
Figure 5
Figure 5
A barcode evolution scenario where the rebuilt lineage has lowest accuracy in 100 runs using NBJNF method. (A) Original lineage tree. (B) Rebuilt lineage tree. Green nodes represent matched nodes to the original counterparts. The accuracy is 7/30=23.3%.
Figure 6
Figure 6
Whole tree accuracy with different barcode lengths and sampling proportions. (A) Lineage accuracy using RMP method. (B) Lineage accuracy using NBJ method.
Figure 7
Figure 7
Whole tree accuracy with different mutation rates. (A) Lineage accuracy using RMP method with propm=0.85; (B) Lineage accuracy using NBJ method with propm=0.4.
Figure 8
Figure 8
Full tree accuracy (ss=1) with different barcode lengths and different mutation rates. (A) RMP method; (B) NBJ method.
Figure 9
Figure 9
Whole tree accuracy with different matching proportions. A: all internal nodes, P: paired nodes, L: low propm=0.4, H: high propm=0.85. (A) RMP Method; (B) NBJ Method.
Figure 10
Figure 10
Comparison of RMP and NBJ methods. (A) Accuracy of all internal nodes, same propm=0.4 for both RMP and NBJ methods. (B) Accuracy of paired nodes, same propm=0.4 for both RMP and NBJ methods. (C) Accuracy of all internal nodes, propm=0.85 for RMP and propm=0.4 for NBJ. (D) Accuracy of paired nodes, propm=0.85 for RMP and propm=0.4 for NBJ.
Figure 11
Figure 11
Effect of Pulse Induction, RMP Method, propm=0.85. (A) Lineage accuracy with mupb=0.05. (B) Lineage accuracy with mupb=0.1.
Figure 12
Figure 12
Effect of Pulse Induction, NBJ Method, propm=0.4. (A) Lineage accuracy with mupb=0.05. (B) Lineage accuracy with mupb=0.1.
Figure 13
Figure 13
Effect of Dox induction at specific time. (A) and (B): accuracy is calculated by using RMP method under different induction patterns and mock Dox concentrations, the accuracy curves were plotted in Fig S2. Average accuracy for each curve is calculated and they are summarized here for comparisons. (C) and (D): accuray is calculated by NBJ method.
Figure 14
Figure 14
Comparison between NBJ and NBJNF with pulse Dox induction. (AD): accuracy of all internal nodes with different sampling size; (EH): accuracy of all paired nodes with different sampling size.
Figure 15
Figure 15
Lineage accuracy with 2 Independent Barcodes using NBJNF Method and Pulse Dox Induction. (AD) accuracy of all internal nodes with different sampling size; (EH) accuracy of all paired nodes with different sampling size.
Figure 16
Figure 16
Lineage accuracy with 2 Independent Barcodes using NBJNF Method and Cas9-TdT. (AD) accuracy of all internal nodes with different sampling size; (EH) accuracy of all paired nodes with different sampling size.
Figure 17
Figure 17
Lineage accuracy with 2 Independent Barcodes using NBJNF Method and Cas9-TdT with Pulse Dox Induction. (AD) accuracy of all internal nodes with different sampling size; (EH) accuracy of all paired nodes with different sampling size.
Figure 18
Figure 18
Maximum lineage accuracy of 10 runs with 2 Independent Barcodes using NBJNF Method and Cas9-TdT with Pulse Dox Induction. (AD) accuracy of all internal nodes with different sampling size; (EH): accuracy of all paired nodes with different sampling size.
Figure 19
Figure 19
Barcode editing (A) There are six random cuts on the barcode. (B) Remaining barcode after editing. At cut position 1, there is a single nucleotide mutation/substitution; At cut position 2, there is a single nucleotide deletion; the segment from cut position 3 to 5 is deleted; at cut position 6 there is a single nucleotide insertion.
Figure 20
Figure 20
Cell division and evolving barcodes. (A) Cells/barcodes are labeled. (B) Sampled barcodes from the last generation. All intermediate empty entries in the barcodes are collapsed. Barcodes are renumbered, but the order of sampled barcodes is random. (C) Barcode alignment using classical dynamic programming algorithm. Many nucleotides are inserted in spaces which are supposed to be deleted large segments. (D) Barcode alignment using modified algorithm.
Figure 21
Figure 21
Lineage tree reconstruction. (A) Leaf barcodes are sequenced and aligned, and their order is random. (B) Leaf barcodes are paired and parent nodes are rebuilt. (C) Parent barcodes are filtered by the root barcode so that gradually they converge to the root. (D) The rebuilding process continues retrospectively until the root node is reached.
Figure 22
Figure 22
Full lineage tree comparison. (A) The real lineage tree is assumed to be a full binomial tree, and the leaf nodes are ordered. (B) The reconstructed lineage tree is compared to the real lineage tree. (C) The percentage of matched internal nodes is calculated.
Figure 23
Figure 23
Partial lineage tree comparison. (A) The real lineage tree is not a full binomial tree. (B) Reconstructed lineage tree is compared to the real lineage tree. (C) Percentage of matched internal nodes and matched paired nodes are calculated, respectively.

References

    1. Kretzschmar, K. & Watt, F. Lineage tracing. Cell148, 33–45 (2012). 10.1016/j.cell.2012.01.002 - DOI - PubMed
    1. Conklin, E. The Organization and Cell-lineage of the Ascidian Egg. Arch Entwicklungsmech Organismen (Academy of Natural Sciences, 1905).
    1. Vogt, W. Gestaltungsanalyse am amphibienkeim mitortlicher vitalfarbung. ii. teil gastrulation und mesodermbildung bei urodelen und anuren. Wilhelm Roux Arch Entwicklungsmech Organismen120, 384–706 (1929). - PubMed
    1. Garcia-Bellido, A., Ripoll, P. & Morata, G. Developmental compart-mentalisation of the wing disk of drosophila. Nat. New Biol.245, 251–253 (1973). 10.1038/newbio245251a0 - DOI - PubMed
    1. Turner, D. & Cepko, C. A common progenitor for neurons and glia persists in rat retina late in development. Nature328, 131–136 (1987). 10.1038/328131a0 - DOI - PubMed

LinkOut - more resources