. 2024 Oct;21(10):1158-1174.
doi: 10.1038/s41423-024-01208-z. Epub 2024 Aug 19.

SIRPα engagement regulates ILC2 effector function and alleviates airway hyperreactivity via modulating energy metabolism

Affiliations

SIRPα engagement regulates ILC2 effector function and alleviates airway hyperreactivity via modulating energy metabolism

Yoshihiro Sakano et al. Cell Mol Immunol. 2024 Oct.

Abstract

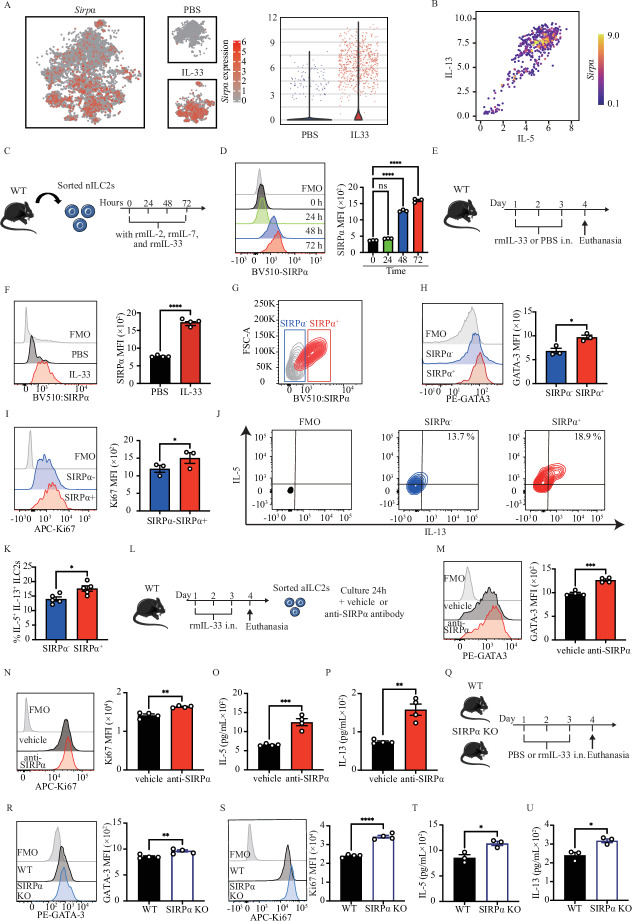
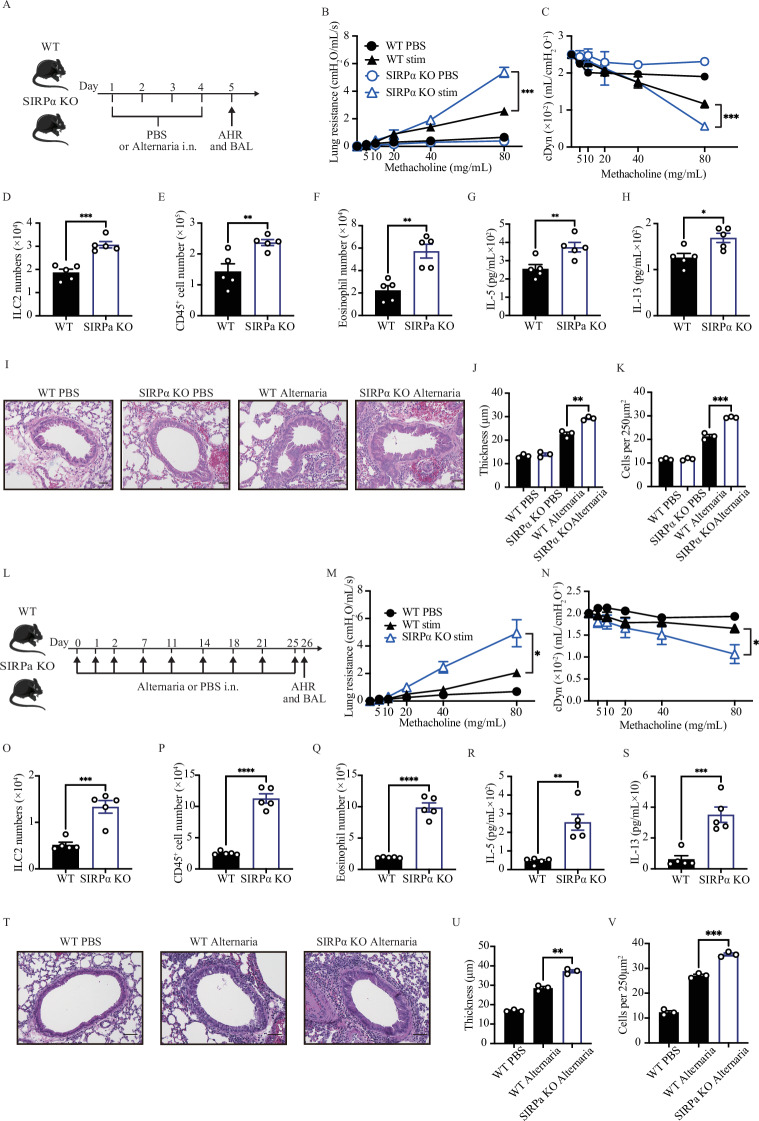
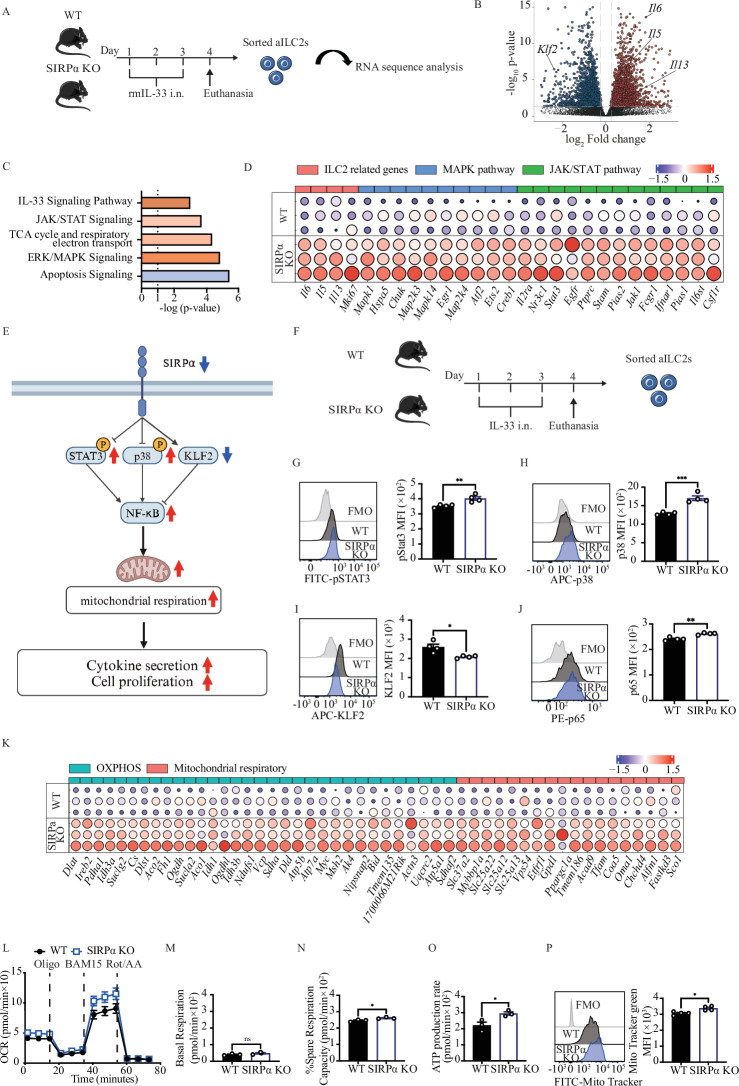
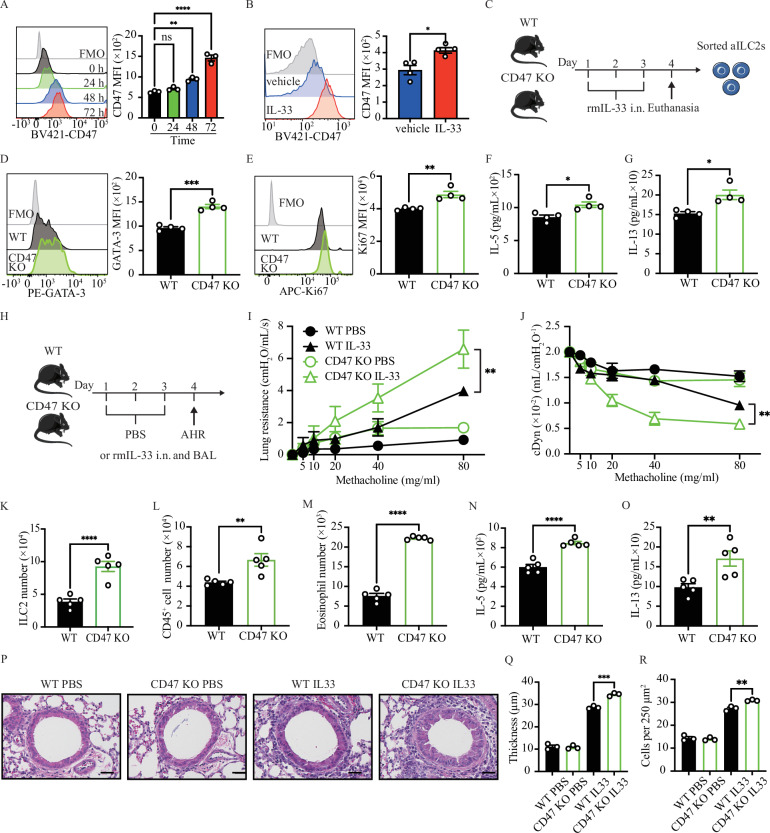
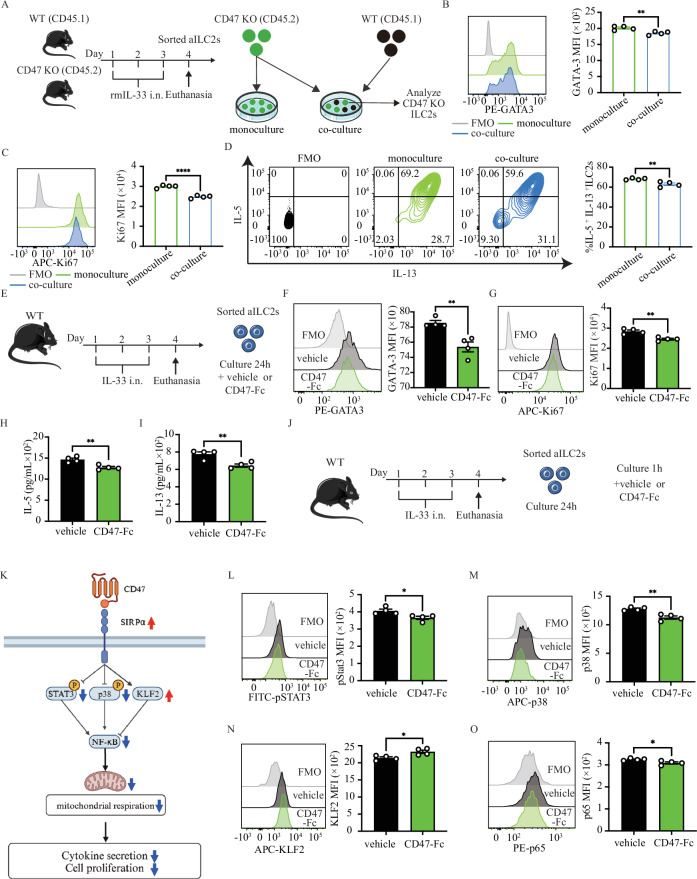
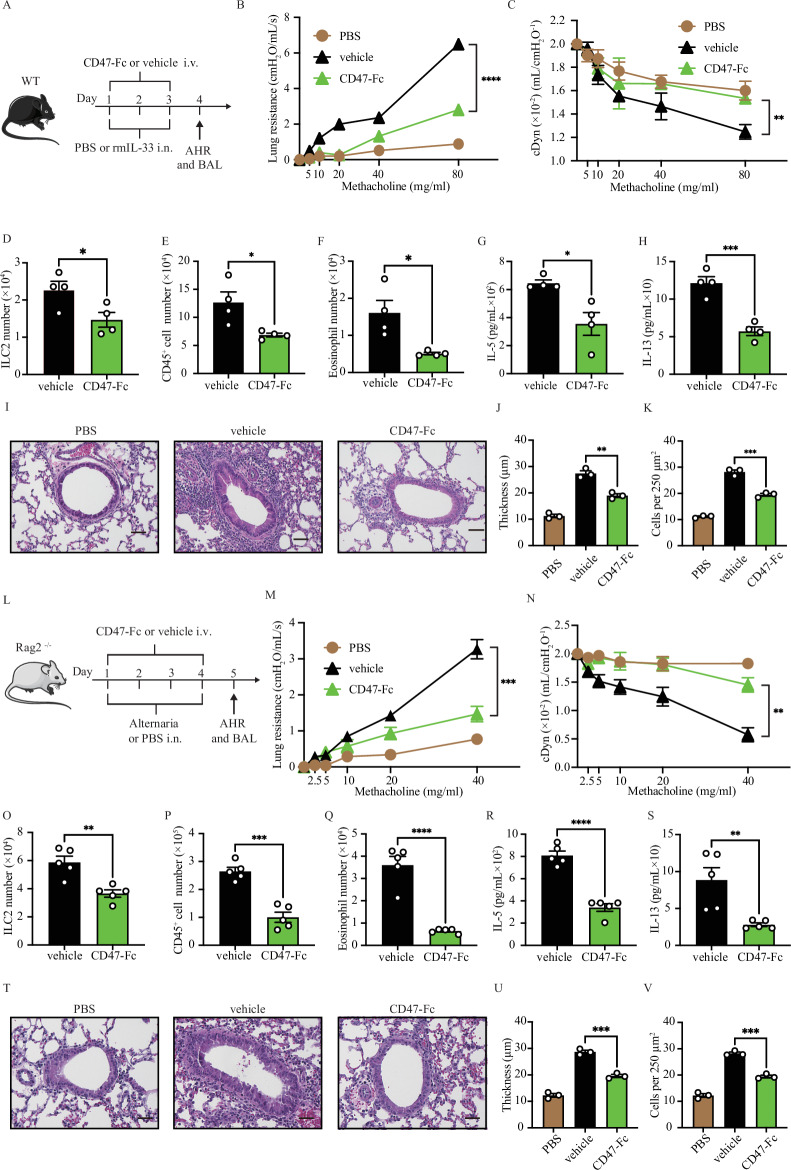
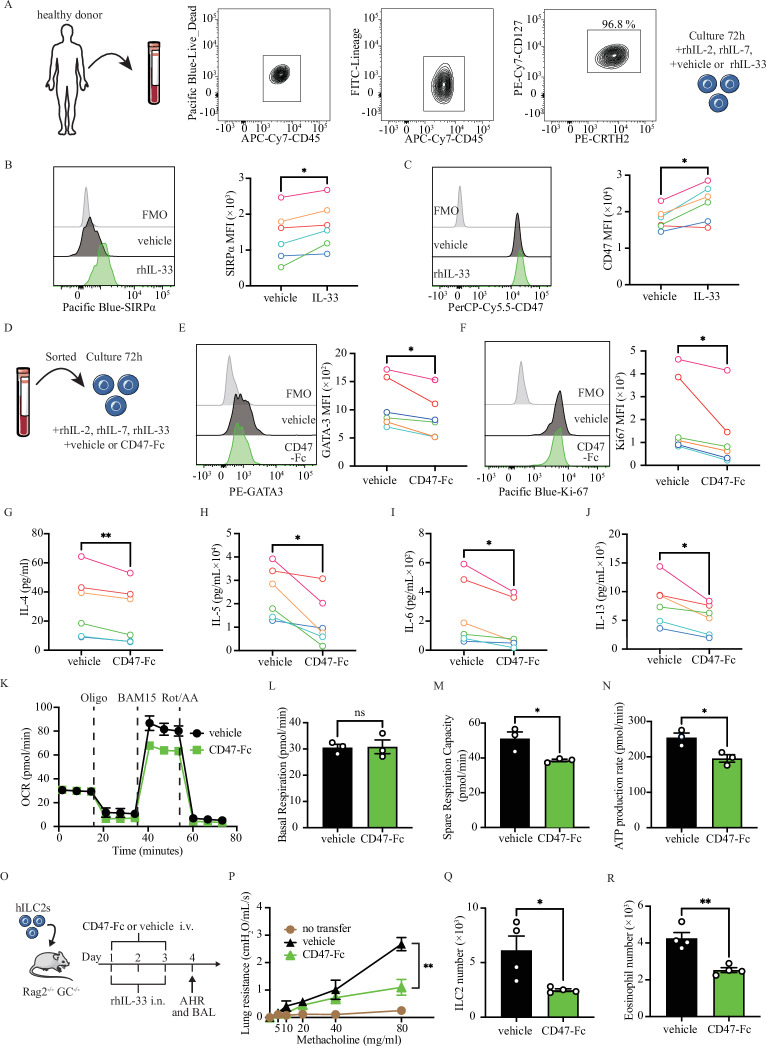
Group-2 innate lymphoid cells (ILC2) are part of a growing family of innate lymphocytes known for their crucial role in both the development and exacerbation of allergic asthma. The activation and function of ILC2s are regulated by various activating and inhibitory molecules, with their balance determining the severity of allergic responses. In this study, we aim to elucidate the critical role of the suppressor molecule signal regulatory protein alpha (SIRPα), which interacts with CD47, in controlling ILC2-mediated airway hyperreactivity (AHR). Our data indicate that activated ILC2s upregulate the expression of SIRPα, and the interaction between SIRPα and CD47 effectively suppresses both ILC2 proliferation and effector function. To evaluate the function of SIRPα in ILC2-mediated AHR, we combined multiple approaches including genetically modified mouse models and adoptive transfer experiments in murine models of allergen-induced AHR. Our findings suggest that the absence of SIRPα leads to the overactivation of ILC2s. Conversely, engagement of SIRPα with CD47 reduces ILC2 cytokine production and effectively regulates ILC2-dependent AHR. Furthermore, the SIRPα-CD47 axis modulates mitochondrial metabolism through the JAK/STAT and ERK/MAPK signaling pathways, thereby regulating NF-κB activity and the production of type 2 cytokines. Additionally, our studies have revealed that SIRPα is inducible and expressed on human ILC2s, and administration of human CD47-Fc effectively suppresses the effector function and cytokine production. Moreover, administering human CD47-Fc to humanized ILC2 mice effectively alleviates AHR and lung inflammation. These findings highlight the promising therapeutic potential of targeting the SIRPα-CD47 axis in the treatment of ILC2-dependent allergic asthma.

Keywords: AHR; Asthma; CD47; ILC2; SIRPa.


Conflict of interest statement

The authors declare no competing interests.

Figures

Fig. 1
Fig. 1
SIRPα expression is upregulated in activated ILC2s and controls ILC2s function. A UMAP projections of total ILC2s (left panel) and naïve ILC2s (nILC2s) versus IL-33-activated ILC2s (middle panel). Pure populations of either naïve or IL-33-activated pulmonary ILC2s were profiled by scRNAseq. Expression level of SIRPα is demonstrated on a gradient from gray (lowest expression) to solid red (highest expression). Violin plots comparing Sirpα expression level in naïve ILC2s (blue plot) versus IL-33-activated ILC2s (red plot). Dots represent cells. B The volcano plot shows the expression level of Sirpα in Sirpα-positive ILC2 cells based on Il5 and Il13 transcript levels. The dots represent cells, and Sirpα expression level is indicated by the color scale ranging from purple (lowest expression) to yellow (highest expression). C Pulmonary nILC2s from C57BL/6 WT mice were sorted using FACS and cultured (50 × 104/ml) ex vivo in the presence of rmIL-2 (10 ng/ml), rmIL-7 (10 ng/ml), and rmIL-33 (50 ng/ml) for the indicated durations at 37 °C. Flow cytometry analysis assessed SIRPα expression over time. D Representative plots depict SIRPα protein expression levels at 0-, 24-, 48-, and 72 h post-culture. The gray plot represents Fluorescence-minus-one (FMO) control. Corresponding quantitation is presented as Mean Fluorescence Intensity (MFI); n = 3. E WT mice were intranasally challenged with rmIL-33 or PBS over 3 consecutive days. Lung ILC2s were isolated on day 4 and SIRPα expression in ILC2s was analyzed. F Representative plots of SIRPα protein expression levels in PBS and IL-33 group. The gray plot is FMO. Quantification is shown as MFI; n = 4. G Activated ILC2s were FACS-sorted based on SIRPα expression into SIRPα- (bule rectangle) and SIRPα+ (red rectangle) populations. H, I Intranuclear protein expression levels of GATA-3 (H) and Ki67 (I) in SIRPα- versus SIRPα+ ILC2s. Corresponding quantitation is presented as MFI; n = 3. J, K Frequency (%) of IL-5+ and IL-13+ ILC2s in both SIRPα- and SIRPα+ populations; n = 5. LQ WT mice received intranasal doses of rmIL-33 over 3 consecutive days. Activated ILC2s were sorted and cultured with rmIL-2 (10 ng/ml) and rmIL-7 (10 ng/ml) in the presence of either vehicle or anti-SIRPα antibody (20 μg/mL) for 24 h. M, N GATA-3 (M) and Ki67 (N) expression levels in activated ILC2s are shown. Corresponding quantitation is presented as MFI; n = 4. O, Q Levels of IL-5 (O) and IL-13 (Q) production in the culture supernatant were measured by LEGENDPLEX and are shown in bar graphs; n = 4. RV Activated ILC2s from WT and SIRPα KO mice were cultured with rmIL-2 and rmIL-7 for 24 h. S, T Expression of GATA-3 (S) and Ki67 (T) in activated ILC2s is depicted. Corresponding quantitation is presented as MFI; n = 4. U, V Levels of IL-5 (U) and IL-13 (V) production in the culture supernatant were measured; n = 3. Data are presented as mean ± standard error of the mean (SEM) and are representative of at least 2 independent experiments. Two-tailed student’s t-test or one-way ANOVA followed by Tukey post-hoc tests were employed for statistical analysis; *< 0.05, **< 0.01, and ***< 0.001. Schematic images are sourced by an open-access license from Servier Medical Art
Fig. 2
Fig. 2
SIRPα deficiency aggravates AHR and lung inflammation. AK Cohorts of WT and SIRPα KO mice were intranasally exposed to 0.5 µg of rmIL-33 or PBS for 3 days. On day 4, lung function, pulmonary ILC2s, BAL cellularity and cytokine levels, as well as histology were analyzed. B, C Lung resistance (B) and dynamic compliance (C) in response to elevating doses of methacholine are displayed; n = 5. DF The total number of ILC2s per lung (D), total number of CD45+ cells (E) and CD45+, Gr-1-, CD11c-, SiglecF+ eosinophils (F) in BAL fluid are demonstrated in bar graphs; n = 5. G, H Levels of IL-5 (G) and IL-13 (H) in the BAL fluid were measured by LEGENDPLEX and are shown in bar graphs; n = 5. I Lung histologic sections stained with hematoxylin and eosin (H&E) are displayed; scale bars=50 µm. J, K Quantification of airway epithelium thickness (J) and infiltrating cells (K); n = 3. LV Cohorts of Rag−/−GC−/− mice were intravenously injected with 4 × 105 activated ILC2s isolated from either WT or SIRPα KO mice. Recipient mice were received 1.0 µg rmIL-33 or PBS intranasally for 4 days. On day 5, lung function, pulmonary ILC2s, BAL cellularity and cytokine levels, as well as histology were analyzed. M, N Lung resistance (M) and dynamic compliance (N) in response to elevating doses of methacholine are depicted; n = 5. OS The total number of ILC2s per lung (O), total number of CD45+ cells (P) and CD45+, Gr-1-, CD11c-, SiglecF+ eosinophils (Q) in BAL fluid are demonstrated in bar graphs; n = 5. R, S Levels of IL-5 (R) and IL-13 (S) in the BAL fluid are shown in bar graphs; n = 5. T Lung histologic sections stained with hematoxylin and eosin (H&E) are presented; scale bars=50 µm. U, V Quantification of airway epithelium thickness (U) and infiltrating cells (V); n = 3. Data are presented as means ± SEM and are representative of at least 2 independent experiments. Two-tailed student’s t-test or one-way ANOVA followed by Tukey post-hoc tests were employed for statistical analysis; *< 0.05, **< 0.01, ***< 0.001, and ****< 0.0001. Schematic images are sourced by an open access license from Servier Medical Art
Fig. 3
Fig. 3
SIRPα deficiency exacerbates A. alternata-induced AHR in acute and chronic models. AL WT and SIRPα KO mice were intranasally received 100 µg of A. alternata on days 1–4. On day 5, AHR and lung inflammation were assessed. B, C Lung resistance (B) and dynamic compliance (C) in response to elevating doses of methacholine are displayed; n = 5. DG The total number of ILC2s per lung (D), total number of CD45+ cells (E) and eosinophils (F) in BAL fluid are demonstrated in bar graphs; n = 5. G, H Levels of IL-5 (G) and IL-13 (H) in the BAL fluid were measured by LEGENDPLEX and shown in bar graphs; n = 5. I Lung histologic sections stained with hematoxylin and eosin (H&E) are illustrated; scale bars=50 µm. J, K Quantification of airway epithelium thickness (J) and infiltrating cells (K); n = 3. L A cohort of WT and SIRPα KO mice were challenged intranasally with Alternaria alternata (A. alternata) or PBS for first three days. They were then challenged on day 7, 11, 14, 18, 21, and 25. M, N Lung resistance (M) and dynamic compliance (N) in response to elevating doses of methacholine; n = 5. OQ Total number of ILC2s per lung (O), and total number of CD45+ cells (P) and eosinophils (Q) in BAL fluid have been demonstrated in bar graphs; n = 5. R, S Levels of IL-5 (R) and IL-13 (S) in the BAL fluid; n = 5. T Lung histologic sections stained with hematoxylin and eosin (H&E) are presented; scale bars=50 µm. U, V Quantification of airway epithelium thickness (U) and infiltrating cells (V); n = 3. Data are presented as means ± SEMs and are representative of at least 2 independent experiments. Two-tailed student’s t-test or one-way ANOVA followed by Tukey post-hoc tests; *p < 0.05, **p < 0.01, and ***p < 0.001. Schematic images are sourced by an open-access license from Servier Medical Art
Fig. 4
Fig. 4
SIRPα modulates ILC2 mitochondrial respiration via NF-κB pathways. AP Cohorts of WT and SIRPα KO mice were intranasally challenged with rmIL-33 over 3 consecutive days. On day 4, lung ILC2s were isolated and cultured with rmIL-2 and rmIL-7 for 24 h. B Total RNA was extracted to perform a bulk transcriptomic analysis. Volcano plots represent differentially expressed genes. C Gene set enrichment analysis by Ingenuity Pathway Analysis (IPA) depicting critical pathways regulated in SIRPα-deficient ILC2s. D Dot plot representation of selected critical genes involved in ILC2 related genes, MAPK, and JAK/STAT pathways. Dot size is indicative of the total gene expression level. E Overview of downstream SIRPα signaling elements. FI Cohorts of WT and SIRPα KO mice were challenged intranasally for 3 days with rmIL-33. On day 4, lung ILC2s were isolated and cultured with rmIL-2, rmIL-7 for 24 h. Representative histogram of protein expression of pSTAT3 (G), p38 (H), KLF2 (I), and p65 (J). Corresponding quantitation is presented as MFI; n = 4. Corresponding quantitation is presented for each protein as MFI; n = 4. K Dot plot representation of selected critical genes involved in OXPHOS and Mitochondrial respiratory pathways. Dot size is indicative of the total gene expression level. LO Mitochondrial respiratory profile showing oxygen consumption rates (OCR) in response to sequential injections of Oligomycin (ATP synthase inhibitor), BAM15 (mitochondrial uncoupler), and Rotenone + antimycin A (complex I and II inhibitors). Key parameters of mitochondrial function, including basal respiration (M), spare respiratory capacity (N), and ATP production rate (O) are presented; n = 3. P Mitochondrial sizes were assessed using Mito Tracker green and are shown in plot graphs. Data are presented as mean +/− SEM and are representative of at least 2 experiments. Two-tailed student’s t-test was employed for statistical analysis; *< 0.05, **< 0.01, ***< 0.001, and ns= non-significant. Schematic images are sourced by an open-access license from Servier Medical Art
Fig. 5
Fig. 5
Lack of CD47 increases ILC2 function and aggravates AHR. A Pulmonary nILC2s from C57BL/6 WT mice were sorted using FACS and cultured (50 × 104/ml) ex vivo in the presence of rmIL-2 (10 ng/ml), rmIL-7 (10 ng/ml), and rmIL-33 (50 ng/ml) for the indicated durations at 37 °C. Flow cytometry analysis assessed CD47 expression over time. Representative plots depict CD47 protein expression levels at 0-, 24-, 48-, and 72 h post-culture. The gray plot represents Fluorescence-minus-one (FMO) control. Corresponding quantitation is presented as Mean Fluorescence Intensity (MFI); n = 3. B WT mice were intranasally challenged with rmIL-33 or PBS over 3 consecutive days. Lung ILC2s were isolated on day 4 and CD47 expression in ILC2s was analyzed. Representative plots of CD47 protein expression levels in PBS and IL-33 group. The gray plot is FMO. Quantification is shown as MFI; n = 4. CG Activated ILC2s were sorted from WT and CD47 KO mice following three intranasal challenges with rm-IL-33 (0.5 μg/mouse). Sorted cells were incubated with rmIL-2 and rmIL-7 for 24 h. D, E Expression levels of GATA-3 (D) and Ki67 (E) in activated ILC2s are presented. Corresponding quantitation is presented as MFI; n = 4. F, G Levels of IL-5 (F) and IL-13 (G) production in the culture supernatant were measured; n = 4. HR A cohort of WT and CD47 KO mice received were intranasally exposed to 0.5 µg of rmIL-33 or PBS for 3 days. On day 4, lung function, pulmonary ILC2s, BAL cellularity, and cytokine levels, as well as histology were analyzed. I, J Lung resistance (I) and dynamic compliance (J) in response to elevating doses of methacholine; n = 5. KM Total number of ILC2s per lung (K) as well as total number of CD45+ cells (L) and eosinophils (M) in BAL fluid have been demonstrated in bar graphs; n = 5. N, O Levels of IL-5 (N) and IL-13 (O) in the BAL fluid were measured by Legendplex and shown in bar graphs; n = 5. P Lung histologic sections stained with hematoxylin and eosin (H&E); scale bars=50 µm. Q, R Quantification of airway epithelium thickness (Q) and infiltrating cells (R); n = 3. Data are presented as means ± SEM and are representative of at least 2 independent experiments. Statistical analysis was performed using two-tailed Student’s t-test; *< 0.05, **< 0.01, ***< 0.001, and ****< 0.0001. Schematic images are sourced by an open access license from Servier Medical Art
Fig. 6
Fig. 6
CD47 administration controls ILC2 function via activating SIRPα signaling. A)WT (CD45.1) and CD47 KO (CD45.2) mice were intranasally exposed to 0.5 μg rmIL-33 for three days, and lung ILC2s were isolated on day four. Two groups were formed: one consisting ILC2s from only CD47 KO mice (monoculture group), and another consisting of ILC2s from both CD47 KO (CD45.2) and WT (CD45.1) mice, which were co-cultured in a 1:1 ratio (co-culture group) and incubated for 24 h. The function of CD47 KO-derived ILC2 in each group was then evaluated by FACS. B, C Expression levels of GATA-3 (B) and Ki67 (C) in activated ILC2s are presented. Corresponding quantitation is presented as MFI; n = 4. D Frequency (%) of IL-5+ and IL-13+ ILC2s in both monoculture and co-culture groups; n = 4. EI WT mice received intranasal doses of rmIL-33 over 3 consecutive days. Activated ILC2s were sorted and cultured with rmIL-2 (10 ng/ml) and rmIL-7 (10 ng/ml) in the presence of either vehicle or CD47-Fc (20 μg/mL) for 24 h. F, G GATA-3 (F) and Ki67 (G) expression levels in activated ILC2s are shown. Corresponding quantitation is presented as MFI; n = 4. H, I Levels of IL-5 (H) and IL-13 (I) production in the culture supernatant were measured by LEGENDPLEX and are shown in bar graphs; n = 4. J WT mice were treated with rmIL-33 by intranasal injection for three days in a row. Activated ILC2 cells were sorted and cultured with rmIL-2 (10 ng/ml) and rmIL-7 (10 ng/ml). The following day, vehicle or CD47-Fc (20 μg/mL) was added to the culture wells and analyzed by FACS after one hour. K Overview of downstream SIRPα signaling elements. LO Representative histogram of protein expression of pSTAT3 (L), p38 (M), KLF2 (N), and p65 (O). Corresponding quantitation is presented for each protein as MFI; n = 4. Data are presented as means ± SEM and are representative of at least 2 independent experiments. Two-tailed student’s t-test or one-way ANOVA followed by Tukey post-hoc tests were employed for statistical analysis; *< 0.05, **< 0.01, ***< 0.001, and ****< 0.0001. Schematic images are sourced by an open access license from Servier Medical Art
Fig. 7
Fig. 7
CD47 administration alleviates IL-33- and A. alternata-induced AHR. AK WT mice received intravenous injections of 50 μg CD47-Fc or vehicle and were intranasally exposed to 0.5 µg of rmIL-33 or PBS for 3 days. On day 4, lung function, pulmonary ILC2s, BAL cellularity and cytokine levels, as well as histology were analyzed. B, C Lung resistance (B) and dynamic compliance (C) in response to increasing doses of methacholine are depicted; n = 4. DF Total number of ILC2s per lung (D), total number of CD45+ cells (E) and eosinophils (F) in BAL fluid are demonstrated in bar graphs; n = 4. G, H Levels of IL-5 (G) and IL-13 (H) in the BAL fluid were measured by LEGENDPLEX and are shown in bar graphs; n = 4. I Lung histologic sections stained with hematoxylin and eosin (H&E) are displayed; scale bars=50 µm. JK Quantification of airway epithelium thickness (J) and infiltrating cells (K); n = 3. LV Rag2−/− mice received intravenous injections of 50 μg CD47-Fc or vehicle and was intranasally exposed to 100 µg of A. alternata on days 1–4. On day 5, AHR and lung inflammation were assessed. M, N Lung resistance (M) and dynamic compliance (N) in response to elevating doses of methacholine; n = 5. OQ Total number of ILC2s in the lung (O), and the total number of CD45+ cells (P), eosinophils (Q) in BAL fluid; n = 5. R, S Levels of IL-5 (R) and IL-13 (S) in the BAL fluid; n = 5. T Lung histology; scale bars=50 µm. U, V Quantification of airway epithelium thickness and infiltrating cells; n = 3. Data are presented as means ± SEMs and are representative of at least 2 independent experiments. Two-tailed student’s t-test or one-way ANOVA followed by Tukey post-hoc tests; *p < 0.05, **p < 0.01, and ***p < 0.001. Schematic images are sourced by an open-access license from Servier Medical Art
Fig. 8
Fig. 8
SIRPα regulates human ILC2 function and proliferation. AC Human ILC2s (CD45+, Lineage-, CRTH2+, CD127+) were freshly isolated from peripheral blood mononuclear cells (PBMCs) of healthy donors and cultured with recombinant human (rh)IL-2 and rhIL-7 (both 20 ng/mL) with or without rhIL-33 (100 ng/mL) for 72 h. B Representative histogram plots of SIRPα expression in human ILC2s (hILC2s) and corresponding quantitation presented as MFI; n = 6. C Representative histogram plots of CD47 expression in human ILC2s (hILC2s) and corresponding quantitation presented as MFI; n = 6. D Freshly isolated hILC2s from healthy donors were cultured in the presence of rhIL-2, rhIL-7 (both 20 ng/mL), and rhIL-33 (100 ng/mL), with vehicle or CD47-Fc (20 µg/mL) for 72 h. E, F Representative histogram plots of intranuclear GATA-3 (E) and Ki67 (F) expression levels and corresponding quantitation presented as MFI; n = 6. GJ Levels of IL-4 (G), IL-5 (H), IL-6 (I), and IL-13 (J) in the culture supernatants following treatment with vehicle or CD47-Fc (20 µg/mL); n = 6. K Mitochondrial respiratory profile showing oxygen consumption rates (OCR) in response to sequential injections of Oligomycin (ATP synthase inhibitor), BAM15 (mitochondrial uncoupler), and Rotenone + antimycin A (complex I and II inhibitors). Corresponding key parameters of mitochondrial function, including basal respiration (L), spare respiratory capacity (M), and ATP production rate (N); n = 3. O Schematic representation of the AHR induction in alymphoid mice adoptively transferred with human ILC2s. Freshly CD45+ Lineage- CRTH2+ CD127+ hILC2s were isolated from PBMCs of healthy subjects and cultured (5 × 105/mL) in rhIL-2, rhIL-7, (both 20 ng/mL) with decreasing doses of rhIL-33 (from 100 ng/mL to 10 ng/mL) for 10 days. 2 × 105 hILC2s were then transferred intravenously to Rag−/−GC−/− recipient mice, followed by intravenous injections of 25 μg human CD47-Fc or vehicle and intranasal exposure to 1 µg of rhIL-33 or PBS for 3 days. On day 4, lung function, lung ILC2s and BAL cellularity were analyzed. P Lung resistance in response to increasing doses of methacholine; n = 4. Q Total number of hILC2s per lung, n = 4. R Total number of BAL eosinophils (CD45+, CD11c-, SiglecF+), n = 4. Two-tailed student’s t-test was employed for statistical analysis; Data presented as mean +/− SEM. *< 0.05, **< 0.01, ***< 0.001 and ns= non-significant. Schematic images are sourced by an open-access license from Servier Medical Art

References

    1. Pate CA, Zahran HS, Qin X, Johnson C, Hummelman E, Malilay J. Asthma Surveillance - United States, 2006-2018. MMWR Surveill Summ. 2021;70:1–32. - PMC - PubMed
    1. Backman H, Jansson SA, Stridsman C, Eriksson B, Hedman L, Eklund BM, et al. Severe asthma-A population study perspective. Clin Exp Allergy. 2019;49:819–28. - PubMed
    1. Rönnebjerg L, Axelsson M, Kankaanranta H, Backman H, Rådinger M, Lundbäck B, et al. Severe Asthma in a General Population Study: Prevalence and Clinical Characteristics. J Asthma Allergy. 2021;14:1105–15. - PMC - PubMed
    1. Wang E, Wechsler ME, Tran TN, Heaney LG, Jones RC, Menzies-Gow AN, et al. Characterization of Severe Asthma Worldwide: Data From the International Severe Asthma Registry. Chest. 2020;157:790–804. - PubMed
    1. Cao Y, Li Y, Wang X, Liu S, Zhang Y, Liu G, et al. Dopamine inhibits group 2 innate lymphoid cell-driven allergic lung inflammation by dampening mitochondrial activity. Immunity. 2023;56:320–35.e9. - PubMed

MeSH terms