Observational Study
. 2024 Sep;56(9):1878-1889.
doi: 10.1038/s41588-024-01853-0. Epub 2024 Aug 19.

Comprehensive molecular profiling of multiple myeloma identifies refined copy number and expression subtypes

Collaborators, Affiliations
Observational Study

Comprehensive molecular profiling of multiple myeloma identifies refined copy number and expression subtypes

Sheri Skerget et al. Nat Genet. 2024 Sep.

Erratum in

  • Author Correction: Comprehensive molecular profiling of multiple myeloma identifies refined copy number and expression subtypes.
    Skerget S, Penaherrera D, Chari A, Jagannath S, Siegel DS, Vij R, Orloff G, Jakubowiak A, Niesvizky R, Liles D, Berdeja J, Levy M, Wolf J, Usmani SZ; MMRF CoMMpass Network; Christofferson AW, Nasser S, Aldrich JL, Legendre C, Benard B, Miller C, Turner B, Kurdoglu A, Washington M, Yellapantula V, Adkins JR, Cuyugan L, Boateng M, Helland A, Kyman S, McDonald J, Reiman R, Stephenson K, Tassone E, Blanski A, Livermore B, Kirchhoff M, Rohrer DC, D'Agostino M, Gambella M, Collison K, Stumph J, Kidd P, Donnelly A, Zaugg B, Toone M, McBride K, DeRome M, Rogers J, Craig D, Liang WS, Gutierrez NC, Jewell SD, Carpten J, Anderson KC, Cho HJ, Auclair D, Lonial S, Keats JJ. Skerget S, et al. Nat Genet. 2025 Jul;57(7):1789. doi: 10.1038/s41588-025-02251-w. Nat Genet. 2025. PMID: 40490515 Free PMC article. No abstract available.

Abstract

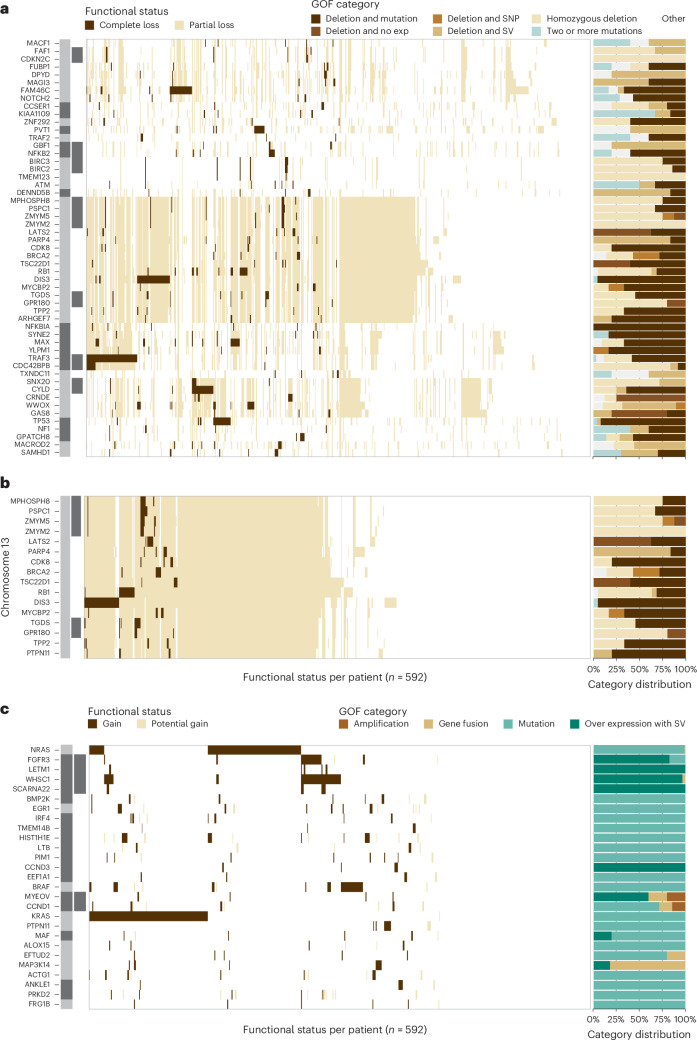
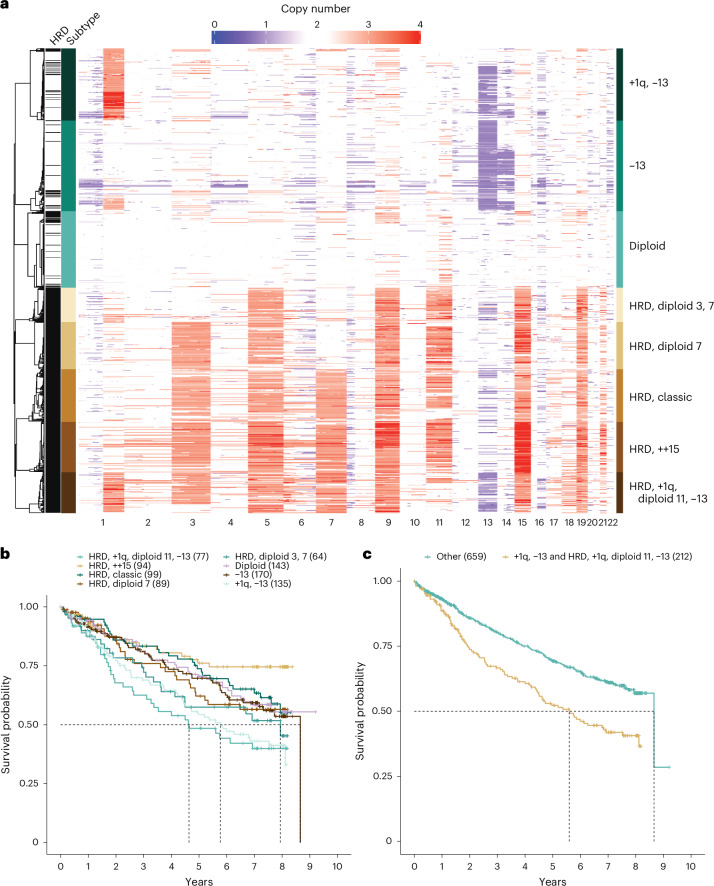
Multiple myeloma is a treatable, but currently incurable, hematological malignancy of plasma cells characterized by diverse and complex tumor genetics for which precision medicine approaches to treatment are lacking. The Multiple Myeloma Research Foundation's Relating Clinical Outcomes in Multiple Myeloma to Personal Assessment of Genetic Profile study ( NCT01454297 ) is a longitudinal, observational clinical study of newly diagnosed patients with multiple myeloma (n = 1,143) where tumor samples are characterized using whole-genome sequencing, whole-exome sequencing and RNA sequencing at diagnosis and progression, and clinical data are collected every 3 months. Analyses of the baseline cohort identified genes that are the target of recurrent gain-of-function and loss-of-function events. Consensus clustering identified 8 and 12 unique copy number and expression subtypes of myeloma, respectively, identifying high-risk genetic subtypes and elucidating many of the molecular underpinnings of these unique biological groups. Analysis of serial samples showed that 25.5% of patients transition to a high-risk expression subtype at progression. We observed robust expression of immunotherapy targets in this subtype, suggesting a potential therapeutic option.


Conflict of interest statement

S.S. is currently employed by Janssen. A.C. has received research funding from Amgen, BMS, Janssen, Seattle Genetics and Takeda, and is a speaker/consultant/advisory board member for Abbvie, Amgen, Antengene, BMS, Genentech, GSK, Janssen, Karyopharm, Sanofi, Seattle Genetics, Secura Bio, Shattuck Labs and Takeda. S.J. is a speaker/consultant/advisory board member for BMS, Caribou Biosciences, DMC, Janssen, Regeneron, Sanofi and Takeda. D.S.S. has received research funding from Amgen, BMS, Janssen, Karyopharm, Novartis and Takeda, and is a speaker/consultant/advisory board member for Amgen, BMS, Celularity Scientific, Janssen, Karyopharm, Novartis and Takeda. R.V. has received research funding from BMS, Sanofi and Takeda, and is a speaker/consultant/advisory board member for BMS, Harpoon, Janssen Karyopharm, Legend Biotech, Pfizer, Sanofi and Takeda. A.J. is a speaker/consultant/advisory board member for Abbvie, BMS, Amgen, GSK, Janssen and Sanofi. R.N. has received research funding from BMS, GSK, Janssen, Karyopharm, Pfizer, Regeneron and Takeda, and is a speaker/consultant/advisory board member for BMS, GSK, Janssen, Karyopharm, Pfizer, Regeneron, Sanofi and Takeda. D.L. has received research funding from Annexon Biosciences, Alpine Immune, Abbvie, Astex Pharmaceuticals, Baxalta, BeiGene, Bioverativ, CSL Behring, BMS, Delta-Fly Pharma, Exact Sciences, Forma Therapeutics, Global Blood Therapeutics, Immunovant, Incycte, Janssen, NeoImmuneTech, Novartis, Novo Nordisk, Partner Therapeutics, Pharm-Olam, Principia Biopharma, Salix Pharmaceuticals, Sanofi, Takeda and Vifor Pharma. J.B. has received research funding from AbbVie, Acetylon, Amgen, BMS, C4 Therapeutics, CARSgen, Cartesian, Celularity, CRISPR Therapeutics, EMD Serono, Fate Therapeutics, Genentech, GSK, Ichnos Sciences, Incyte, Janssen, Karyopharm, Lilly, Novartis, Poseida, Sanofi, Takeda, Teva and 2seventy bio, and is a speaker/consultant/advisory board member for BMS, CRISPR Therapeutics, Janssen, Kite Pharma, Legend Biotech, Roche and Takeda. M.L. is a speaker/consultant/advisory board member for Abbvie, Amgen, AstraZeneca, BeiGene, BMS, Gilead, Genmab, Janssen, Jazz, Karyopharm, Morphosys, Novartis, Seagen, Sellas, Sobi, Sanofi and Takeda. S.Z.U. has received research funding from AbbVie, Amgen, Array Biopharma, BMS, EdoPharma, Gilead Sciences, GSK, Janssen, K36 Therapeutics, Merck, Moderna, Pharmacyclics, Sanofi, Seattle Genetics, SkylineDX and Takeda, and is a speaker/consultant/advisory board member for BMS, Genentech, Gilead Sciences, GSK, Janssen, Novartis, Oncopeptides, Sanofi, Seattle Genetics, Secura Bio, SkylineDX, Takeda and TeneoBio. M.D’A. has received research funding from Janssen and is a speaker/consultant/advisory board member for Adaptive Biotechnology, BMS, GSK, Janssen and Sanofi. M.D. is currently employed by the funder (MMRF). J.R. is currently employed by the funder (MMRF). K.C.A. is a speaker/consultant/advisory board member for Amgen, AstraZeneca, Daewoong, Dynamic Cell Therapies, Janssen, Pfizer, Mana Therapeutics, Oncopep, Precision Biosciences, Starton and Window Therapeutics, and is an equity holder in C4 Therapeutics, Dynamic Cell Therapies, NextRNA, Oncopep, Raqia, Starton and Window Therapeutics. H.J.C. is currently employed by the funder (MMRF) and has received research funding from BMS and Takeda. D.A. was previously employed by the funder (MMRF) and is currently employed by AstraZeneca. S.L. has received research funding from BMS, Janssen, Novartis and Takeda, and is a speaker/consultant/advisory board member for AbbVie, Amgen, BMS, Genentech, GSK, Janssen, Novartis, Pfizer, TG Therapeutics and Takeda. J.J.K. has received research funding from Amgen, Genentech and Janssen, and is a speaker/consultant/advisory board member for Janssen. The other authors declare no competing interests.

Figures

Fig. 1
Fig. 1. Recurrent LOF and GOF events occurring in at least five patients at diagnosis ordered by event frequency.
The location and proximity of individual genes are shown next to each gene with the alternating gray and black bars illustrating when the chromosomal location changes, while black bars directly to the right denote contiguous genes. Each tick along the x axis represents a patient with the corresponding event. a, Complete LOF was observed in 53 autosomally located genes. b, Genes on chr13q that were the target of complete LOF events in at least five patients in the baseline cohort. c, GOF events were detected in 27 autosomal genes due to amplification, gene fusions, mutations or over expression associated with a structural variant (SV).
Fig. 2
Fig. 2. Copy number subtypes of multiple myeloma.
a, Consensus clustering of WGS copy number data identified eight unique copy number subtypes, comprising five HRD and three NHRD clusters that were annotated based on common copy number features. b, Pointwise OS estimates are shown by the respective lines for each copy number subtype. Median OS was met for the HRD, +1q, diploid 11, −13 (55.7 months, 95% CI = 31.7–NA (not available)), +1q, −13 (69.3 months, 95% CI = 53.0–97.4), HRD, diploid 3, 7 (95.3 months, 95% CI = 43.6–NA) and −13 (103.9 months, 95% CI = 79.2–NA) subtypes. Pairwise outcome comparisons identified eight significantly different subtypes by the log-rank test after multiple testing corrections using the Benjamini–Hochberg method. The significant differences were between the HRD, +1q, diploid 11, −13 subtype and HRD, ++15 (P = 0.0015), HRD, classic (P = 0.0373), diploid (P = 0.0373) or −13 (P = 0.0373); between the +1q, −13 subtype and HRD, ++15 (P = 0.0015), HRD, classic (P = 0.0373) or diploid (P = 0.0448); and between HRD, ++15 and HRD, diploid 3, 7 (P = 0.03733). c, Pointwise OS estimates are shown by the respective lines, and pairwise outcomes were compared by the log-rank test, which showed a significant difference (P = 9.5 × 10−6) between patients in the +1q, −13 and HRD, +1q, diploid 11, −13 groups (median = 67.2 months, 95% CI = 53.0–83.2) versus patients in other copy number subtypes (median = 103.9, 95% CI = 103.9–NA).
Fig. 3
Fig. 3. RNA subtypes of multiple myeloma and associated characteristics.
a, Consensus clustering of RNA-seq data revealed 12 RNA subtypes of multiple myeloma. The MYC STR flag indicates the detection of a MYC translocation (Ig or non-Ig) or intrachromosomal deletion centromeric of MYC. b, Pointwise OS estimates are shown by the respective lines for each RNA subtype. Median OS was reached for the PR (21.3 months, 95% CI = 15.0–55.3); HRD, low TP53 (55.4 months, 95% CI = 36.7–NA); MS (79.2 months, 95% CI = 57.3–97.4) and MAF (103.9 months, 95% CI = 34.4–NA) subtypes. Pairwise outcome comparisons identified ten significantly different subtypes by the log-rank test after multiple testing corrections using the Benjamini–Hochberg method. All significantly different pairs were compared against the PR subtype, with P values ranging from 0.03305 compared to MAF and 1.3 × 10−6 compared to HRD, ++15. The only PR pairwise comparison that was not significant was against HRD, low TP53, the subtype with the second lowest median OS. c, Pointwise OS estimates of patients in the PR (21.3 months, 95% CI = 15.0–55.3) versus non-PR (median = 103.9 months, 95% CI = 97.4–NA) subtype at diagnosis (P = 1.1 × 10−10), HR = 3.16 (95% CI = 2.19–4.57). d,e, Expressed (median transcripts per million (TPM) > 1 in at least one group) checkpoint inhibitor (d) and immunotherapy (e) targets in independent non-PR (n = 663) versus PR (n = 51) patients. Significant differences in median expression between the two groups were determined using a two-sided unpaired Wilcoxon rank sum test and are indicated when significant (*P < 0.05, **P < 0.01 and ***P < 0.001).
Fig. 4
Fig. 4. RNA subtypes and significantly associated LOF and GOF events.
The location and proximity of individual genes are shown next to each gene with the alternating gray and black bars illustrating when the chromosomal location changes, while black bars directly to the right denote contiguous genes. LOF and GOF features that are significantly enriched or depleted within a specific RNA subtype are highlighted. Enrichment analysis was conducted using a two-tailed Fishers test, and the Benjamini–Hochberg test correction was used for multiple testing to compute a positive false discovery rate (pFDR) value. Genes are only included when pFDR ≤ 0.1, P < 0.05.
Fig. 5
Fig. 5. RNA subtype of serial patients at baseline and progression.
a, Node size reflects the relative number of patients in each RNA subtype at each time point, while edge width reflects the relative number of patients remaining in, or transitioning to, a particular RNA subtype, with the thinnest line and thickest line representing one and seven patients, respectively. b, Swimmers plot of patients in the PR subtype at either baseline or progression. Vertical breaks indicate visits with available RNA-seq data for RNA subtype prediction. Fill color indicates RNA subtype between visits. Asterisks denote OS events. c, Pointwise OS outcomes for serial patients who transition to the PR subtype at progression (median = 27.9 months, 95% CI = 18.9–68.1) versus those that do not (median = 81.5 months, 95% CI = 67.3–NA) are shown. The pairwise outcomes were significantly different (P = 0.0081) by the log-rank test.
Extended Data Fig. 1
Extended Data Fig. 1. Survival outcomes of the cohort.
Pointwise survival estimates are shown by the respective dark lines, while the 95% confidence interval is shown by the matching shaded bands. (a) Time to second line therapy (median 38.1 months, 95% CI = 35.2–40.6 months) and (b) overall survival (OS; median 103.6 months, 95% CI = 92.7–not met). The median of the CoMMpass cohort has been met; however, as of the IA22 release, there is insufficient follow-up to accurately report the upper limit of the OS 95% confidence interval. As expected, ISS stage stratified patients into three clinically distinct classes. (c) Time to second line therapy outcomes for patients classified as ISSI (53.7 months, 95% CI = 44.9–63.3), ISSII (35.7 months, 95% CI = 31.5–42.2) and ISSIII (24.4 months, 95% CI = 20.6–28.5) at diagnosis are clearly different. Pairwise outcomes were compared by the log-rank test after multiple testing corrections using the Benjamini–Hochberg method. Significant differences in outcomes were observed ISSI vs ISS2 (P = 7.6e−06), ISS1 vs ISS3 (P < 2e−16) and ISS2 vs ISS3 (P = 2.9e−05). (d) OS outcomes for patients classified as ISSI (103.9 months, 95% CI = NA–NA), ISSII (median not met, 95% CI = 91.3–NA) and ISSIII (53.9 months, 95% CI = 43.3–59.6) at diagnosis are compared with significant differences in outcomes observed for ISSI vs ISS2 (P = 0.00023), ISS1 vs ISS3 (P < 2e−16) and ISS2 vs ISS3 (P = 2.2e−09).
Extended Data Fig. 2
Extended Data Fig. 2. Copy number consensus clustering matrix.
Consensus clustering matrix with an optimal clustering solution of K = 8. The M3C (Monte Carlo reference-based) consensus clustering algorithm was applied to the CN measurements of 26,771 (100 Kb) intervals across the GRCh37 reference genome for 871 WGS BM-derived baseline samples. Five of the eight subtypes include only samples classified as hyperdiploid.
Extended Data Fig. 3
Extended Data Fig. 3. Survival outcomes for patients with gain(1q21) and del(13q14).
(a) Time to second line therapy, and (b) OS outcomes for CoMMpass patients with gain(1q21) and del(13q14) (both), gain(1q21) alone, del(13q14) alone and those with neither event. gain(1q21) was defined as a gain of 1 or more copies of 1q21, whereas del(13q14) was defined as a loss of one copy of 13q14. There is a significant difference in time to second line therapy and OS for all groups compared to the group with neither event (p < 0.05); however, there is no significant difference between the groups with gain(1q21) and/or del(13q14). The median time to second line therapy for gain(1q21), del(13q14) patients was 29.3 months (95% CI = 24.4–33.7), while gain(1q21) was 35.3 months (95% CI = 23.6–49.2), del(13q14) was 35.7 months (95% CI = 31.4–40.6), and for those with neither, it was 51.4 months (95% CI = 42.0–55.9). The median OS for gain(1q21), del(13q14) patients was 69.2 months (95% CI = 55.7–97.4), while gain(1q21) was 83.2 months (95% CI = 56.0–not met), del(13q14) was 92.7 months (95% CI = 72.7–not met), conversely the median has not been reached for those with neither. (c) In a univariate Cox proportional hazards model, both gain(1q21) (P = 8.2e−05) and del(13q14) (P = 0.0022) were found to significantly impact OS outcome using a Wald test. (d) In a multivariate model, both gain(1q21) (n = 307) and del(13q14) (n = 453) were found to have a significant impact on outcome within the full cohort of patients with CN data (n = 871). The box represents the hazard ratio, and the error bars represent the 95% confidence interval.
Extended Data Fig. 4
Extended Data Fig. 4. RNA-seq consensus clustering matrix.
Consensus matrix showing the consistency of class assignment for K = 12 clustering of RNA-seq data derived from 714 BM baseline samples and 4811 feature-selected genes.
Extended Data Fig. 5
Extended Data Fig. 5. RNA subtypes and association with copy number.
Copy number states for patients by RNA subtype are shown. Diploid copy number is represented as 2 (white), copy loss is shaded in blue and copy gain is shaded in red. Rare copy number values exceeding 4 are represented as a copy number value of 4 to maintain uniformity in the heatmap scales for gain and loss.
Extended Data Fig. 6
Extended Data Fig. 6. Relationship between proliferation index and RNA subtypes.
The association with an RNA-seq-defined proliferation index and CoMMpass subtypes is shown (n = 714). The Bergsagel proliferation index for each sample was determined by calculating the geometric mean expression of 12 genes (TYMS, TK1, CCNB1, MKI67, KIAA101, KIAA0186, CKS1B, TOP2A, UBE2C, ZWINT, TRIP13 and KIF11). The PR subtype had the highest median proliferation index score. The index range is shown as a boxplot with the upper and lower bounds of the box representing the 25th and 75th percentile, while the center line indicates the median and whiskers represent the highest and lowest value within 1.5 (IQR).
Extended Data Fig. 7
Extended Data Fig. 7. NF-kB index distribution by RNA subtype.
The association with an RNA-seq-defined NF-kB index and the CoMMpass subtypes is shown (n = 714). The NFKB(11) index for each sample was determined by calculating the geometric mean expression of 11 genes (BIRC3, TNFAIP3, NFKB2, IL2RG, NFKB1, RELB, NFKBIA, CD74, PLEK, MALT1 and WNT10A),. The index range is shown as a boxplot with the upper and lower bounds of the box representing the 25th and 75th percentile, while the center line indicates the median and whiskers represent the highest and lowest value within 1.5 (IQR).
Extended Data Fig. 8
Extended Data Fig. 8. Low-purity RNA subtype association with low-purity metrics.
The low-purity RNA subtype was defined based on an association of the samples in this category with multiple independent measures of sample purity. (a) An index associated with genes expressed in non-B-cell tissues was used to identify samples with contamination of non-B lineage cells in the CD138+-enriched cell fractions (n = 714). (b) Tumor purity was estimated from the exome copy number or mutation data based on the absolute allele frequency of constitutional variants in deletion regions or somatic SNV allele frequency in diploid regions of the genome when no usable deletions were detected in the tumor (n = 593). The range of estimated contamination (a) and purity (b) is shown as a boxplot with the upper and lower bounds of the box representing the 25th and 75th percentile, while the center line indicates the median and whiskers represent the highest and lowest value within 1.5 (IQR). (c) The full distribution of observed somatic SNV allele frequencies (n = 593) is shown as a violin plot, where the median is indicated by the horizontal line and the population frequency of the value is indicated by the width of the plot.
Extended Data Fig. 9
Extended Data Fig. 9. Change in RNA subtype probabilities over time.
RNA subtype probabilities for the 71 serial patients with RNA-seq data at two or more time points. All patients classified in the low-purity subtype at baseline have a discernable RNA subtype other than low purity at progression, supporting the observation that this subtype is driven by sample purity. Shifts from a non-PR baseline subtype to a largely PR subtype or partial population of PR cells are evident.
Extended Data Fig. 10
Extended Data Fig. 10. Deletion of CDKN2C in patients who transitioned to PR.
Two patients that transitioned to the PR subtype at progression acquired complete loss of function of CDKN2C due to overlapping deletion. Panels show long-insert WGS reads from tumor samples for patients MMRF_2523 (a) and MMRF_1269 (b) at baseline (non-PR) and progression (PR). (a) At baseline, patient MMRF_2523 was diploid (log2 CN = −0.0747) with no evidence of a deletion spanning CDKN2C; however, at progression, the patient had a 2-copy deletion of CDKN2C (blue bar, log2 CN = −3.3505) due to two unique deletions (red bars) spanning CDKN2C (green box). (b) At baseline, patient MMRF_1269 had a 1 copy loss of CDKN2C (light blue bar, log2 CN = −0.3511) due to a larger deletion on chr1. There is also read evidence supporting a deletion involving CDKN2C/FAF1, suggesting that a subclonal population with complete loss of CDKN2C was present at diagnosis in this patient. At progression, when the patient transitioned to PR, the patient’s tumor had a 2-copy deletion of CDKN2C (dark blue bar, log2 CN = −4.6212). In this patient, the minor clone harboring the CDKN2C deletion at baseline constitutes the bulk of the tumor population at progression.

References

    1. Lewis, J. P. & Mackenzie, M. R. Non‐random chromosomal aberrations associated with multiple myeloma. Hematol. Oncol.2, 307–317 (1984). - PubMed
    1. Avet-Loiseau, H. et al. Prognostic significance of copy-number alterations in multiple myeloma. J. Clin. Oncol.27, 4585–4590 (2009). - PMC - PubMed
    1. Carrasco, D. R. et al. High-resolution genomic profiles define distinct clinico-pathogenetic subgroups of multiple myeloma patients. Cancer Cell9, 313–325 (2006). - PubMed
    1. Venti, G., Mecucci, C., Donti, E. & Tabilio, A. Translocation t(11;14) and trisomy 11q13-qter in multiple myeloma. Ann. Genet.27, 53–55 (1984). - PubMed
    1. Bergsagel, P. L. et al. Promiscuous translocations into immunoglobulin heavy chain switch regions in multiple myeloma. Proc. Natl Acad. Sci. USA93, 13931–13936 (1996). - PMC - PubMed

Publication types