. 2024 Oct;43(19):4406-4436.
doi: 10.1038/s44318-024-00189-z. Epub 2024 Aug 19.

Mouse models to investigate in situ cell fate decisions induced by p53

Affiliations

Mouse models to investigate in situ cell fate decisions induced by p53

Elizabeth Lieschke et al. EMBO J. 2024 Oct.

Abstract

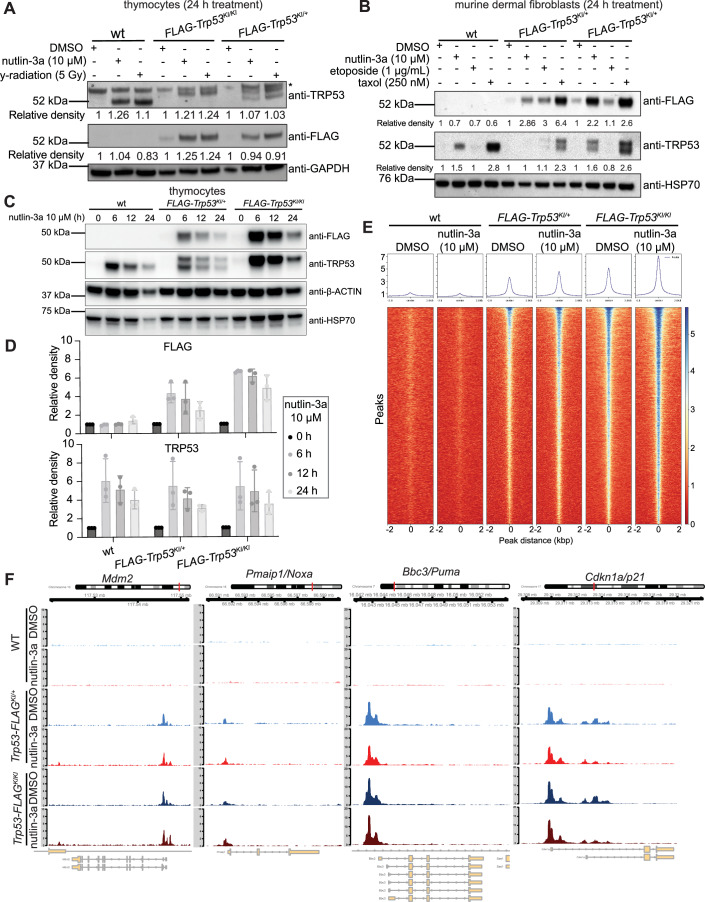
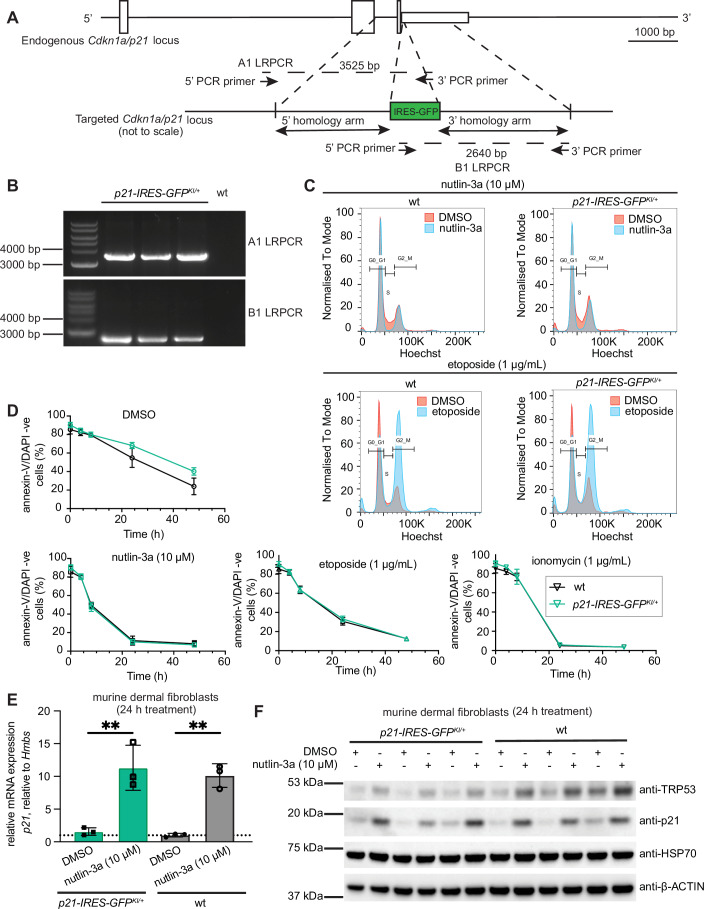
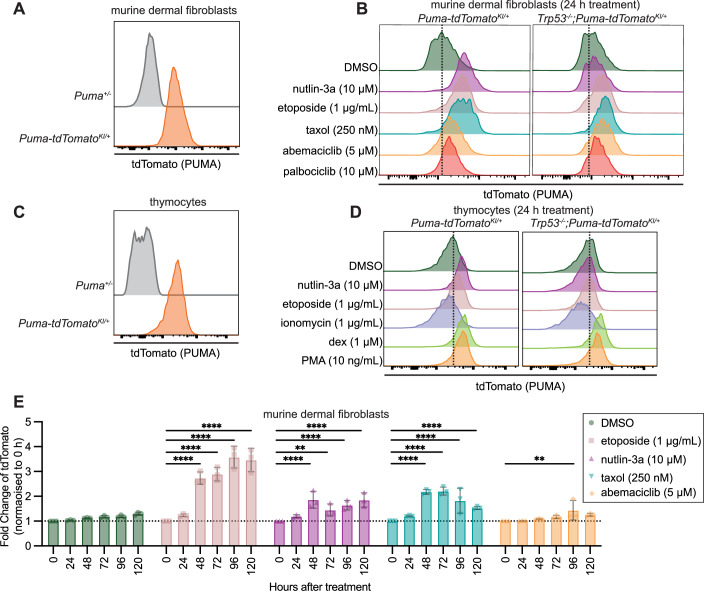
Investigating how transcription factors control complex cellular processes requires tools that enable responses to be visualised at the single-cell level and their cell fate to be followed over time. For example, the tumour suppressor p53 (also called TP53 in humans and TRP53 in mice) can initiate diverse cellular responses by transcriptional activation of its target genes: Puma to induce apoptotic cell death and p21 to induce cell cycle arrest/cell senescence. However, it is not known how these processes are regulated and initiated in different cell types. Also, the context-dependent interaction partners and binding loci of p53 remain largely elusive. To be able to examine these questions, we here developed knock-in mice expressing triple-FLAG-tagged p53 to facilitate p53 pull-down and two p53 response reporter mice, knocking tdTomato and GFP into the Puma/Bbc3 and p21 gene loci, respectively. By crossing these reporter mice into a p53-deficient background, we show that the new reporters reliably inform on p53-dependent and p53-independent initiation of both apoptotic or cell cycle arrest/senescence programs, respectively, in vitro and in vivo.

Keywords: Apoptosis; Cancer; Cell Cycle Arrest; Reporter Mice; p53/TRP53/TP53.


Conflict of interest statement

The authors declare no competing interests.

Figures

Figure 1
Figure 1. The addition of an N-terminal triple-FLAG tag into the Trp53 locus does not perturb the TRP53 function.
(A) Schematic of the structure of the genetically modified Trp53 allele. The coding sequence for the triple-FLAG tag was inserted after the start codon of the Trp53 gene. (B) PCR analysis showing correct insertion of the coding sequences for the triple-FLAG tag into the genetically modified Trp53 allele. A band of 225 bp indicates the presence of a wt (unmodified) allele. A band of 291 bp indicates a FLAG-Trp53 allele. Each lane represents DNA taken from an individual mouse (#32, 38, 40, 44, 45) followed by DNA from a control wt mouse, control DNA from a FLAG-Trp53KI/+ mouse, and a water-only control. (C) Table with observed and expected genotype distribution from inter-crosses of heterozygous FLAG-Trp53KI/+ mice. (D) Table with observed and expected sex distribution from all matings that could give rise to FLAG-Trp53KI/+ or FLAG-Trp53KI/KI mice. Frequencies compared by Chi-square test p = 0.0262. (E) Kaplan–Meier survival curve showing overall survival of wt, FLAG-Trp53KI/+, and FLAG-Trp53KI/KI mice. Differences in animal survival were compared using the Log-rank (Mantle–Cox) test, *p values ≤0.05. Mice were censored if harvested when healthy for use in experiments. (F) Thymocytes from wt, FLAG-Trp53KI/+ and FLAG-Trp53KI/KI mice were treated for 48 h in vitro with DMSO (vehicle control), 10 µM nutlin-3a, 1 µg/mL etoposide, 1 µg/mL ionomycin or exposed to one dose of 1.25 Gy γ-radiation and then kept for 48 h in culture. Cell viability was measured at various time points by flow cytometry after staining with fluorochrome-conjugated annexin-V and DAPI. The percentages of live, i.e. annexin-V/DAPI double-negative cells, are plotted. p values were calculated using a two-way ANOVA using Dunnett’s correction for multiple tests. Data were presented as mean ± SD. n = 4 mice of each genotype. (G) Mouse dermal fibroblasts (MDFs) were derived from wt, FLAG-Trp53KI/+ and FLAG-Trp53KI/KI mice and treated for 72 h with DMSO (vehicle control), 10 µM nutlin-3a, 1 µg/mL etoposide or 250 nM taxol. Cellular senescence was measured as a percentage of fluorescein-di-β-d-galactopyranoside (FDG) positive cells by flow cytometry. p values were calculated using a two-way ANOVA using Dunnett’s correction for multiple tests. Data were presented as mean ± SD. n = 4 mice of each genotype. (H) RNA was extracted from thymocytes and MDFs from wt, FLAG-Trp53KI/+ and FLAG-Trp53KI/KI mice after they had been treated for 6 h with DMSO (vehicle control) or 10 µM nutlin-3a in vitro. qRT-PCR was performed to determine the mRNA levels of the TRP53 target genes Bax, Mdm2, Mlh1, Pmaip1/Noxa, Cdkn1a/p21, Bbc3/Puma, and the Trp53 mRNA levels. Data were normalised using the ΔΔCT method, using Hmbs as a housekeeping gene. The data were plotted as fold-change of drug-treated compared to DMSO-treated cells. Data were presented as mean ± SD. n = 4 mice of each genotype. p values were calculated using a two-way ANOVA using Dunnett’s correction for multiple tests. All statistical tests were non-significant (i.e. had a p value >0.05). Source data are available online for this figure.
Figure 2
Figure 2. Antibodies against FLAG can be used to detect TRP53 in cells from the FLAG-Trp53 mice.
(A) Thymocytes from wt, FLAG-Trp53KI/+ and FLAG-Trp53KI/KI mice were treated for 24 h with DMSO (vehicle control), 10 µM nutlin-3a or 5 Gy γ-radiation in the presence of the broad-spectrum caspase inhibitor QVD-oPH (to prevent degradation of protein due to apoptosis). Western blot analysis was performed on protein extracts, probing with antibodies against TRP53, FLAG and GAPDH (the latter used as a protein loading control). The asterisk indicates a non-specific band detected when probing for TRP53. Relative density for TRP53 and FLAG bands (normalised to GAPDH) are listed. (B) MDFs from wt, FLAG-Trp53KI/+ and FLAG-Trp53KI/KI mice were treated for 24 h with DMSO (vehicle control), 10 µM nutlin-3a, 1 µg/mL etoposide or 250 nM taxol in the presence of QVD-oPH. Western blot analysis was performed on protein extracts, probing with antibodies against TRP53, FLAG and HSP70 (the latter used as a protein loading control). Relative density for TRP53 and FLAG bands (normalised to HSP70) are listed. (C) Thymocytes from wt, FLAG-Trp53KI/+ and FLAG-Trp53KI/KI mice were treated with 10 µM nutlin-3a for 0, 6, 12 or 24 h in the presence of the broad-spectrum caspase inhibitor QVD-oPH. Western blot analysis was performed on protein extracts, probing with antibodies against TRP53, FLAG, HSP70 and β-ACTIN (the latter two used as protein loading controls). (D) Bar graph showing summary data of relative protein densities of TRP53, and TRP53-FLAG proteins quantitated from Western blots from three individual mice for each genotype normalised to β-ACTIN, and displayed as mean ± SD. (E) Heatmap from global analysis of CUT&RUN data showing the read coverage 2 kbp up- and downstream of enriched peaks found genome-wide in MDFs derived from wt, FLAG-Trp53KI/+ and FLAG-Trp53KI/KI mice, treated with either DMSO (vehicle) or 10 µM nutlin-3a for 6 h. Peaks were called with MACS2. (F) FLAG antibody CUT&RUN tracks for the known TRP53 target genes Mdm2, Pmaip1/Noxa, Bbc3/Puma and Cdkn1a/p21. MDFs from wt, FLAG-Trp53KI/+ and FLAG-Trp53KI/KI mice were treated in vitro for 6 h with either DMSO (vehicle control) or 10 µM nutlin-3a. Data shown are from MDFs from n = 3-4 mice of each genotype pooled in analysis, normalised to library size. Source data are available online for this figure.
Figure 3
Figure 3. Generation and characterisation of p21-IRES-GFP reporter mice.
(A) Schematic of the targeted Cdkn1a/p21 locus to generate the p21-IRES-GFP reporter mice (not to scale), depicting where the long-range PCR primers that determine correct integration bind. (B) Agarose gel of DNA products from a long-range PCR to detect integration of the targeting construct. The first three lanes contain DNA from an individual p21-IRES-GFPKI/+ mouse, followed by DNA from a wt mouse in lane 4. All mice had the correct integration. (C) Representative histograms of the cell cycle distribution of MDFs from p21-IRES-GFPKI/+ or wt mice that had been treated for 24 h with either DMSO (vehicle control; in red), 10 µM nutlin-3a or 1 µg/mL etoposide (overlaid in blue). Cell cycle distribution was determined by staining with Hoechst 33342 followed by flow cytometric analysis at 24 h of drug treatment. Data were representative of n = 6–18 mice for each genotype from 5 independent experiments. (D) Thymocytes were extracted from p21-IRES-GFPKI/+ or wt mice, treated for 48 h in vitro with either DMSO (vehicle control), 10 µM nutlin-3a, 1 µg/mL etoposide or 1 µg/mL ionomycin. Cell survival was determined by flow cytometric analysis after staining with fluorochrome-conjugated Annexin-V plus DAPI. The percentages of live thymocytes (annexin-V/DAPI double negative) are graphed. p-values were calculated using a two-way ANOVA using Sidak’s correction for multiple tests. No significant p values were found. Data were presented as mean ± SD. n = 3–6 mice per genotype. (E) qRT-PCR analysis of RNA extracted from MDFs from wt and p21-IRES-GFPKI/+ mice that had been treated for 24 h with either DMSO (vehicle control) or 10 µM nutlin-3a. Data were normalised using the ΔΔCT method, using Hmbs as a housekeeping gene. The data were plotted as a fold-change of drug-treated compared to the mean of the DMSO-treated cells. Data were presented as mean ± SD. n = 3 mice of each genotype. p values were calculated using a two-way ANOVA using Dunnett’s correction for multiple tests. **p values ≤0.01. (F) Western blot analysis of proteins extracted from MDFs from wt and p21-IRES-GFPKI/+ mice that had been treated for 24 h with either DMSO (vehicle control) or 10 µM nutlin-3a. Probing for β-ACTIN was used as a loading control. Created with BioRender.com. Source data are available online for this figure.
Figure 4
Figure 4. GFP expression increases in cells from p21-IRES-GFP reporter mice after treatment with cytotoxic agents that act in either a TRP53-dependent or a TRP53-independent manner.
(A) Flow cytometry histograms showing the levels of GFP in untreated MDFs from a p21-IRES-GFPKI/+ and a p21-IRES-GFPKI/KI reporter mouse and, as a control, a wt mouse. (B) Flow cytometry histograms showing the levels of GFP in MDFs from a p21-IRES-GFPKI/+ mouse and a Trp53−/−;p21-IRES-GFPKI/+ mouse that had been treated for 24 h with DMSO (vehicle control), 10 µM nutlin-3a, 1 µg/mL etoposide, 250 nM taxol, 5 µM abemaciclib, 1 µM thapsigargin or 1 µM dexamethasone. Representative histograms from n = 3–7 independent cell cultures per genotype are shown. (C) Flow cytometry histograms showing the levels of GFP in resting (top row) or mitogen-activated (bottom row) T cells from a p21-IRES-GFPKI/+ and a p21-IRES-GFPKI/KI reporter mouse and, as a control, a wt mouse. T cells were isolated from lymphoid organs with no stimulation or stimulated with antibodies against CD3 and CD28 for 48 h before being treated with DMSO (vehicle control), 0.5 µM dexamethasone, 10 µM nutlin-3a, 1 µg/mL etoposide or 1 µg/mL ionomycin for 24 h. Representative histograms from n = 4 independent cell cultures per genotype are shown. (D) Flow cytometry histograms comparing the levels of GFP in mitogen-activated T cells from a p21-IRES-GFPKI/+ mouse and a Trp53−/−;p21-IRES-GFPKI/+ mouse after treatment with DMSO (vehicle control), 10 µM nutlin-3a, 1 µg/mL etoposide, 1 µg/mL ionomycin, 5 µM abemaciclib, 50 nM thapsigargin or 1 µM dexamethasone for 24 h. Representative histograms from n = 4 independent cell cultures per genotype are shown. (E) Summary plots of GFP expression in murine dermal fibroblasts displayed as fold-change relative to level at 0 h. Cells were treated with DMSO (vehicle control), 10 µM nutlin-3a, 1 µg/mL etoposide, 250 nM taxol or 5 µM abemaciclib for 24 h before drug-containing medium was removed and replaced with non-drug-containing medium. p values were calculated using a linear model using Sidak’s correction for multiple tests. Data displayed as mean ± SD from n = 3 cultures derived from independent mice of each genotype. p value * ≤0.05, ** ≤0.01 and **** ≤0.0001. Source data are available online for this figure.
Figure 5
Figure 5. GFP expression can be detected by intra-vital microscopy in p21-IRES-GFP reporter mice after γ-irradiation.
(A) Representative multiphoton microscopy images of the calvarium of a p21-IRES-GFPKI/+ mouse and a Trp53−/−;p21-IRES-GFPKI/+ mouse 24 h after administration of a single dose of 5 Gy γ-irradiation to activate TRP53. Data shown are representative of n = 3 mice for each genotype from three independent experiments. Scale bars are 500 μm for the whole calvarium image and 50 μm in P1 and P2. (B) Quantification of the GFP pixel count from images described in A (including wt mice as controls). Data were quantified from an n = 3–4 mice for each genotype and treatment and displayed as mean ± SD. (CZ) Representative multiphoton microscopy images of the lymph node, kidney and heart from a wt and a p21-IRES-GFPKI/+ mouse 18 h after administration of a single dose of 5 Gy whole-body γ-irradiation. Tissues from non-irradiated mice were used as a control. Scale bars for C, E, G, I, K, M, O, Q, S, U, W and Y = 200 μm. Scale bars for D, F, H, J, L, N, P, R, T, V, X and Z = 50 μm. Images from a p21-IRES-GFPKI/ mouse are also displayed in Appendix Fig. S3.
Figure 6
Figure 6. Generation and characterisation of Puma-tdTomato reporter mice.
(A) Schematic of the targeted Bbc3/Puma locus to generate the Puma-tdTomato reporter mice (not to scale), depicting where the long-range PCR primers that determine correct integration bind. (B) Agarose gel of DNA products from a long-range PCR to detect integration of the targeting construct. The first three lanes contain DNA from an individual Puma-tdTomatoKI/+ mouse, followed by DNA from a wt mouse in lane 4. All mice had the correct integration. (C) Thymocytes were extracted from wt, Puma+/−, Puma-tdTomatoKI/+, Puma−/− and Puma-tdTomatoKI/KI mice, treated for 48 h in vitro with either DMSO (vehicle control), 10 µM nutlin-3a, 1 µg/mL etoposide or 1 µg/mL ionomycin. The percentages of live thymocytes (annexin-V/DAPI double negative) as determined by flow cytometric analysis are graphed. p values were calculated using a two-way ANOVA using Sidak’s correction for multiple tests. n = 3–6 mice per genotype. Data were presented as mean ± SD. * describe comparisons between wt and Puma+/− mice, or between Puma-tdTomatoKI/KI and Puma−/− mice. # symbols describe comparisons between Puma+/− and Puma-tdTomatoKI/+ mice. p values = * or # ≤0.05, ** ≤0.01, ### ≤0.001, #### ≤0.0001. n = 3–5, mean ± SD. (D) Representative histograms for cell cycle distribution of MDFs from Puma-tdTomatoKI/+ mice that had been treated for 24 h with DMSO (vehicle control; in black), overlaid with plots from cells treated for 24 h with 10 µM nutlin-3a or 1 µg/mL etoposide (in orange). Cell cycle distribution was determined by staining with Hoechst 33342 followed by flow cytometric analysis. Data were representative of n = 3 independent mice per genotype from three independent experiments. (E) qRT-PCR analysis of RNA extracted from thymocytes from Puma+/− and Puma-tdTomatoKI/+ mice that had been treated for 6 h with either DMSO (vehicle control) or 10 µM nutlin-3a in the presence of the broad-spectrum caspase inhibitor QVD-oPH. Data were normalised using the ΔΔCT method, using Hmbs as a housekeeping gene. Data were plotted as fold-change of drug-treated compared to the mean of the DMSO-treated cells. Data were presented as mean ± SD. n = 3 mice of each genotype. p values were calculated using a two-way ANOVA using Dunnett’s correction for multiple tests. p values *** ≤0.001. (F) Western blot analysis of proteins extracted from thymocytes from Puma+/− and Puma-tdTomatoKI/+ mice that had been treated for 6 h with either DMSO (vehicle control) or 10 µM nutlin-3a in the presence of the broad-spectrum caspase inhibitor QVD-oPH. Probing for HSP70 was used as a loading control. Created with BioRender.com. Source data are available online for this figure.
Figure 7
Figure 7. tdTomato expression increases in cells from Puma-tdTomato reporter mice after treatment with cytotoxic agents that kill in either a TRP53-dependent or a TRP53-independent manner.
(A) Flow cytometry histograms showing the levels of tdTomato in untreated Puma-tdTomatoKI/+ MDFs compared to untreated MDFs from a Puma+/− mouse. Data shown were representative of n = 3–5 for each genotype. (B) Flow cytometry histograms showing the levels of tdTomato in MDFs from a Puma-tdTomatoKI/+ mouse and MDFs from a Trp53−/−; Puma-tdTomatoKI/+ mouse that had been treated for 24 h with DMSO (vehicle control), 10 µM nutlin-3a, 1 µg/mL etoposide, 250 nM taxol, 5 µM abemaciclib or 10 µM palbociclib. Representative histograms from n = 5 independent cell cultures for cells of each genotype are shown. (C) Flow cytometry histograms showing the levels of tdTomato in untreated Puma-tdTomatoKI/+ thymocytes compared to untreated thymocytes from a Puma+/− mouse. Data shown were representative of n = 3–5 mice for each genotype. (D) Flow cytometry histograms showing the levels of tdTomato in thymocytes from a Puma-tdTomatoKI/+ mouse and a Trp53−/−; Puma-tdTomatoKI/+ mouse that had been treated for 24 h with DMSO (vehicle control), 10 µM nutlin-3a, 1 µg/mL etoposide, 1 µg/mL ionomycin, 1 µM dexamethasone or 10 ng/mL PMA in the presence of the broad-spectrum caspase inhibitor QVD-oPH. Representative histograms from n = 3 independent cell cultures for each genotype and treatment are shown. (E) Summary plots of tdTomato expression in murine dermal fibroblasts displayed as fold-change relative to the level at 0 h. Cells were treated with DMSO (vehicle control), 10 µM nutlin-3a, 1 µg/mL etoposide, 250 nM taxol or 5 µM abemaciclib for 24 h before drug-containing medium was removed and replaced with non-drug-containing medium. p values were calculated using a linear model using Sidak’s correction for multiple tests. Data displayed as mean ± SD from n = 3 cultures derived from independent mice of each genotype. p value ** ≤0.01, **** ≤0.0001. Source data are available online for this figure.
Figure 8
Figure 8. tdTomato expression can be detected by intra-vital microscopy in Puma-tdTomato reporter mice after γ-irradiation.
(A) Representative multiphoton microscopy images of the calvarium of a Puma-tdTomatoKI/+ mouse and a Trp53−/−;Puma-tdTomatoKI/+ mouse 24 h after administration of a single dose of 5 Gy γ-irradiation to activate TRP53. Data shown were representative of n = 3 independent experiments per mouse genotype and treatment. Scale bars are 500 μm for the whole calvarium image and 50 μm in P1 and P2. (B) Quantification of the tdTomato pixel counts from images described in A (including wt mice as controls). Data quantified from an n = 3–5 mice for each genotype and treatment and displayed as mean ± SD. (C) Representative multiphoton microscopy images of lymph nodes, kidney and heart from a wt and a Puma-tdTomatoKI/+ mouse 18 h after administration of a single dose of 5 Gy whole-body γ-irradiation. Tissues from non-irradiated mice were used a control. Scale bars for C, E, G, I, K, M, O, Q, S, U, W and Y = 200 μm. Scale bars for D, F, H, J, L, N, P, R, T, V, X and Z = 50 μm. Images from a Puma-tdTomatoKI/+ mouse are also displayed in Appendix Fig. S3.
Figure EV1
Figure EV1. Extra data related to FLAG-Trp53 mice.
(A) Next-generation sequencing results for the inserted sequences encoding the triple-FLAG tag in the F1 generation of FLAG-Trp53KI/+ mice. Each line represents the reads from 1 independent F1 mouse. A black dot indicates a matching base in the sequencing reads compared to the reference sequence. (B) Representative histology from aged wt, FLAG-Trp53KI/+ and FLAG-Trp53KI/KI mice at the time of harvest. No tumour samples showed TRP53 staining by immunohistochemistry, indicating that they did not have mutant TRP53 driving their malignancy. Scale bar = 100 um. (C) RNA was extracted from thymocytes and MDFs from wt, FLAG-Trp53KI/+ and FLAG-Trp53KI/KI mice that had been treated for 6 h with DMSO (vehicle control) or 1.25 Gy γ-radiation in vitro. qRT-PCR analysis was performed to determine the mRNA levels of the TRP53 target genes Bax, Mdm2, Mlh1, Pmaip1/Noxa, Cdkn1a/p21, Bbc3/Puma and the Trp53 mRNA levels. Data were normalised using the ΔΔCT method, using Hmbs as a housekeeping gene. The data were plotted as fold-change compared to DMSO-treated samples. Data were presented as mean ± SD. n = 4 mice of each genotype and treatment. p values were calculated using a two-way ANOVA using Dunnett’s correction for multiple tests. All statistical tests showed that differences were not significant (had a p value >0.05).
Figure EV2
Figure EV2. Extra data related to p21-IRES-GFP mice.
(A) MDFs from wt, p21-IRES-GFPKI/+, p21-IRES-GFPKI/KI and Trp53−/−;p21-IRES-GFPKI/+ mice were treated in vitro with either DMSO (vehicle control), 10 µM nutlin-3a, 1 µg/mL etoposide, 250 nM taxol, 0.5 µM dexamethasone, 5 µM abemaciclib or 1.5 µM thapsigargin. Cell cycle distribution was determined by staining with Hoechst 33342 followed by flow cytometric analysis at 0, 24, 48 and 72 h of drug treatment. The p values were calculated using a two-way ANOVA using Sidak’s correction for multiple tests and displayed in Appendix Table S2. Data were presented as mean ± SD. n = 3–15 mice per genotype and treatment. (B) Western blot analysis for TRP53 and p21 protein levels in MDFs from wt or Trp53−/− mice 24 h after treatment with either DMSO (vehicle control) or 250 nM taxol. Probing for HSP70 was used as a loading control. Created with BioRender.com. (C) qRT-PCR analysis examining the levels of p21 mRNA in MDFs from wt and Trp53−/− mice treated with either DMSO (vehicle control), 10 µM nutlin-3a, 1 µg/mL etoposide or 1 µg/mL ionomycin. Data were normalised using the ΔΔCT method, using Hmbs as a housekeeping gene. The data were plotted as fold-change compared to the average of the wt DMSO-treated samples. Data were presented as mean ± SD. n = 3 mice of each genotype and treatment. The p values were calculated using a one-way ANOVA using Tukey’s correction for multiple tests. P value* ≤0.05. (D) Representative flow cytometry histograms showing GFP expression in MDFs generated from p21-IRES-GFPKI/KI reporter mice after 24 h of treatment with DMSO (vehicle control), 10 µM nutlin-3a, 1 µg/mL etoposide, 250 nM taxol, 1 µM dexamethasone or 5 µM abemaciclib. The data shown were representative of MDFs from n = 6 mice for each genotype and treatment. (E) Summary plots of GFP expression in MDFs from Figs. 4B and EV2D, displayed as log-transformed raw MFI values. Samples from MDFs of the same independent mouse are connected with a line. p values were calculated using a linear model using Sidak’s correction for multiple tests. n = 3–14 for each genotype of mice and treatment. P value ** ≤0.01, *** ≤0.001, **** ≤0.0001. (F) Summary plots of GFP expression in MDFs from Figs. 4B and EV2D, displayed as fold-change relative to treatment with DMSO (control) at 0 h. Data displayed as mean ± SD from n = 3–14 cultures for each genotype of mice and treatment.
Figure EV3
Figure EV3. Thymocytes from p21-IRES-GFP mice do not express GFP but mitogen-activated T cells do express the p21-IRES-GFP reporter.
(A) Flow cytometry histograms showing the levels of GFP in thymocytes from a p21-IRES-GFPKI/+, a p21-IRES-GFPKI/KI and a wt control mouse, that had been treated in vitro for 24 h with DMSO (vehicle control), 10 µM nutlin-3a, 1 µg/mL etoposide or 1 µg/mL ionomycin in the presence of the broad-spectrum caspase inhibitor QVD-oPH to prevent cell demolition due to apoptosis. Representative histograms from n = 3–7 independent thymocyte cultures per genotype and treatment are shown. (B) Thymocytes from p21-IRES-GFPKI/+ and Trp53/;p21-IRES-GFPKI/+ mice were treated for 48 h in vitro with either DMSO (vehicle control), 10 µM nutlin-3a, 1 µg/mL etoposide, 1 µg/mL ionomycin, 0.5 µM abemaciclib, 1 µM dexamethasone or 50 nM thapsigargin. The percentages of live thymocytes (annexin-V/DAPI double negative) were determined by flow cytometric analysis. p values were calculated using a two-way ANOVA using Sidak’s correction for multiple tests. p value* ≤0.05, *** ≤0.001. Data were presented as mean ± SD. n = 3–6 mice for each genotype and treatment. (C) Summary plots of GFP expression in mitogen-activated T cells from Fig. 4C, displayed as fold-change relative to treatment with DMSO (control) at 0 h. Data displayed as mean ± SD from n = 3–4 cultures for each genotype of mice and treatment. (D) Summary plots of GFP expression in mitogen-activated T cells from Fig. 4C, displayed as log-transformed raw MFI values. Samples from the same mouse are connected with a line. p values were calculated using a linear model using Sidak’s correction for multiple tests. p value* ≤0.05, ****≤ 0.0001. n = 3–4 cultures for each genotype of mice and treatment. (E) Summary data of GFP expression in mitogen-activated T cells from p21-IRES-GFPKI/+ and p21-IRES-GFPKI/KI mice after treatment with the indicated drugs for the indicated time showing raw mean fluorescence intensity (MFI) values compared to fold-change normalised to untreated cells at 0 h. Data displayed as mean ± SD from n = 3 mice for each genotype and treatment. (F) Summary data of GFP expression in mitogen-activated T cells from p21-IRES-GFPKI/+ and Trp53−/−;p21-IRES-GFPKI/+ mice treated in vitro for 6 or 24 h with DMSO (vehicle control), 10 µM nutlin-3a, 1 µg/mL etoposide, 0.5 µM abemaciclib, 1 µM dexamethasone, 250 nM taxol or 1 µg/mL ionomycin displayed as fold-change normalised to untreated cells at 0 h. Data displayed as mean ± SD from n = 3 for each genotype of mice and treatment. (G) Summary plots of GFP expression in MDFs from Fig. 4E, displayed as log-transformed raw MFI values. Black symbol indicates mean, grey symbols are individual cultures. p values were calculated using a linear model using Sidak’s correction for multiple tests. p value* ≤0.05, **≤0.01, ****≤0.0001. n = 3 cultures for each genotype of mice and treatment.
Figure EV4
Figure EV4. Extra data related to Puma-tdTomato mice.
(A) Thymocytes were extracted from Puma-tdTomatoKI/+ mice and Trp53−/−;Puma-tdTomatoKI/+ mice, and treated for 48 h in vitro with either DMSO (vehicle control), 10 µM nutlin-3a, 1 µg/mL etoposide, 1 µg/mL ionomycin, 1 µM dexamethasone or 10 ng/mL PMA. The percentages of live thymocytes (annexin-V/DAPI double negative) were determined by flow cytometric analysis. p values were calculated using a two-way ANOVA using Sidak’s correction for multiple tests. p value* ≤0.05, *** ≤0.001, **** ≤0.0001. Data were presented as mean ± SD. n = 3–7 for mice of each genotype and treatment. (B) MDFs from Puma-tdTomatoKI/+ and Trp53−/−;Puma-tdTomatoKI/+ mice were treated for 72 h with either DMSO (vehicle control), 10 µM nutlin-3a, 1 µg/mL etoposide, 250 nM taxol, 10 µM palbociclib or 5 µM abemaciclib. Cell cycle distribution was determined by flow cytometric analysis after staining with Hoechst 33342 at the start of treatment (0 h), and at 24, 48 and 72 h of drug treatment. p values were calculated using a two-way ANOVA using Sidak’s correction for multiple tests and displayed in Appendix Table S3. Data were presented as mean ± SD. n = 3 mice for each genotype and treatment. (C) Representative flow cytometry histograms of cell cycle distribution of MDFs from Trp53−/−;Puma-tdTomatoKI/+ mice following in vitro treatment for 24 h with DMSO (vehicle control; in red), 10 µM nutlin-3a or 1 µg/mL etoposide (overlaid in blue). Cell cycle distribution was determined by flow cytometric analysis after staining with Hoechst 33342. The data shown were representative of n = 3 for mice of each genotype and treatment. (D) qRT-PCR analysis examining the levels of Puma mRNA in MDFs from Puma-tdTomatoKI/+ and Puma+/− mice treated with either DMSO (vehicle control) or 10 µM nutlin-3a for 24 h. Data were normalised using the ΔΔCT method, using Hmbs as a housekeeping gene. Data were plotted as fold-change compared to the average of the wt DMSO-treated samples. Data were presented as mean ± SD. n = 3 mice of each genotype and treatment. The p values were calculated using a one-way ANOVA using Tukey’s correction for multiple tests. p value** ≤0.01, **** ≤0.0001. (E) Western blot analysis for TRP53 and PUMA protein levels in MDFs from Puma-tdTomatoKI/+ and Puma+/ mice 24 h after treatment with either DMSO (vehicle control) or 10 µM nutlin-3a. Probing for HSP70 and β-ACTIN were used as loading controls. Created with BioRender.com.
Figure EV5
Figure EV5. Extra data related to tdTomato expression in Puma-tdTomato mice.
(A) Summary plots of tdTomato expression in MDFs from Fig. 7B, displayed as fold-change relative to treatment with DMSO (control) at 0 h. Data displayed as mean ± SD from n = 3 cultures for each genotype of mice and treatment. (B) Summary plots of tdTomato expression in MDFs from Fig. 7B, displayed as log-transformed raw MFI values. Samples from the same mouse are connected with a line. p values were calculated using a linear model using Sidak’s correction for multiple tests. p value** ≤0.01, *** ≤0.001, **** ≤0.0001. n = 3 cultures for each genotype of mice and treatment. (C) Summary plots of tdTomato expression in thymocytes from Fig. 7D, displayed as fold-change relative to DMSO (control) treated samples at 0 h. Data displayed as mean ± SD from n = 5–10 cultures for each genotype of mice and treatment. (D) Summary plots of tdTomato expression in thymocytes from Fig. 7D, displayed as log-transformed raw MFI values. Samples from the same mouse are connected with a line. p values were calculated using a linear model using Sidak’s correction for multiple tests. p value* ≤0.05, **** ≤0.0001. n = 5–10 cultures for each genotype of mice and treatment. (E) Summary plots of tdTomato expression in MDFs from Fig. 7E, displayed as log-transformed Raw MFI values. The black symbol indicates the mean. p values were calculated using a linear model using Sidak’s correction for multiple tests. p value**≤0.01, **** ≤0.0001. n = 3 cultures for each genotype of mice and treatment.

References

    1. Amemiya HM, Kundaje A, Boyle AP (2019) The ENCODE blacklist: identification of problematic regions of the genome. Sci Rep 9:9354 - PMC - PubMed
    1. Boutelle AM, Attardi LD (2021) p53 and tumor suppression: it takes a network. Trends Cell Biol 31:298–310 - PMC - PubMed
    1. Brady CA, Jiang D, Mello SS, Johnson TM, Jarvis LA, Kozak MM, Kenzelmann Broz D, Basak S, Park EJ, McLaughlin ME et al (2011) Distinct p53 transcriptional programs dictate acute DNA-damage responses and tumor suppression. Cell 145:571–583 - PMC - PubMed
    1. Clarke AR, Purdie CA, Harrison DJ, Morris RG, Bird CC, Hooper ML, Wyllie AH (1993) Thymocyte apoptosis induced by p53-dependent and independent pathways. Nature 362:849–852 - PubMed
    1. de Sousa Abreu R, Penalva LO, Marcotte EM, Vogel C (2009) Global signatures of protein and mRNA expression levels. Mol Biosyst 5:1512–1526 - PMC - PubMed

MeSH terms

Substances

LinkOut - more resources