. 2024 Oct;43(19):4173-4196.
doi: 10.1038/s44318-024-00202-5. Epub 2024 Aug 19.

An extrinsic motor directs chromatin loop formation by cohesin

Affiliations

An extrinsic motor directs chromatin loop formation by cohesin

Thomas M Guérin et al. EMBO J. 2024 Oct.

Erratum in

Abstract

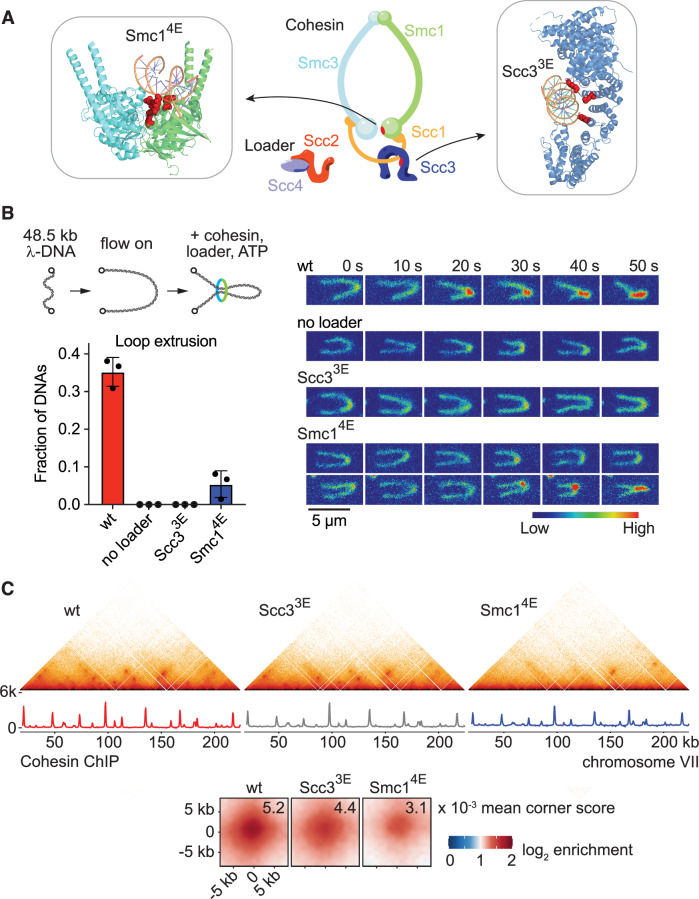
The ring-shaped cohesin complex topologically entraps two DNA molecules to establish sister chromatid cohesion. Cohesin also shapes the interphase chromatin landscape with wide-ranging implications for gene regulation, and cohesin is thought to achieve this by actively extruding DNA loops without topologically entrapping DNA. The 'loop extrusion' hypothesis finds motivation from in vitro observations-whether this process underlies in vivo chromatin loop formation remains untested. Here, using the budding yeast S. cerevisiae, we generate cohesin variants that have lost their ability to extrude DNA loops but retain their ability to topologically entrap DNA. Analysis of these variants suggests that in vivo chromatin loops form independently of loop extrusion. Instead, we find that transcription promotes loop formation, and acts as an extrinsic motor that expands these loops and defines their ultimate positions. Our results necessitate a re-evaluation of the loop extrusion hypothesis. We propose that cohesin, akin to sister chromatid cohesion establishment at replication forks, forms chromatin loops by DNA-DNA capture at places of transcription, thus unifying cohesin's two roles in chromosome segregation and interphase genome organisation.

Keywords: Cohesin; Loop Capture; Loop Extrusion; SMC Complexes; Transcription.


Figures

Figure 1
Figure 1. Chromatin loop formation by loop extrusion-deficient cohesin.
(A) Overview schematic of cohesin and its loader, and structures of the Scc3 (PDB: 6H8Q; Li et al, 2018) and Smc1 (PDB: 6ZZ6; Collier et al, 2020) subunits bound to DNA, highlighting the amino acids that were mutated to glutamates to generate Scc33E (K423E, K520E, K669E) and Smc14E (R53E, R58E, N60E, K63E). (B) Schematic representation of an in vitro loop extrusion assay. Loop extrusion efficiencies of wild-type (wt) cohesin in the presence and absence of loader, as well as of Scc33E- and Smc14E-cohesin, were measured in three independent repeat experiments. Individual data points are presented, bars indicate the mean and error bars the standard deviation (nwt = 201, nno loader = 224, nScc33E = 301, nSmc14E = 260). Example time-lapse recordings of loop extrusion. The DNA is stained with SYTOX Orange and shown using an arbitrary linear intensity scale. Scale bar, 5 μM. (C) 500 bp-resolution merged micro-C contact maps, as well as corresponding calibrated cohesin ChIP-seq traces, from two independent experiments of G2/M arrested cells harbouring wt or loop extrusion-deficient cohesin. Cohesin ChIP used Smc3-Pk3 in the wt and Scc33E strains, or Smc14E-Pk3 with a wt Smc1-Pk3 strain included for normalisation. Aggregate chromatin structure is shown in wt, Scc33E and Smc14E strains at loops detected by chromosight (Matthey-Doret et al, 2020) and linked to cohesin anchors in the wt strain (n = 1060). Mean corner scores are indicated. Source data are available online for this figure.
Figure 2
Figure 2. Transcription directs loop expansion, without the cohesin loader.
(A) 500 bp-resolution merged micro-C contact maps from two independent experiments of wt and rat1-1 cells arrested in G2/M at a restrictive temperature (37 °C) for the rat1-1 allele. Cohesin (Scc1-Pk9) ChIP microarray traces under the same conditions (Ocampo-Hafalla et al, 2016) are shown. (B) Scheme for how genomic regions were selected for analysis, aggregate loop profiles with mean corner scores, and rat1-1 dependent change of chromosight loop scores at each position (n = 104). (C) The experiment in (A) was repeated, but rat1-1 cells were arrested in G2/M at a permissive temperature (25 °C, left), before temperature shift to 37 °C (right). (D) The experiment in (C) was repeated with a rat1-1 strain from which the Scc2 cohesin loader subunit could be depleted. Scc2 was either depleted in G1 before release and arrest in G2/M (left), or following arrest in G2/M. Following G2/M depletion, samples were analysed before 25 °C (middle) and after rat1-1 inactivation by temperature shift to 35 °C (right).
Figure 3
Figure 3. Transcription promotes cohesin loop formation.
(A) RNA Polymerase II depletion by anchor away. 500 bp-resolution merged micro-C contact maps from two independent experiments of cells arrested in late G1 or G2/M in the absence or presence of rapamycin to deplete RNA polymerase II. Calibrated cohesin (Smc3-Pk3) ChIP-seq traces from the same samples are shown. A merged micro-C contact map of two independent repeats of cohesin-depleted (scc1-aid) G2/M cells is shown for comparison. Aggregate chromatin structure of loops detected by chromosight and linked to cohesin anchors in the rapamycin samples (n = 788 G1; n = 1060 G2/M) are shown, together with mean corner scores relative to those recorded in the scc1-aid sample. (B) Overall cohesin ChIP occupancy in the two repeat experiments, relative to a C. glabrata spike-in. (C) Cumulative interaction counts as a function of genomic distance in the above micro-C experiments. Source data are available online for this figure.
Figure 4
Figure 4. Unwound DNA as possible cohesin target for loop capture.
(A) 500 bp-resolution contact maps of G2/M arrested wild-type (wt) and sub1Δ cells, and comparison of aggregated loops, identified in the wild-type map and linked to cohesin anchors. Mean chromosight loop scores are used to quantify loop intensity, as corner scores did not reliably assess loops with altered shapes, such as those observed below in (C). (B) as (A) but an aggregate map of two independent repeats comparing wild-type and chl1Δ cells, arrested in late G1 using Sic1 overexpression, is shown. (C) As (A), but aggregate maps are shown from three independent repeat experiments of top1Δ top2-4 and top1Δ top2-4 +TopA cells following shift to a restrictive temperature for the top2-4 allele. TopA was detected with an α-TopA antibody (Zhou et al, 2017), GAPDH, detected by α-GAPDH antibody (Abcam, clone GA1R, ab125247) served as the loading control. See Appendix Fig. S1 for experimental design and cell synchronisation details of these experiments. Source data are available online for this figure.
Figure 5
Figure 5. TAD formation without cohesin.
(A) In all, 500 bp-resolution merged micro-C contact maps from two independent experiments surrounding the GAL7-GAL10-GAL1 locus, indicated by a black bracket below the maps, of cells grown in medium with glucose, or with raffinose + galactose (Galactose) as the carbon source. The control cells grown in glucose were also previously analysed as part of Fig. 1C. (B) As (A) but cells were grown in medium containing raffinose as the carbon source. The cohesin subunit Scc1 was depleted by an auxin-inducible degron. Samples were then analysed after further incubation in raffinose medium, or following galactose addition. (C) Interaction directionality plot across the GAL7-GAL10-GAL1 locus to characterise insulation at the generated domain boundaries. (D) Aggregate loops (including mean corner scores) and TAD boundaries identified genome-wide in the SCC1 glucose sample and recorded under the indicated conditions.
Figure 6
Figure 6. A unified model for sister chromatid cohesion establishment and chromatin loop formation by the cohesin complex.
Cohesin sequentially and topologically entraps two DNAs (Murayama et al, ; Richeldi et al, 2024). While the prime purpose of this reaction is the establishment of sister chromatid cohesion at DNA replication forks, second DNA capture by the same mechanism occurs at sites of ongoing transcription, resulting in transcription-dependent interphase chromatin domain architecture.
Figure EV1
Figure EV1. Characterisation of Scc33E and Smc14E loop extrusion defective cohesin complexes.
(A) Purified wild type (wt), Scc33E-, and Smc14E-cohesin and cohesin loader were analysed by SDS-PAGE followed by Coomassie Blue staining. (B) Loop extrusion rates, measured as described (Higashi et al, 2021), of wt and Smc14E-cohesin, in the presence of loader and ATP (nwt = 37, nSmc14E = 16). Dashed and dotted lines represent the median and quartile ranges, respectively. Processive extrusion by Smc14E-cohesin suggests that this variant is defective in loop initiation but less so loop extension. Indeed, Smc14E-cohesin shows a greater median extrusion rate, which might arise if the small number of loop extrusion events by this variant are biased towards DNAs under low tension on which extrusion proceeds relatively faster. (C) DNA affinity of wt, Scc33E- and Smc14E-cohesin as measured by an electrophoretic mobility shift assay. Increasing cohesin concentrations were between 32 and 525 nM in 2-fold steps. (D) Assay to measure topological (high-salt-resistant) loading of wt, Scc33E- and Smc14E-cohesin onto DNA (Minamino et al, 2018), in the presence of the indicated components. An example agarose gel of the recovered DNA is shown, as well as quantification of the individual results from two independent repeat experiments. Bars show the means. (E) Loop extrusion assay as in Fig. 1C, but the flow cell was incubated with wt, Scc33E- or Smc14E-cohesin, loader and ATP in the absence of flow, before flow was applied to visualise loops. The fractions of DNA with loops were counted in three independent repeat experiments. Individual data points are shown, bars represent the mean and error bars the standard deviation (nwt = 224, nScc33E = 269, nSmc14E = 633). (F) As Fig. 1C in the presence of flow, but a buffer containing 100 mM NaCl was used. See the Methods for complete buffer descriptions. Bars represent the mean and error bars the standard deviation (nwt = 452, nScc33E = 295, nSmc14E = 242).
Figure EV2
Figure EV2. Life without loop extrusion.
(A) 10-fold serial dilutions of cultures of the indicated genotypes were plated onto YPD agar plates containing the indicated compounds and grown at 30 °C for 2 days. A wt and a DNA repair deficient (rad52Δ) strain were included as controls. (B) Sister chromatid cohesion in G2/M arrested cells was monitored at the GFP-marked URA3 locus (Michaelis et al, 1997). A representative image of two G2/M arrested cells with intact (left) or defective (right) sister chromatid cohesion is shown. The percentage of cells (n = 100) with two separated GFP dots were recorded in three independent repeat experiments. The means are represented by horizontal bars. A wild type (wt) and a cohesion establishment defective (chl1Δ; Samora et al, 2016) strain served as controls. (C) Overall cohesin ChIP enrichment ratios of wt, compared to Scc33E- and Smc14E-cohesin, relative to a C. glabrata spike-in. Cohesin ChIP used Smc3-Pk3 in the Scc33E strain, or Smc14E-Pk3, normalised against Smc3-Pk3 and Smc1-Pk3 wt control strains. (D) Corner score distributions of loops identified in the wild-type micro-C contact map and linked to cohesin anchors, sampled in the Scc33E- and Smc14E-maps (n = 1060). Box plots represent the median (centre), quartiles (box) and range (whiskers). (E) Tetrad dissection following sporulation of homozygous diploid wild type, SCC33E and SMC14E strains. Spore viability was calculated based on n = 118/128, 104/100 and 82/120 germinating and colony forming spores, respectively.
Figure EV3
Figure EV3. Scc3 is required for chromatin loop formation.
(A) FACS analysis of DNA content, as well as experimental outline, of the experiment to deplete Scc3 by promoter shut-off and an auxin-inducible degron (pMET-scc3-aid cells). As a control, we used cells in which scc3-aid is expressed under control of its endogenous, methionine-insensitive promoter and to which we added methionine but not auxin during G1 arrest, before release into nocodazole-containing medium for arrest in G2/M. Scc3 depletion was confirmed by Western blotting. Serial dilutions of the control sample without auxin addition were loaded, as well as the depleted sample. Scc3 was detected using an α-aid-tag antibody (Cosmo Bio, CAC-APC004AM). GAPDH, detected by an α-GAPDH antibody (abcam, clone GA1R, ab125247) served as a loading control. (B) 500 bp-resolution merged micro-C contact maps from two independent experiments with Scc3-depleted pMET-scc3-aid and control scc3-aid cells. Aggregate chromatin loop profiles, detected by chromosight and linked to cohesin anchors in a wild-type strain without any cohesin alteration (Fig. 1C), were recorded in both present maps.
Figure EV4
Figure EV4. Transcription expands cohesin-mediated chromatin loops.
(A) Characterisation of cohesin peaks that are displaced following rat1-1 inactivation. Aggregated Rpb1 ChIP profiles (Baejen et al, 2017) are shown over scaled cohesin peak regions, and their surroundings, that remained either unchanged or that were lost following rat1-1 inactivation. Before Rat1 depletion (anchor away was used by Baejen et al, 2017), cohesin peaks that will be displaced show strict Rpb1 avoidance. In contrast, cohesin peaks that will remain unchanged were already partly Rpb1 occupied. Following Rat1 depletion, Rpb1 broadly overlapped with both type of regions. We confirmed that differing cohesin peak widths did not cause these differences. To conduct these analyses, raw sequences from (Baejen et al, 2017) were aligned to the S288C genome for analysis using the standard nf core chipseq procedure. Bam files were then converted to BigWigs using bamCoverage with normalizeUsing RPKM and ignoreDuplicates parameters. Binsize was selected at 20 bp and data were smoothed over 3 bins. For comparison we overlaid our previous cohesin (Scc1) ChIP microarray analysis (Ocampo-Hafalla et al, 2016) and selected peaks exclusive to control cells. Peaks longer than 4000 bp or shorter than 500 bp were excluded from the analysis. (B) FACS analysis of DNA content of the cells in the experiment shown in Fig. 2C, together with an experimental outline. Aggregate chromatin profiles of loops (n = 91), identified as in Fig. 2B, and a graph depicting the rat1-1 dependent loop score changes. (C) FACS analyses of DNA content of the cells in the experiment shown in Fig. 2D, together with experimental outlines. Western blot analysis confirmed Scc2 depletion by an auxin-inducible degron. Samples at the indicated times in the experiment are shown. Scc2 was detected using the aid-tag antibody. Tubulin served as a loading control. Aggregate loop profiles (n = 52) and a graph depicting the rat1-1 dependent loop score changes are shown.
Figure EV5
Figure EV5. Transcription inhibition and its effect on cohesin-mediated chromatin loops.
(A) 10-fold serial dilutions of cultures of the indicated genotypes were plated onto YPD agar plates, with or without 2 μg/ml added rapamycin, and grown at 30 °C for 2 days. A strain in which both Rpb1 and Rpb3 subunits of RNA polymerase II were fused to FRB showed a tighter response to rapamycin, as compared to strains with either one of the fusions. (B) An example of Rpb1-GFP-FRB relocation from the nucleus to the cytoplasm after one hour 2 μg/ml rapamycin treatment. Cells show the typical elongated bud shape of Sic1-induced late G1 arrest (Lopez-Serra et al, 2013). (C) FACS analysis of DNA content of the cells in the experiment shown in Fig. 3, as well as an experimental outline. Western blot analysis confirmed Scc1-aid depletion by its auxin-inducible degron, at 30 min and 120 min (the time of cell harvest) after release from α-factor synchronisation. Scc1 was detected with the α-aid antibody, tubulin served as the loading control and was detected with a mouse monoclonal α-Tub1 antibody (clone TAT-1). (D) Cohesin ChIP signal intensity distributions at loop anchors (normalised mean reads), in the absence or presence of rapamycin, in both the G1 and G2/M synchronised cultures. Grey lines connect individual ChIP signal intensities under the two conditions (G1: n = 1059, G2: n = 1447). Corner score distributions of the corresponding loops (G1: n = 788, G2: n = 1060), before and after transcription inhibition, as well as of the same loop positions sampled following Scc1 depletion, are shown alongside. Box plots represent the median (centre), quartiles (box) and range (whiskers). Baseline corner scores in the absence of cohesin are indicated by dashed lines. (E) Chromosight TAD boundary (n = 822) and Chromosight loop score (n = 1300) distributions, detected in SCC1 cells grown in glucose (Fig. 5) and recorded from the maps under the indicated experimental conditions. Box plots represent the median (centre), quartiles (box) and range (whiskers).

References

    1. Aljahani A, Hua P, Karpinska MA, Quililan K, Davies JOJ, Oudelaar AM (2022) Analysis of sub-kilobase chromatin topology reveals nano-scale regulatory interactions with variable dependence on cohesin and CTCF. Nat Commun 13:2139 - PMC - PubMed
    1. Baejen C et al (2017) Genome-wide analysis of RNA Polymerase II termination at protein-coding genes. Mol Cell 66:38–49 - PubMed
    1. Banigan EJ, Tang W, van den Berg AA, Stocsits RR, Wutz G, Brandão HB, Busslinger GA, Peters J-M, Mirny LA (2023) Transcription shapes 3D chromatin organization by interacting with loop extrusion. Proc Natl Acad Sci USA 120:e2210480120 - PMC - PubMed
    1. Barth R, Davidson IF, van der Torre J, Taschner M, Gruber S, Peters J-M, Dekker C (2023) SMC motor proteins extrude DNA asymmetrically and contain a direction switch. Preprint at bioRxiv 10.1101/2023.12.21.572892
    1. Bastié N, Chapard C, Dauban L, Gadal O, Beckouët F, Koszul R (2022) Smc3 acetylation, Pds5 and Scc2 control the translocase activity that establishes cohesin-dependent chromatin loops. Nat Struct Mol Biol 29:575–585 - PubMed

MeSH terms