. 2024 Nov;43(21):4846-4869.
doi: 10.1038/s44318-024-00196-0. Epub 2024 Aug 19.

PCPE-1, a brown adipose tissue-derived cytokine, promotes obesity-induced liver fibrosis

Affiliations

PCPE-1, a brown adipose tissue-derived cytokine, promotes obesity-induced liver fibrosis

Yung Ting Hsiao et al. EMBO J. 2024 Nov.

Abstract

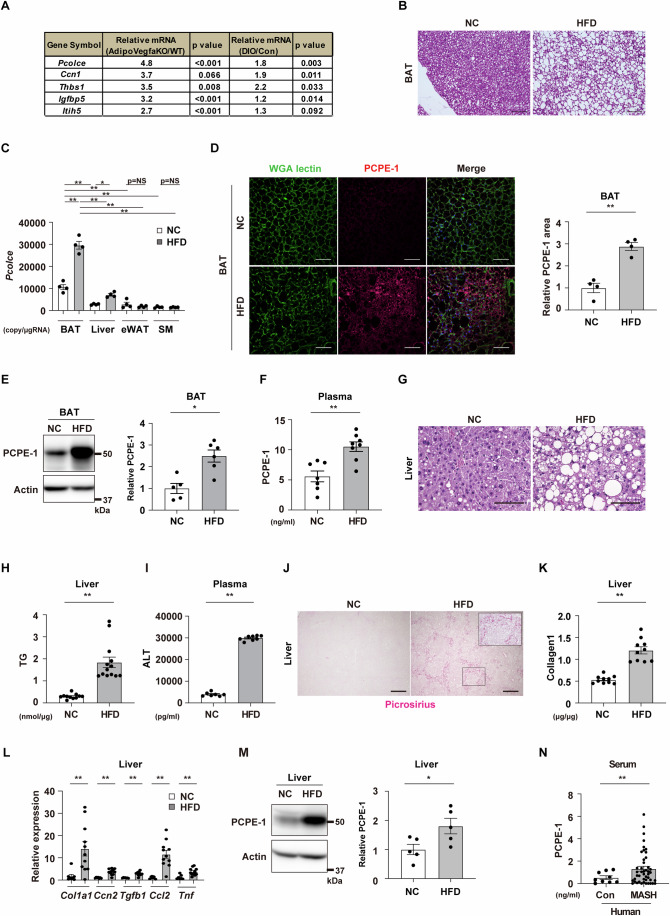
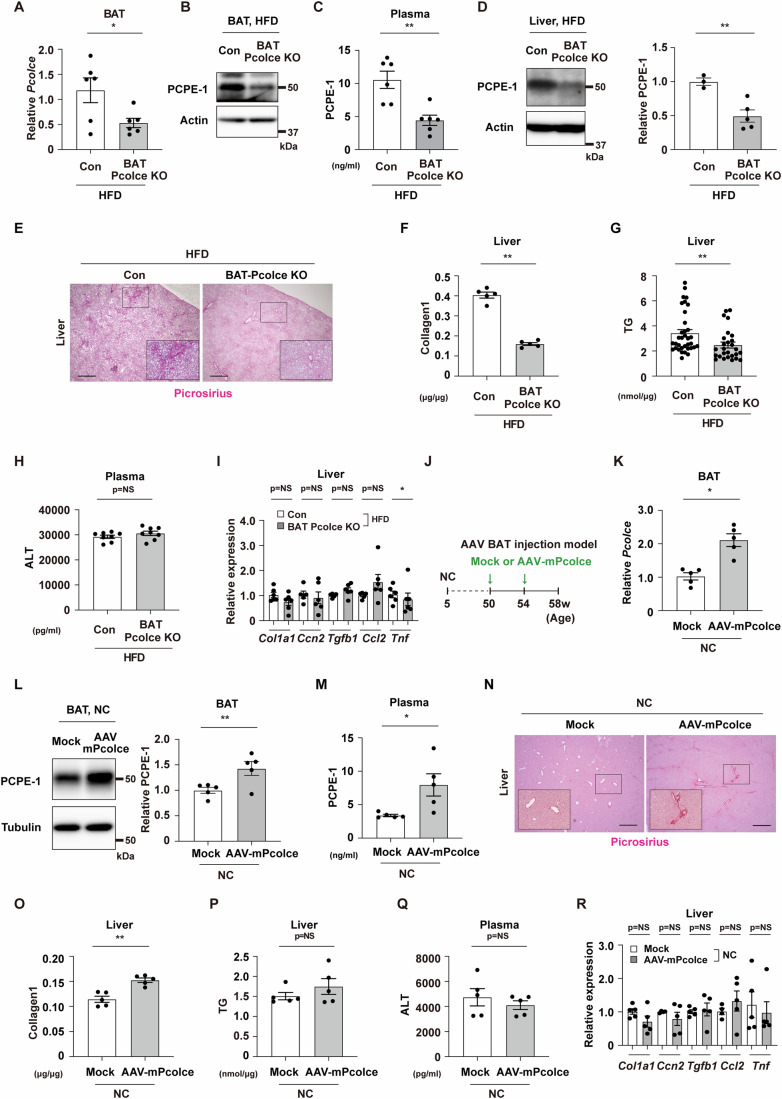
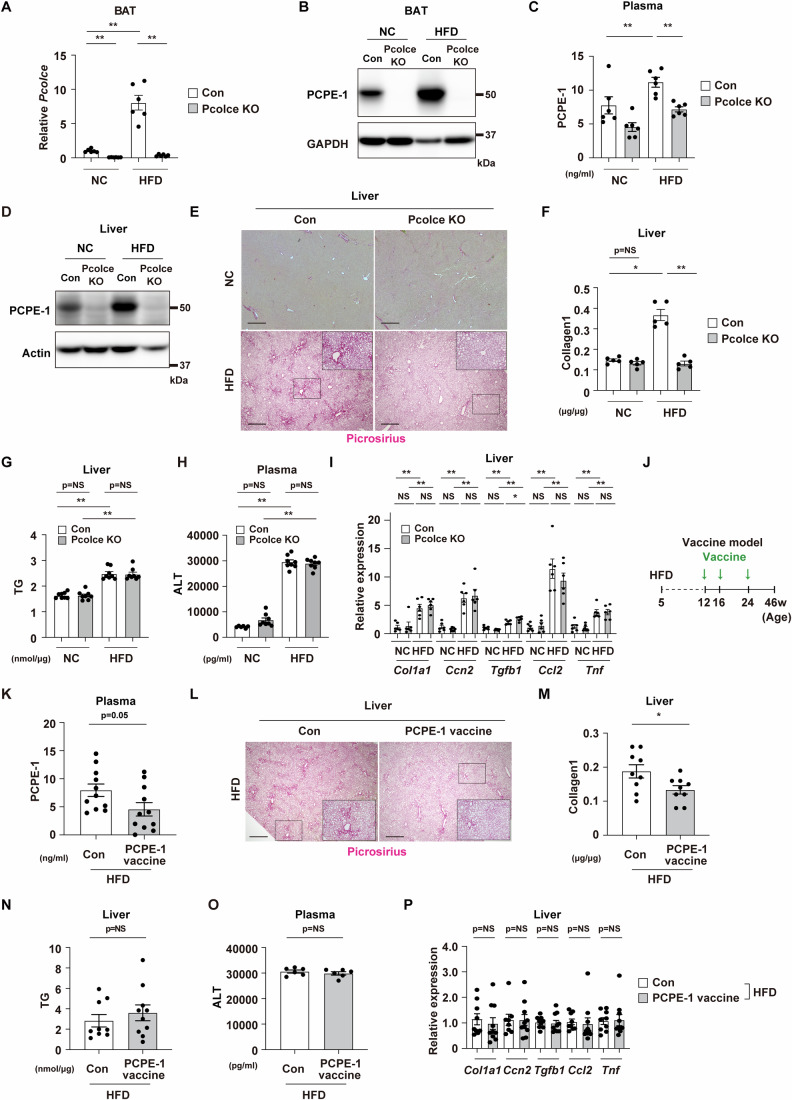
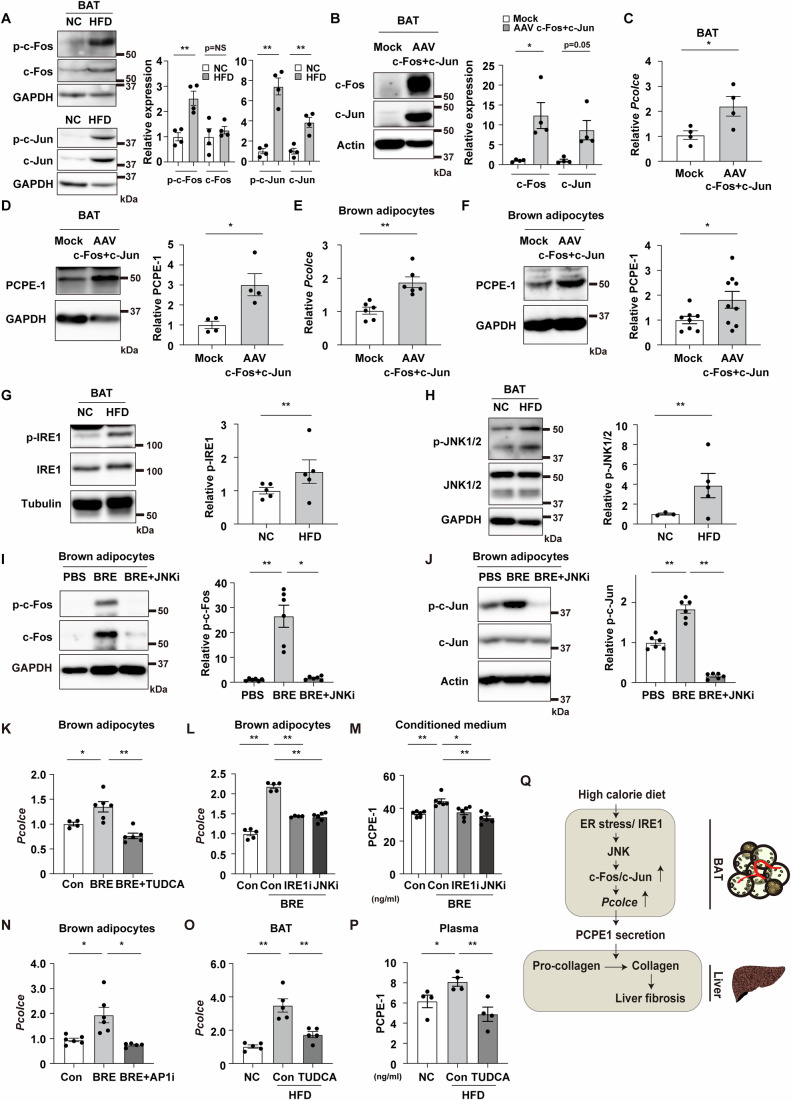
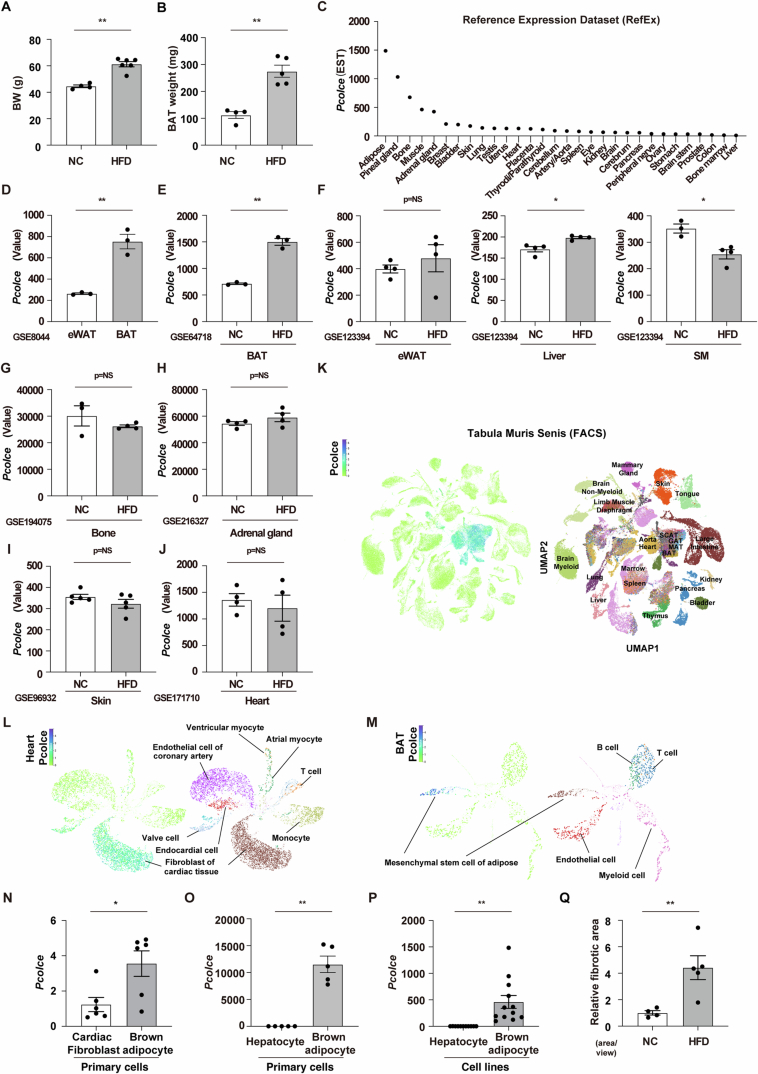
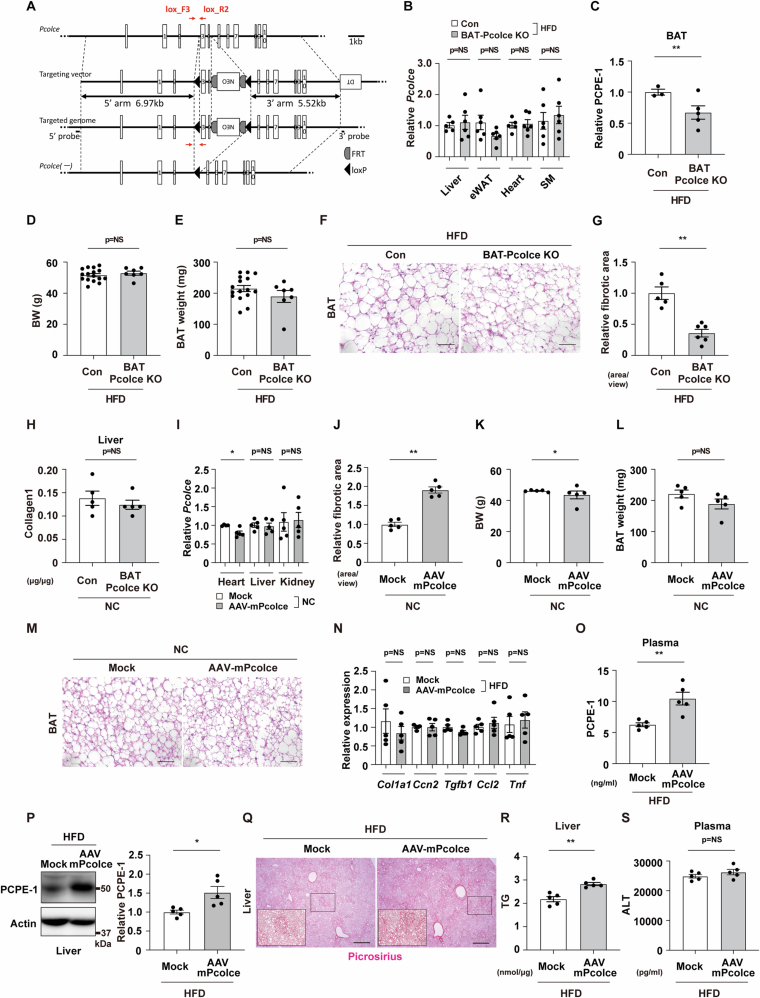
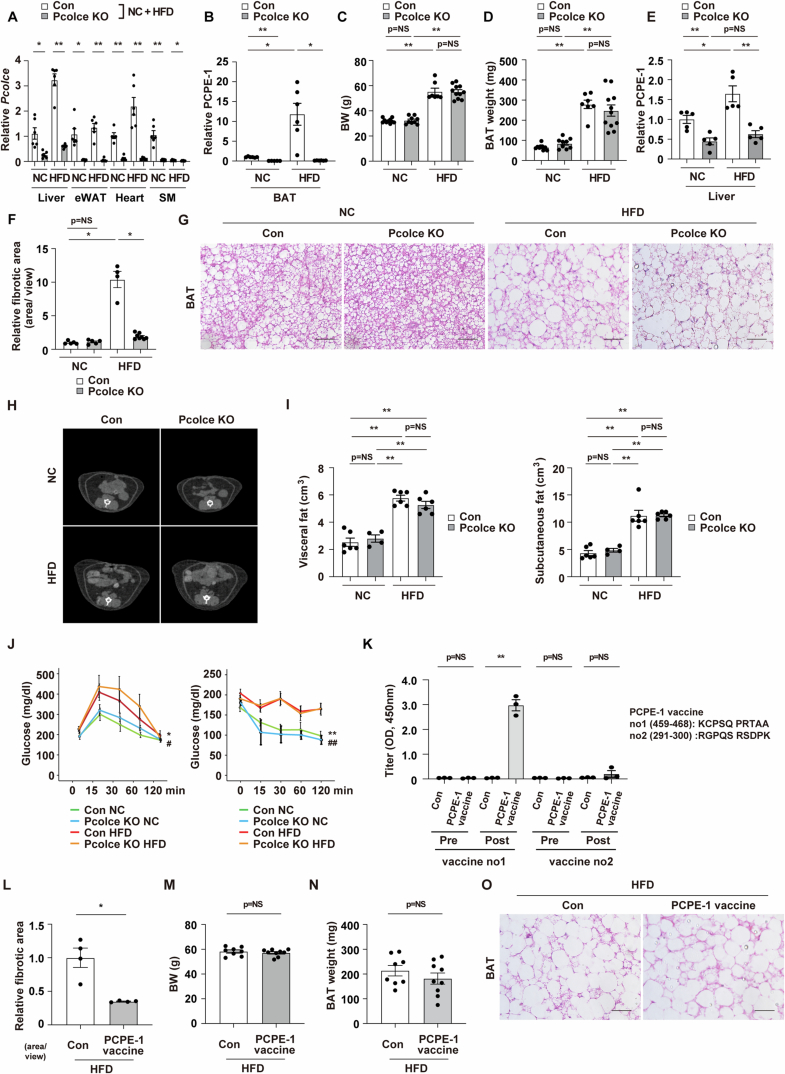
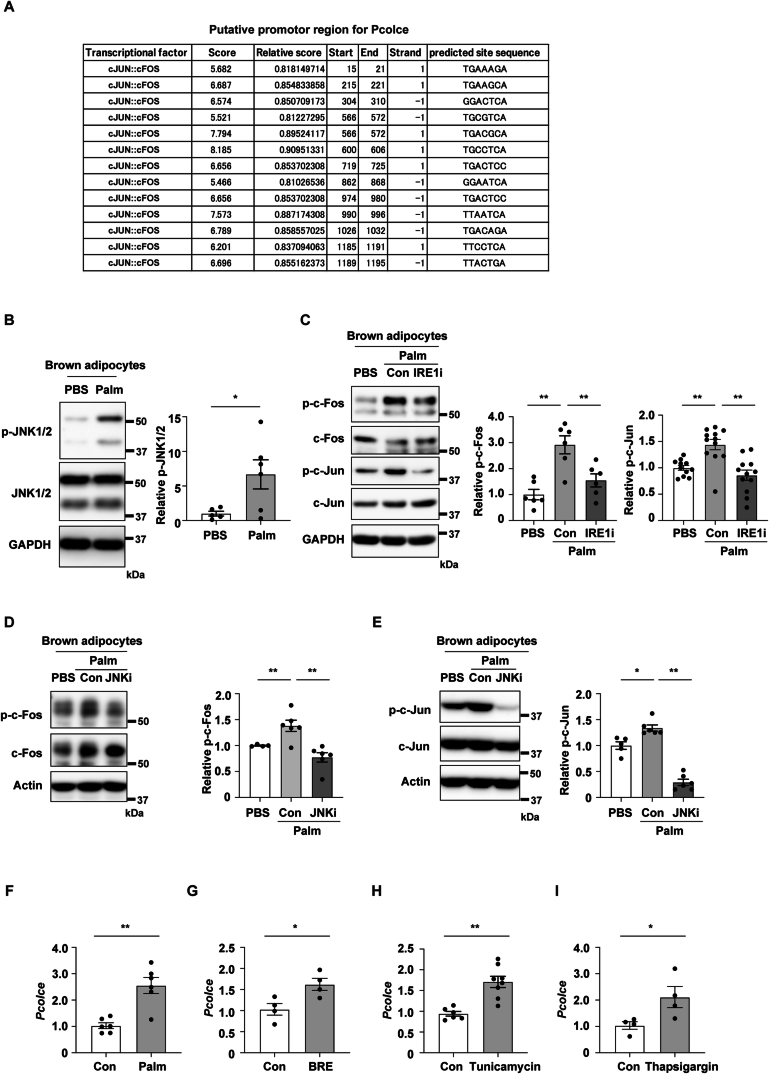
Metabolic dysfunction-associated steatohepatitis (MASH, previously termed non-alcoholic steatohepatitis (NASH)), is a major complication of obesity that promotes fatty liver disease. MASH is characterized by progressive tissue fibrosis and sterile liver inflammation that can lead to liver cirrhosis, cancer, and death. The molecular mechanisms of fibrosis in MASH and its systemic control remain poorly understood. Here, we identified the secreted-type pro-fibrotic protein, procollagen C-endopeptidase enhancer-1 (PCPE-1), as a brown adipose tissue (BAT)-derived adipokine that promotes liver fibrosis in a murine obesity-induced MASH model. BAT-specific or systemic PCPE-1 depletion in mice ameliorated liver fibrosis, whereas, PCPE-1 gain of function in BAT enhanced hepatic fibrosis. High-calorie diet-induced ER stress increased PCPE-1 production in BAT through the activation of IRE-1/JNK/c-Fos/c-Jun signaling. Circulating PCPE-1 levels are increased in the plasma of MASH patients, suggesting a therapeutic possibility. In sum, our results uncover PCPE-1 as a novel systemic control factor of liver fibrosis.

Keywords: BATokine; Fibrosis; MASH; Obesity; PCPE-1.


Conflict of interest statement

The authors declare no competing interests.

Figures

Figure 1
Figure 1. Exploration of BAT-derived adipokine in obesity.
(A) Results of DNA microarray datasets analyzing brown adipose tissue (BAT) from adipose tissue-specific Vegfa knockout mice (Adipo-Vegfa KO) (GSE221854) or high-fat diet (HFD) fed wild-type mice (diet-induced obesity (DIO)) (GSE28440). (B) C57BL/6NCrSlc mice were fed with a normal chow (NC) or a high-fat diet (HFD) from 4 weeks of age and studied at 34–38 weeks of age. Hematoxylin-eosin (HE) staining of BAT from indicated mice. Scale bar = 100 μm. (C) Copy number for the transcript Pcolce in BAT, liver, epididymal white adipose tissue (eWAT) and skeletal muscle (SM) (quadriceps) of the indicated mice (all n = 4). (D) Immunofluorescent staining for procollagen C-endopeptidase enhancer-1 (PCPE-1) in BAT of the indicated mice. Scale bar = 50 μm. The right panel indicates the quantification of the PCPE-1 positive area in BAT (n = 4, 4). (E) Western blot analysis of PCPE-1 expression in BAT from the indicated mice. The right panel indicates the quantification of PCPE-1 relative to Actin (n = 5, 6). (F) ELISA for PCPE-1 in plasma from the indicated mice (n = 7, 8). (G) HE staining of the liver from the indicated mice. Scale bar = 100 μm. (H, I) ELISA for liver triglyceride (TG) (n = 11, 13) (H) or plasma alanine transaminase (ALT) (n = 7, 8) (I) in the indicated mice. (J) Picrosirius red staining of liver from the indicated mice. Scale bar = 500 μm. The quantification results see Fig. EV1Q. (K) ELISA for liver collagen type I (Collagen1) in the indicated mice (n = 10, 10). (L) Results from quantitative PCR (qPCR) showing transcripts Col1a1 (n = 8, 11), Ccn2(Ctgf) (n = 7, 11), Tgfb1 (n = 7, 11), Ccl2 (n = 7, 11), and Tnf (n = 7, 11) in the liver from the indicated mice. (M) Western blot analysis of PCPE-1 expression in liver from the indicated mice. The right panel indicates the quantification of PCPE-1 relative to Actin (n = 5, 5). (N) ELISA for human PCPE-1 in serum from control (Con) or MASH patients (n = 10, 45). Except for (C), all data were analyzed by an independent-samples T-test. The data in (C) were analyzed by a two-way analysis of variance (ANOVA) followed by Tukey’s multiple comparison test. All data are from different biological replicates. In (N), analyses were performed including values categorized as outliers. Data information: Representative data of two independent series (CE, L, M), one independent experiment analyzing samples from at least 2 independently prepared samples (F, H, I, K, N). *p < 0.05, **p < 0.01. Values represent the mean ± SEM. NS = not significant. Source data are available online for this figure.
Figure 2
Figure 2. BATokine PCPE-1 promotes liver fibrosis in MASH.
Littermate control (Con) or BAT-specific Pcolce knockout mice (BAT Pcolce KO) were fed a high-fat diet (HFD) from 4 weeks of age and studied at 42–43 weeks of age. (A) Quantitative PCR (qPCR) results showing transcript Pcolce in BAT from indicated mice (n = 6, 6). (B) Western blot analysis for procollagen C-endopeptidase enhancer-1 (PCPE-1) in BAT from indicated mice. The quantification results for this panel see Fig. EV2C. (C) ELISA for plasma PCPE-1 (n = 6, 6) in the indicated mice aged 42–43 weeks. (D) Western blot analysis for PCPE-1 in liver from indicated mice. The right panel indicates the quantification (n = 3,5). (E) Picrosirius red staining of liver from the indicated mice. Scale bar = 500 μm. For the quantification results see Fig. EV2G. (FH) ELISA for liver collagen type I (F) (n = 5, 5), liver triglyceride (TG) (G) (n = 35, 27), and plasma alanine transaminase (ALT) (H) (n = 8, 8) in the indicated mice aged 42–43 weeks. (I) Results from qPCR showing transcripts Col1a1 (n = 6, 6), Ccn2(Ctgf) (n = 5, 6), Tgfb1 (n = 5, 6), Ccl2 (n = 5, 6), and Tnf (n = 6, 6) in liver from indicated mice. (J) Experimental design of the BAT-adeno-associated virus (AAV) mouse: Pcolce gain-of-function model (AAV-mPcolce). AAV-mPcolce was injected into BAT at 50 and 54 weeks of age (a total of 2 injections) in a normal chow (NC) fed mice and studied at 58 weeks of age. (K) Results of a qPCR showing transcript Pcolce in BAT (n = 5, 5). (L, M) Western blot analysis for PCPE-1 in BAT (n = 5, 5) (right panel indicates the quantification of PCPE-1 relative to Tubulin) (L), and ELISA for mouse PCPE-1 in plasma (M) (n = 5, 5) of indicated mice. (N) Picrosirius red staining of liver from the indicated mice. Scale bar = 500 μm. For the quantification results see Fig. EV2J. (OQ) ELISA for liver collagen type I (O) (n = 5, 5), liver TG (P) (n = 5, 5), and plasma ALT (Q) (n = 5, 5) from indicated mice. (R) qPCR of Col1a1 (n = 5, 5), Ccn2(Ctgf) (n = 4, 5), Tgfb1 (n = 5, 5), Ccl2 (n = 4, 5) and Tnf (n = 5, 5) in liver from the indicated mice. All data were analyzed by an independent-samples T-test. Data information: Representative data of two or more independent series (A, D, FH), one independent series (I, K, L, R), one independent experiment analyzing samples from at least 2 independently prepared samples (C, FH, M, OQ). *p < 0.05, **p < 0.01. Values represent the mean ± SEM. NS = not significant. All data are from different biological replicates. Source data are available online for this figure.
Figure 3
Figure 3. Models with systemic PCPE-1 inhibition ameliorate liver fibrosis.
Littermate control (Con) or systemic Pcolce KO mice were fed a normal chow (NC) or a high-fat diet (HFD) from 4 weeks of age and studied at 38–40 weeks of age. (A) Quantitative PCR (qPCR) results showing transcript Pcolce in BAT from indicated mice (n = 6, 6, 6, 6). (BD) Western blot analysis for PCPE-1 in BAT (B) or liver (D), and ELISA showing plasma PCPE-1 (C) (n = 6, 6, 6, 6) from indicated mice. For the quantification of these Western blot results see Fig. EV3B or Fig. EV3E. (E) Picrosirius red staining of liver from the indicated mice. Scale bar = 500 μm. For the quantification results see Fig. EV3F. (FH) ELISA for liver collagen type I (F) (n = 5, 5, 5, 5), liver triglyceride (TG) (G) (n = 8, 8, 8, 8), and plasma alanine transaminase (ALT) (H) (n = 6, 8, 8, 8) (G) in the indicated mice. (I) Results from qPCR showing transcript Col1a1, Ccn2(Ctgf), Tgfb1, Ccl2, and Tnf in liver from indicated mice (n = 6, 6, 6, 6). (J) Experimental design of a vaccination therapy targeting PCPE-1. C57BL/6NCrSlc mice were fed a HFD from 4 weeks of age. These mice were injected with a PCPE-1 vaccine at 12, 16, and 24 weeks of age (total of 3 injections), and studied at 46 weeks of age. (K) ELISA for plasma PCPE-1 in the indicated mice (n = 11, 11). (L) Picrosirius red staining of liver from the indicated mice. Scale bar = 500 μm. For the quantification results see Figure EV3L. (MO) ELISA for liver collagen type I (M) (n = 9, 9), liver TG (N) (n = 9, 10), and plasma ALT (O) (n = 6, 6) in the indicated mice. (P) Results from qPCR showing transcripts Col1a1 (n = 9, 10), Ccn2(Ctgf) (n = 8, 10), Tgfb1 (n = 9, 10), Ccl2 (n = 9, 10) and Tnf (n = 9, 10) in liver from indicated mice. All data were analyzed by an independent-samples T-test. Data information: Representative data of two or more independent series (A, I), one independent series (P), one independent experiment analyzing samples from at least 2 independently prepared samples (C, FH, K, MO). *p < 0.05, **p < 0.01. Values represent the mean ± SEM. NS = not significant. All data are from different biological replicates. Source data are available online for this figure.
Figure 4
Figure 4. ER stress pathway increases PCPE-1 in brown adipocytes.
(A) Western blot analysis for phospho c-Fos (p-c-Fos), c-Fos, phospho c-Jun (p-c-Jun), and c-Jun in brown adipose tissue (BAT) from C57BL/6NCrSlc wild-type (WT) mice fed a normal chow (NC) or a high-fat diet (HFD) (aged 32–38 weeks). The right panel indicates the quantification of p-c-Fos, c-Fos, p-c-Jun, and c-Jun relative to GAPDH (n = 4, 4). (B) Western blot analysis for c-Fos and c-Jun in BAT injected with adeno-associated virus (AAV) encoding c-Fos (AAV-c-Fos) co-injected with AAV-c-Jun (AAV-c-Fos+c-Jun) into this tissue. AAV study was done in 12-week-old WT mice maintained on a normal chow diet 7 days after the injection. The right panel indicates the quantification of c-Fos and c-Jun relative to Actin (n = 4, 4). (C, D) Results from quantitative PCR (qPCR) showing transcript Pcolce (n = 4, 4) (C) and western blot analysis for PCPE-1 (D) in BAT from indicated mice. The right panel in (D) indicates the quantification of PCPE-1 relative to GAPDH (n = 4, 4). (E, F) Results from qPCR showing transcript Pcolce (n = 6, 6) (E) and western blot analysis for PCPE-1 (F) in differentiated brown adipocytes introduced with mock or AAV-c-Fos+c-Jun. In Fig. 4F, the right panel indicates the quantification of PCPE-1 relative to GAPDH (n = 8, 9). (G, H) Western blot analysis for p-IRE1, IRE1 (G), and p-JNK1/2 and JNK1/2 (H) in BAT from WT mice fed a NC or a HFD (34–38 weeks of age). The right panel indicates the quantification of p-IRE1 relative to Tubulin (G) (n = 5, 5) and p-JNK1/2 (H) (n = 3, 5) relative to GAPDH in BAT. (I, J) Western blot analysis for p-c-Fos, c-Fos (I), p-c-Jun, and c-Jun (J) in fully differentiated brown adipocytes administrated with PBS, BRE (Brefeldin A, as an ER stress inducer), or BRE + JNK inhibitor (SP600125). The right panels in (I) and (J) indicate the quantification of p-c-Fos relative to GAPDH (n = 6, 6, 6) or p-c-Jun relative to Actin (n = 6, 6, 6). (K, L) Results from qPCR showing transcript Pcolce in differentiated brown adipocytes. These cells were administrated with BRE, together with an introduction of tauroursodeoxycholic acid sodium salt (TUDCA) (K) (n = 4, 6, 6), IRE1 inhibitor (IRE1-i) or JNK inhibitor (JNK-i) (L) (n = 5, 5, 4, 6). (M) ELISA study testing PCPE-1 in conditioned medium of differentiated brown adipocytes treated with the indicated groups (n = 6, 6, 6, 6). (N) Results from qPCR showing transcript Pcolce in differentiated brown adipocytes. These cells were administrated with BRE, together with an introduction of AP1 inhibitor (AP1-i) (N) (n = 6, 6, 5). (O) Results from qPCR showing transcript Pcolce in BAT of the indicated mice (n = 5, 5, 5). (P) ELISA study testing plasma PCPE-1 in the indicated group (n = 4, 4, 4). (Q) Scheme summarizing ER stress/IRE1/JNK/c-Fos/c-Jun signaling up-regulates PCPE-1 expression in BAT under high-calorie diet. c-Fos/c-Jun increases the production of PCPE-1 in BAT and promotes fibrosis in the liver. All data, except for figures (IO) were analyzed by an independent-samples T-test. The data in (IO) were analyzed by a two-way analysis of variance (ANOVA) followed by Tukey’s multiple comparison test (K, M, O), Dunnett test (J, L), or non-parametric Kruskal Wallis test (I, N). Data information: Representative data of two or more independent series (A, B, D, EL, N), one independent series (C, M, O, P). *p < 0.05, **p < 0.01. Values represent the mean ± SEM. NS = not significant. All data are from different biological replicates. Source data are available online for this figure.
Figure EV1
Figure EV1. Related to Fig. 1.
C57BL/6NCrSlc wild-type (WT) mice were fed with a normal chow (NC) or a high-fat diet (HFD) from 4 weeks of age and studied at 38–40 weeks of age. (A, B) Body weight (BW) (A) (n = 4, 6) or brown adipose tissue (BAT) weight (B) (n = 4, 5) of indicated mice. (C) Reference Expression Dataset (RefEx) showing transcript Pcolce in systemic organs. (DJ) Gene Expression Omnibus studies showing transcript Pcolce in eWAT and BAT (D) (n = 3, 3 in GSE8044). The transcript was also tested under a HFD fed condition in mice in BAT (E) (n = 3, 3 in GSE64718), eWAT (n = 4, 4), liver (n = 4, 4), skeletal muscle (SM) (F) (n = 3, 4 in GSE123394), bone (G) (n = 3, 4 in GSE194075), adrenal gland (H) (n = 4, 4 in GSE216327), skin (I) (n = 5, 5 in GSE96932) and in heart (J) (n = 4, 4 in GSE171710). (KM) Tabula Muris Senis testing transcript Pcolce in systemic organs (K), or in cells in the heart (L) or BAT (M). (NP) Results from quantitative PCR (qPCR) showing transcript Pcolce in primary cardiac fibroblasts and primary brown adipocytes (N) (n = 6, 6), primary hepatocytes and primary brown adipocytes (O) (n = 5, 5), and hepatocyte (AML12) or brown adipocyte cell lines (P) (n = 11, 12). (Q) Relative fibrotic area (area/view) in the liver of indicated mice related to Fig. 1J (n = 4, 5). Data were analyzed by an independent-samples T-test. Data information: Representative data of two or more independent series (EV1A, B, N, P, Q), one independent series (EV1O). *P < 0.05, **P < 0.01. NS = not significant. Values represent the mean ± SEM. All data are from different biological replicates. Source data are available online for this figure.
Figure EV2
Figure EV2. Related to Fig. 2.
Brown adipose tissue (BAT)-specific Pcolce knockout (KO) mice (UCP1-Cre+/-; Pcolceflox/flox; BAT Pcolce KO) or littermate control mice (UCP1-Cre-/-; Pcolceflox/flox; Con) were fed a high-fat diet (HFD) from 4 weeks of age and studied at 42–43 weeks of age. (A) Design of the BAT Pcolce KO mice. (B) Results from quantitative PCR (qPCR) showing transcript Pcolce in the liver (n = 5, 6), epididymal white adipose tissue (eWAT) (n = 6, 6), heart (n = 5, 6), and skeletal muscle (SM) (quadriceps) (n = 6, 6) from indicated mice fed a HFD. (C) The quantification of western blot analysis for PCPE-1 relative to Actin in BAT (n = 3, 5) related to Fig. 2B. (D, E) Body weight (BW) (D) (n = 16, 7), or BAT weight (E) (n = 16, 7) of indicated mice. (F) HE staining of the BAT from the indicated mice. Scale bar = 50 μm. (G) Relative fibrotic area in liver in the indicated mice, related to Fig. 2E (n = 5, 6). (H) ELISA for liver collagen type I (Collagen1) in the indicated mice (n = 5, 5). (I) Results from quantitative PCR (qPCR) showing transcript Pcolce in heart (n = 4, 5), liver (n = 5, 5) and kidney (n = 5, 5) in the indicated mice. (J) Relative fibrotic area of the liver in BAT AAV-Pcolce injection model (AAV-mPcolce) maintained on a normal chow (NC) related to Fig. 2N (58 weeks of age) (n = 5, 5). (K, L) Body weight (BW) (K) (n = 5, 5), or BAT weight (L) (n = 5, 5) of indicated mice. (M) HE staining of the BAT from the indicated mice. Scale bar = 50 μm. (N) Results from quantitative PCR (qPCR) showing transcripts Col1a1 (n = 5, 5), Ccn2(Ctgf) (n = 4, 5), Tgfb1 (n = 5, 5), Ccl2 (n = 5, 5), and Tnf (n = 5, 5) in the liver from the indicated mice. (O) ELISA for PCPE-1 in plasma from the indicated mice (n = 5, 5). (P) Western blot analysis of PCPE-1 expression in liver from the indicated mice. The right panel indicates the quantification of PCPE-1 relative to Actin (n = 5, 5). (Q) Picrosirius red staining of liver from the indicated mice. Scale bar = 500 μm. The quantification results see Figure Appendix Figure S2H. (R, S) ELISA for liver triglyceride (TG) (R) (n = 5, 5) or plasma alanine transaminase (ALT) (S) (n = 5, 5) in the indicated mice. All data were analyzed by an independent-samples T-test. Data information: Representative data of two or more independent series (EV2B–E, G), one independent series (EV2I–L, N, P), one independent experiment analyzing samples from at least 2 independently prepared samples (EV2H, O, R, S). *P < 0.05, **P < 0.01. NS = not significant. Values represent the mean ± SEM. All data are from different biological replicates. Source data are available online for this figure.
Figure EV3
Figure EV3. Related to Fig. 3.
Systemic Pcolce knockout (Pcolce KO) or littermate control (Con) mice were maintained on a HFD from 4 weeks of age, and tissues were harvested and analyzed at 38–44 weeks of age. (A) Results from quantitative PCR (qPCR) showing transcript Pcolce in the liver, epididymal white adipose tissue (eWAT), heart, and skeletal muscle (SM) (quadriceps) from the indicated mice (heart: n = 5, 6, 6, 6, all other organs: n = 6, 6, 6, 6). (B) The quantification of western blot analysis for PCPE-1 relative to GAPDH in BAT related to Fig. 3B (n = 5, 6, 6, 6). (C, D) Body weight (BW) (n = 10, 9, 7, 11) (C), or BAT weight (n = 10, 9, 7, 11) (D) of indicated mice. (E) The quantification of western blot analysis for PCPE-1 relative to Actin in liver related to Fig. 3D (n = 5, 5, 5, 5). (F) Relative fibrotic area in the liver of indicated mice, related to Fig. 3E (n = 5, 5, 4, 8). (G) HE staining of the BAT from the indicated mice. Scale bar = 50 μm. (H) CT scan analyzing the abdominal area of indicated mice aged 29 weeks of age. (I) Volume of visceral or subcutaneous fat in the subdiaphragm abdominal area analyzed with a CT scan (n = 6, 4, 6, 6). (J) Glucose tolerance test (GTT) (n = 6, 4, 8, 8) or insulin tolerance test (ITT) (n = 6, 4, 8, 7) of the indicated mice. * and ** indicates Con NC vs Con HFD. # and # # indicates Pcolce KO NC vs Pcolce KO HFD. (K) The antibody titer in plasma was studied at pre- and post-immunization with two antigenic PCPE-1 peptide sequences (vaccine no.1 (KCPSQ PRTAA) and no.2 (RGPQS RSDPK)) (n = 3, 3, 3, 3, 3, 3, 3, 3). (L) Relative fibrotic area in the liver of indicated mice, related to Fig. 3L (n = 4, 4). (M, N) Body weight (BW) (M) (n = 8, 9), and BAT weight (N) (n = 8, 9) of mice with or without PCPE-1 vaccination (vaccine no.1). (O) HE staining of the BAT from the indicated mice. Scale bar = 50 μm. All mice were maintained on a HFD and analyzed at 47 weeks age. The data in (BD), (F), (I) were analyzed by a two-way analysis of variance (ANOVA) followed by Tukey’s multiple comparison test (I), Dunnett test (F), or non-parametric Kruskal Wallis test (C, D). All the values in (A) were analyzed by a two-way ANOVA followed by Dunnett test except for NC in liver and HFD groups in SM analyzed by the independent-samples T-test. In (B), Con NC vs Con HFD was analyzed with the independent-samples T-test and other values were analyzed by a two-way ANOVA followed by Dunnett test. The data in (J) were analyzed with two-way repeated measures ANOVA. Other data were analyzed by an independent-samples T-test. Data information: Representative data of two or more independent series (EV3A–F, L–N), one independent series (EV3I–K). * and # P < 0.05, ** and ##P < 0.01. NS = not significant. Values represent the mean ± SEM. All data are from different biological replicates. Source data are available online for this figure.
Figure EV4
Figure EV4. Related to Fig. 4.
(A) Results of in silico analysis (DBTSS [http://dbtss.hgc.jp] and JASPAR [http://jaspar.binf.ku.dk]) predicting c-Fos and c-Jun may bind to putative promotor region of Pcolce. (B) Western blot analysis for phospho-JNK1/2 (p-JNK1/2) and JNK1/2 in fully differentiated brown adipocytes administrated with or without palmitic acid (Palm, 100 μM). The right panel indicates the quantification of p-JNK1/2 (n = 6, 6) relative to GAPDH. (CE) Western blot analysis for p-c-Fos, c-Fos, p-c-Jun, and c-Jun in fully differentiated brown adipocytes administrated with PBS, palmitic acid (Palm; 100 μM for 6 h) with or without an IRE1 inhibitor (STF-083010, 30 μM, pre-treated 1 h) (C) or a JNK inhibitor (SP600125, 2 μM, pre-treated 1 h) (D, E). The right panels indicate the quantification of p-c-Fos and p-c-Jun relative to GAPDH or Actin (C: n = 6, 6, 6 for p-c-Fos, n = 11, 12, 12 for p-c-Jun) (D: n = 4, 6, 6) (E: n = 5,6,6). (FI) Results from quantitative PCR (qPCR) showing transcript Pcolce in the differentiated brown adipocytes administrated with Palm (E) (n = 6, 6), BRE (Brefeldin A) (G) (n = 4, 4), Tunicamycin (H) (n = 6, 8) or Thapsigargin (I) (n = 4, 4). Data in Fig. EV4C–E were analyzed by a two-way analysis of variance (ANOVA) followed by Tukey’s multiple comparison test. Other data were analyzed by an independent-samples T-test. Data information: Representative data of two or more independent series (EV4B–I). *P < 0.05, **P < 0.01. NS = not significant. Values represent the mean ± SEM. All data are from different biological replicates. Source data are available online for this figure.

References

    1. Ali D, Figeac F, Caci A, Ditzel N, Schmal C, Kerckhofs G, Havelund J, Faergeman N, Rauch A, Tencerova M et al (2022a) Gene Expression Omnibus GSE194075. https://www.ncbinlmnihgov/geo/query/acccgi?acc=GSE194075 [DATASET] - PMC - PubMed
    1. Ali D, Figeac F, Caci A, Ditzel N, Schmal C, Kerckhofs G, Havelund J, Faergeman N, Rauch A, Tencerova M et al (2022b) High-fat diet-induced obesity augments the deleterious effects of estrogen deficiency on bone: Evidence from ovariectomized mice. Aging Cell 21:e13726 - PMC - PubMed
    1. Almind K, Kahn CR (2004a) Gene Expression Omnibus 123394. https://www.ncbinlmnihgov/geo/query/acccgi?acc=GSE123394 [DATASET]
    1. Almind K, Kahn CR (2004b) Genetic determinants of energy expenditure and insulin resistance in diet-induced obesity in mice. Diabetes 53:3274–3285 - PubMed
    1. Bartelt A, Bruns OT, Reimer R, Hohenberg H, Ittrich H, Peldschus K, Kaul MG, Tromsdorf UI, Weller H, Waurisch C et al (2011) Brown adipose tissue activity controls triglyceride clearance. Nat Med 17:200–205 - PubMed

MeSH terms