. 2024 Sep;6(9):1668-1681.
doi: 10.1038/s42255-024-01105-9. Epub 2024 Aug 19.

Cancer tissue of origin constrains the growth and metabolism of metastases

Affiliations

Cancer tissue of origin constrains the growth and metabolism of metastases

Sharanya Sivanand et al. Nat Metab. 2024 Sep.

Abstract

Metastases arise from subsets of cancer cells that disseminate from the primary tumour1,2. The ability of cancer cells to thrive in a new tissue site is influenced by genetic and epigenetic changes that are important for disease initiation and progression, but these factors alone do not predict if and where cancers metastasize3,4. Specific cancer types metastasize to consistent subsets of tissues, suggesting that primary tumour-associated factors influence where cancers can grow. We find primary and metastatic pancreatic tumours have metabolic similarities and that the tumour-initiating capacity and proliferation of both primary-derived and metastasis-derived cells is favoured in the primary site relative to the metastatic site. Moreover, propagating cells as tumours in the lung or the liver does not enhance their relative ability to form large tumours in those sites, change their preference to grow in the primary site, nor stably alter aspects of their metabolism relative to primary tumours. Primary liver and lung cancer cells also exhibit a preference to grow in their primary site relative to metastatic sites. These data suggest cancer tissue of origin influences both primary and metastatic tumour metabolism and may impact where cancer cells can metastasize.


Figures

Extended Data Figure 1.
Extended Data Figure 1.. Proliferation of primary and metastatic pancreatic cancer cells in culture and cell competition experiments in mice.
(a-c) Proliferation rate (doublings/day) of cells in culture that were isolated from primary tumors, or from liver or lung metastases, as indicated. Data shown were obtained from three independently derived paired cell lines; mean +/− stdev, n=4 technical replicates (a and b), or 3 technical replicates (c) per cell line; representative data from independent biological replicates of at least n=3 per cell line. (d) Representative western blot analysis assessing mutant Kras expression in protein lysates obtained from the indicated pancreatic cell lines and established human cell line controls and pancreatic stellate cells (PSCs). Mutant Kras G12D expression was only validated once per cell line at the time of generating the cell lines, (e) Schematic of experimental procedure where primary or liver metastatic pancreatic cancer cells (liver met) labeled with mCherry or GFP were injected into the pancreas, liver, or subcutaneous flank; either implanted individually or as a 50:50 mixture of the indicated cells. Representation of each cell population in the final tumor was analyzed by flow cytometry or by immunohistochemistry (IHC). (f) Flow cytometry of individually labeled cell populations (top) and a mixed population (bottom left). Approximately equal representation of each labeled cancer cell population in a mixed population was confirmed prior to injection (representative data shown bottom right). (g) Tumor weight post injection of individually labeled cancer cells (n=3) or a mixed cell population containing equal numbers of both primary (prim) and liver metastasis (met)-derived pancreatic cancer cells (n=8). Mean +/− stdev. (h) Representation of GFP-labeled primary or mCherry-labeled liver metastatic cells in a tumor derived from injection of a mixed population containing equal numbers of labeled primary and liver metastasis-derived pancreatic cancer cells into the pancreas as determined by flow cytometry. Each data point represents one mouse; the numbers associated with each mouse indicate animal ID with each animal being injected with the same mixed population of cells. (l) Representation of mCherry-labeled primary or GFP-labeled liver metastatic cells in a tumor derived from injection of a mixed population containing equal numbers of labeled primary and liver metastasis-derived pancreatic cancer cells into the pancreas as determined by flow cytometry. Each data point represents one mouse; the numbers associated with each mouse indicate animal ID with each animal being injected with the same mixed population of cells. (j) Immunohistochemistry to assess GFP and mCherry expression in a tumor derived from injection of a mixed population containing equal numbers of primary and liver metastasis-derived pancreatic cancer cells into the pancreas as in (h) Scale bar, 250 μm. (k) Representation of GFP-labeled primary or mCherry-labeled liver metastatic cells in a tumor derived from injection of a mixed population containing equal numbers of primary and metastasis-derived pancreatic cancer cells into the liver as determined by flow cytometry. Each data point represents one mouse; the numbers associated with each mouse indicate animal ID with each animal being injected with the same mixed population of cells. (I) Immunohistochemistry to assess GFP and mCherry expression in three different tumors derived from injection of a mixed population containing equal numbers of a primary and liver metastasis-derived pancreatic cancer cells into the liver as in (k), although the mixed population of cells were from an independent experiment where the primary tumor cells were labeled with mCherry, and the liver metastasis cells were labeled with GFP. Scale bar, ~2500 μm. (m) Immunohistochemistry to assess GFP, mCherry, or Cytokeratin-19 (Ck19) expression in whole mount liver tissue sections from a mouse from an independent experiment where a mixed population containing equal numbers of primary, and liver metastasis-derived pancreatic cancer cells were implanted into the liver as in (m). (n) Representation of GFP-labeled primary or mCherry-labeled liver metastatic cells in a tumor derived from subcutaneous injection of mixed population containing equal numbers of labeled primary and liver metastasis-derived pancreatic cancer cells into the flank. Each data point represents one mouse; the numbers associated with each mouse indicate animal ID with each animal being injected with the same mixed population of cells. (o) Representation of mCherry-labeled primary or GFP-labeled liver metastatic cells in a tumor derived from subcutaneous injection of mixed population containing equal numbers of labeled primary and liver metastasis-derived pancreatic cancer cells into the flank. Each data point represents one mouse; the numbers associated with each mouse indicate animal ID with each animal being injected with the same mixed population of cells.
Extended Data Figure 2.
Extended Data Figure 2.. Assessment of glucose and glutamine fate and amino acid levels in primary pancreatic tumors and liver metastases.
(a) Plasma enrichment of U13C-glucose as determined by GC-MS after a 6-hour U13C-glucose infusion at a rate of 0.4 mg/min in mice with a primary pancreatic tumor (pancreas; n=2 female mice) or with a liver metastatic pancreatic tumor (liver; n=4 female mice). (b-i) Fractional labeling of each indicated metabolite in the indicated tissue harvested from aged matched control mice (pancreas, liver) or from mice harboring a primary pancreatic tumor, a subcutaneous pancreatic tumor, or a liver metastatic tumor that was infused with U13C-glucose as measured by GC-MS. In all cases tumors were generated by implanting pancreatic cancer cells derived from a primary tumor arising in the KP−/−C model. Mean +/− stdev; **p= 0.0088, *p=0.0224 (panel b); *p=0.0237; n.s.- not significant. Comparisons between groups were made using a two-tailed Student’s t-test (b and c). n=6 mice were used for the normal tissues (both pancreas and liver), n=4 mice were used for the pancreatic tumor, n=5 mice were used for the liver tumor, and n=5 mice were used for the subcutaneous tumors. (j-o) Fractional labeling of each indicated metabolite in pancreatic cancer primary or liver metastasis tumors as measured by GC-MS following a 6-hour infusion of U13C-glutamine at a rate of 3.7 mg/kg/min into mice. In all cases tumors were generated by implanting pancreatic cancer cells derived from a primary tumor arising in the KP−/−C mouse model. Mean +/− stdev; n=4 mice/group. (p) Levels of amino acids measured by LC-MS from primary pancreatic tumors and matched liver metastases arising in KPC mice; Mean +/− stdev (n=4 mice/condition).
Extended Data Figure 3.
Extended Data Figure 3.. Metabolic characterization of primary pancreatic cancer and liver metastatic cells in culture.
(a) Heatmap representation of unsupervised clustering of relative metabolite levels measured by LC-MS from paired primary and liver metastatic cells cultured in standard DMEM conditions; data is shown in triplicate per cell line from three independently derived cell lines. (b-j) Fractional labeling of each indicated metabolite in cells derived from a primary pancreatic tumor or a liver metastasis after being cultured with U-13C glucose for 24 hours. mean +/− stdev; data is shown from three independently derived cell lines; n=3.
Extended Data Figure 4.
Extended Data Figure 4.. Characterization of pancreatic tumor transplants into the pancreas, liver, and lung.
(a) Weights of pancreatic tumor tissue or liver tissue containing liver metastases (liver met) 4 weeks after implanting the same number of primary tumor- or liver metastasis-derived pancreatic cancer cells into the pancreas or the liver as indicated. Tissue weight +/− stdev; n=3-5 mice/condition. (b) Calculated tumor tissue weight (pancreas and liver) and tumor weight (subcutaneous) corresponding to data shown in Fig. 2b; tumor weight is calculated as the difference in tissue weight between the tumor-bearing organ and normal age-matched tissue from a non-tumor bearing mouse. For both pancreatic tumors and liver tumors, the normal tissue weight of the pancreas or the liver was subtracted to determine the calculated tumor weight, despite the observation that the entire pancreas was transformed with no macroscopic evidence of normal tissue. Subcutaneous (s.c.) tumors represent actual tumor weight. Mean+/− stdev; *p=0.045 (comparing primary cells in the pancreas vs. liver); **p=0.0011 (comparing liver met cells in the pancreas vs. liver); **p=0.0057 (comparing primary cells in the pancreas vs. the subcutaneous); **p=0.0036 (comparing liver met cells in the pancreas vs. the subcutaneous); n=3 (subcutaneous and liver), n=4 (pancreas; primary cells) n=5 (pancreas; liver met) mice per condition. Comparisons between groups were made using a two-tailed Student’s t-test. Multiple comparisons were done using 2way ANOVA and corrected for multiple comparisons using the Tukey test; cell line effect (p=0.3496), location effect (p < 0.0001). (c) Hematoxylin and Eosin (H&E) staining of tissue sections involving tumors arising from primary pancreas or liver metastatic cancer cells implanted in the pancreas or liver as indicated. The boundary between normal tissue and tumor is indicated. Scale bar- 3700 μm (lower magnification; 0.3x); 500 μm (higher magnification; 2x); Histological assessment was done for each mouse once for each independent experiment. (d) H&E staining and immunohistochemistry staining for CK19 in tumor tissue derived from primary or liver metastatic cancer cells that were implanted into the pancreas or the liver as indicated. scale bar, 50 μm. (e) Schematic depicting transplantation experiments to quantitatively assess pancreatic cancer cell proliferation in different tissue sites. (f) H&E staining of naturally arising KPC tumors (primary, liver and lung metastases (mets)) (top) or tumors resulting from transplantation of cells derived from cells isolated from the indicated primary, liver or lung metastatic tumors into each indicated site (bottom); scale bar, 50 μm.
Extended Data Figure 5.
Extended Data Figure 5.. Assessment of proliferation and cell death in tumors.
(a-c) Ki67 staining of tumor tissue derived from primary or liver metastatic (Liver Met) pancreatic cancer cells that were implanted into the pancreas (left) or the liver (right) (a) or staining of tumor tissue from primary or lung metastatic (Lung Met) pancreatic cancer cells implanted into the pancreas (b), or lung (c) as indicated. scale bar, 50 μm. (d) Immunohistochemistry stain for BrdU in a representative tumor obtained from primary or liver metastatic pancreatic cancer cells injected in either the pancreas (left) or liver (right). scale bar, 20 μm. (e-g) Immunohistochemistry staining for cleaved caspase 3 in tumor sections derived from primary, liver, or lung metastatic pancreatic cancer cells injected in either the pancreas (e), liver (f) or lung (g). Representative region per section is shown with higher magnification image shown in the bottom right inset; scale bar for panels e-g: lower magnification- 200 μm, inset- 20 μm. For panels a-f, each image is a representative region from full scan of the entire section from 1 mouse.
Extended Data Figure 6.
Extended Data Figure 6.. Independent assessment of tumor growth in pancreas and liver in immunocompetent and Nu/J mice.
(a) Weights of the indicated tissues harvested from immunocompetent C57BL/6J mice where primary, or liver metastatic pancreatic cancer cells were implanted into the pancreas, liver, or subcutaneous space on the flank. Weight of age-matched normal pancreatic and liver tissue is also shown. n=5 (pancreas, primary and normal tissues), n=6 (pancreas, liver met); n=4 (liver), n=3 (subcutaneous) male and female mice; Mean+/− stdev; n.s.- not significant. ***p=0.0001. Also shown (right) is the calculated tumor weight (pancreas and liver) and tumor weight (subcutaneous; s.c.) for these data with tumor weight calculated as the difference in tissue weight between the tumor-bearing organ and the normal age-matched tissue from a non-tumor bearing mouse. For both pancreatic tumors and liver tumors, the normal tissue weight of the pancreas or the liver was subtracted to determine the calculated tumor weight, despite the observation that the entire pancreas was transformed with no macroscopic evidence of normal tissue. Subcutaneous (s.c.) tumors represent actual tumor weight. mean+/− stdev; ***p=0.0038. Multiple comparisons were done (right panel) using 2way ANOVA and corrected for multiple comparisons using the Tukey test; cell line effect (p=0.0520), location effect (p=0.0005). (b) Calculated tumor weight represented as the difference in tissue weight between tumor-bearing organ and normal age-matched tissue from non-tumor bearing age-matched immunocompromised nude (NU/J) mice; (n=3 (all samples except normal tissues (n=4)) mean+/− stdev is reported (c) Tissue weight from Fig. 2h, normalized to mouse body weight. (n=3 (all samples except normal tissues (n=4)) mice/group); ***p=0.0006, *p=0.0119, n.s.- not significant; mean+/− stdev (left); calculated tumor weight (as in (a)) normalized to body weight (n=3-4 mice/group); *p<0.05, n.s.- not significant; mean+/− stdev (right). Comparisons between groups were made using a two-tailed Student’s t-test (a-c). (d) Weight of NU/J mice 4 weeks post-implantation of the indicated cancer cells (primary or liver met; tumor bearing mice) or sham injection (non-tumor bearing mice) into the pancreas (left) or liver (right) as indicated; n=4 (non-tumor bearing) or 3 (tumor bearing) mice/group; mean+/− stdev.
Extended Data Figure 7.
Extended Data Figure 7.. Characterization of pancreatic tumor transplants into the pancreas, liver, and lung.
(a) Weights of the indicated tissues harvested from mice where primary pancreatic cancer cells, or liver or lung metastatic pancreatic cancer cells were implanted into the pancreas (pancreatic tumor), liver (liver+tumor), or lung (lung+tumor). Tissue weight +/− stdev. n=3-5 mice. (b) Calculated tumor weight (pancreas, liver, and lung) and tumor weight (subcutaneous) corresponding to data shown in Fig. 2k; tumor weight is calculated as the difference in tissue weight between the tumor-bearing organ and normal age-matched tissue from a non-tumor bearing mouse. For pancreatic tumors, liver tumors, and lung tumors the normal tissue weight of the pancreas, the liver, or the lung was subtracted to determine the calculated tumor weight, despite the observation that the entire pancreas was transformed with no macroscopic evidence of normal tissue. Subcutaneous tumors (s.c.) represent actual tumor weight. mean+/− stdev; *p<0.05, *p<0.01, ***p< 0.001. n=3-5 mice. Comparisons between individual groups were made using a two-tailed Student’s t-test. Multiple comparisons were done using 2way ANOVA and corrected for multiple comparisons using the Tukey test; cell line effect (p=0.0256), location effect (p < 0.0001). (c) Macroscopic images of liver (left) or lung (right) four weeks post injection of cancer cells derived from a primary pancreatic tumor (primary >) or from a liver or lung metastasis (liver met > or lung met >, respectively) into the indicated organ. N- normal tissue; T- tumor; arrows indicate tumor nodules in the lung. Each macroscopic image is from one mouse. (d-f) Whole mount H&E-stained liver or lung tissue from mice where primary pancreatic cancer cells (d), liver (e), or lung (f) metastatic cancer cells were implanted into the indicated site. Scale bars are indicated in the figure panels; higher magnification images are shown for smaller tumors; tumors in the liver are indicated. Histological images are shown for each individual mouse (g) Macroscopic images of lung four weeks post tail vein injection of pancreatic liver metastasis-derived cells. (h) Weights of age-matched normal lung (n=2 mice) or weights of lungs with tumors (n=3 mice) from female mice described in (g). Mean +/− stdev (left); Tumor weight is calculated as the difference in tissue weight between the tumor-bearing lung and normal age-matched lung from a non-tumor bearing mouse. Mean +/− stdev (right). (i) Whole mount H&E-stained lung tissue from mice injected with pancreatic liver metastases via tail vein. Scale bar- 2 mm. Higher magnification is shown on the bottom; scale bar- 100 μM. Histological image is from each mouse and is an independently repeated experiment from an independently derived cell line to accompany data shown in Figure 2k and Extended Data Figure 7b.
Extended Data Figure 8.
Extended Data Figure 8.. Passaging pancreatic tumors in the lung or liver of mice selects for increased seeding of the metastatic tissue and analysis of primary liver and primary lung cancer cells.
(a) Macroscopic tissue images and histology assessing that tissue after each passage where cells from a lung metastasis (top) or liver metastasis (bottom) were serially implanted to from tumors in each organ. P1-P3 refers to each passage. Tumor areas indicated by boundary or arrows. (b) Quantification of lung metastases generated when parental (P0) or P3 lung metastatic pancreatic cancer cells were injected into the tail vein of wild type mice (left). Tumor area was calculated as the area of the tumor divided by the total area of tissue for all lung sections as assessed by H&E staining. Mean +/− stdev; n=3 mice/condition. (c) Quantification of the number of lung nodules generated when parental (P0) or P3 lung metastatic pancreatic cancer cells were implanted to form a tumor in the pancreas (right). Mean +/− stdev; n=3 (all conditions except P0 (n=4)) mice/condition. (d) Quantification of liver metastases generated when parental (P0) or P3 liver metastatic pancreatic cancer cells were injected into the liver. Tumor area was calculated as the area of the tumor divided by the total area of tissue for all liver sections as assessed by H&E staining; Mean +/− stdev; n=3 (P0) and n=4 (P3) mice. (e) Macroscopic images of liver (top) or lung and liver (bottom) after implantation of P3 liver metastatic pancreatic cancer cells (Liver Met P3 >) into the Liver (top) or the tail vein (bottom) as indicated. N- normal tissue; T- tumor; arrows indicate tumor nodules in the lung or liver. (f) Calculated tumor tissue weight (pancreas, liver, and lung) and tumor weight (subcutaneous) corresponding to data shown in Fig. 3b-e; tumor weight is calculated as the difference in tissue weight between the tumor-bearing organ and normal age-matched tissue from a non-tumor bearing mouse. Subcutaneous tumors represent actual tumor weight. For pancreatic tumors, liver tumors, and lung tumors the normal tissue weight of the pancreas, the liver, or the lung was subtracted to determine the calculated tumor weight, despite the observation that the entire pancreas was transformed with no macroscopic evidence of normal tissue. Mean+/− stdev; n=4 (pancreas; all cells except Lung Met P0 (n=5)), n=4 (liver), n=3 (lung, all cells except Liver Met P3 (n=4), n=3 (subcutaneous) mice/condition *p<0.05, **p<0.01, ***p<0.001; n.s.- not significant. Comparisons between groups were made using a two-tailed Student’s t-test (g) Calculated tumor weight corresponding to relevant data shown in Fig. 3b-d and Fig. 4a. Tumor weight is calculated as the difference in tissue weight between the tumor-bearing organ and normal age-matched tissue from a non-tumor bearing mouse. For pancreatic tumors, liver tumors, and lung tumors the normal tissue weight of the pancreas, the liver, or the lung was subtracted to determine the calculated tumor weight. Mean+/− stdev; n=3 mice/condition *p<0.05, **p<0.01, ***p<0.001; n.s.- not significant. Comparisons between groups were made using a two-tailed Student’s t-test. (h) Histology of tumor sections corresponding to intratracheal injection of indicated cancer cells into the lung that relate to data shown in Fig 4b. (i) Ultrasound guided injection (USGI) of primary lung cancer cells or pancreatic cancer lung metastases into the lung and quantification of tumor area. Each data point represents one mouse and n=3 (lung primary cells) and n=6 (pancreas primary cells) mice; mean +/− stdev (j) Representative histology of tumor sections that related to data shown in (c) showing single tumor nodule formation in the lung following UGSI. Scale bar is 2 mm. (k) Calculated tumor weight corresponding to data shown in Fig. 4c as well as data in fig. 3b-d. Tumor weight is calculated as the difference in tissue weight between the tumor-bearing organ and normal age-matched tissue from a non-tumor bearing mouse. For pancreatic tumors and liver tumors the normal tissue weight of the pancreas and the liver was subtracted to determine the calculated tumor weight. Mean+/− stdev; n=3 (liver primary, pancreas and liver) and n=4 (liver metastases, pancreas and liver) mice/condition *p<0.05. Comparisons between groups were made using a two-tailed Student’s t-test.
Extended Data Figure 9.
Extended Data Figure 9.. Histology images of primary lung and primary liver tumors and assessment of metabolite levels in tissues.
(a-b) H&E stained histology sections of tumors obtained from injection of primary lung cancer cells into either the lung (top) or liver (bottom) (a) or from injection of primary liver cancer cells (HCC) into the lung (top) or liver (bottom) (b). n=3 mice/condition; data accompany tumor area data shown in Fig. 4d-e. (c) Principal component analysis (PCA) plot showing the separation of metabolite levels measured in pooled in interstitial fluid form indicated organs or plasma from wild-type non-tumor bearing animals. (d) Proliferation rate of primary lung cancer cells (human A549 cells or mouse KP primary lung cancer cells) and cells from a KPC pancreatic cancer lung metastasis (lung met) in media formulated to mimic metabolite levels measured in lung interstitial fluid (lung media); average of n=3 biological replicates were used for A549 cells and pancreatic lung met cells and average of n=2 biological replicates were used for the lung primary cells; mean +/− stdev.
Extended Data Figure 10.
Extended Data Figure 10.. Analysis of metabolic gene expression from mouse and human tissues.
(a-c) Metabolic gene expression derived from scRNA-seq data that is another representation of the data presented in figure 4g-h. Data represented as entire cell populations and comparing primary pancreatic cancer (PDAC) and liver metastases (liver met) arising in the mouse KPC PDAC model (a); A cross correlation of metabolic gene expression between pairs of single cells are plotted ordered by either site (b), or barcode (c); within a given barcode, pairs of cells tend to have high correlations in their metabolic expression, whereas there are subsets of cells within sites that have different metabolic gene expression but these subsets of cells do not separate based on tissue site; i.e. a given barcode across has similar metabolic gene expression across metastatic sites. (d) PCA of a human RNA-seq dataset, comparing metabolic gene expression in primary pancreatic tumors (Primary PDAC; green), liver metastatic PDAC (yellow), hepatocellular carcinoma (HCC; purple), and healthy liver (blue) as indicated. (e) Average Pearson correlation comparing metabolic similarity between pancreatic liver metastases (Met PDAC; yellow data points) to primary tumors (Primary PDAC), hepatocellular carcinoma (HCC) or healthy liver. Liver metastatic PDAC with higher Pearson correlation to HCC and healthy liver contains a higher degree of hepatocyte contamination (circled yellow data points) in (d) and (e). The p-value was determined using paired two-tailed Student t-test comparing Primary PDAC to HCC for the Met PDAC tumors.
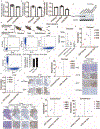
Fig. 1.
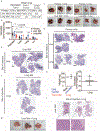
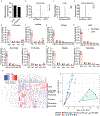
Fig. 1.. Primary and metastatic pancreatic tumors exhibit some similar metabolic phenotypes.
(a) The same cancer cells isolated from a primary pancreatic tumor arising in a KPC mouse were engineered to express either mCherry or GFP and combined in equal numbers prior to implantation into different tissue sites in mice. Flow cytometry confirming that approximately equal representation of each labeled cancer cell population is present in the mixed population. (b-d) Representation of mCherry and GFP labeled cells in tumors derived from injection of the mixed population shown in (a) into the pancreas (n=4) (b), liver (n=2) (c), or subcutaneous space (n=3) (d). (e-l) Paired pancreatic cancer cells derived from primary tumors or liver metastases arising in the KPC mouse model were implanted into the pancreas or liver, respectively, and the resulting tumor-bearing mice were infused for 6 hours with U-13C glucose at 0.4 mg/min to assess glucose fate in tumors growing in each site. Fractional labeling of the indicated metabolites as determined by GC-MS is shown. Data are from n=3-4 mice per group. Mean +/− stdev. (m-n) Relative metabolite levels in autochthonous paired primary pancreatic cancer and liver metastases arising in KPC mice were assessed by LC-MS; Tumors were harvested in the mornings at the same time of the day. Metabolite levels were also measured for normal pancreas and liver tissue from age-matched non-tumor bearing control mice. The metabolite data for each sample is clustered in two different ways: Unsupervised clustering represented as a heatmap (m) or K-means unsupervised clustering (n); 6 mice were used for the normal tissue analysis and 4 mice were used for the paired primary tumor and metastasis analysis.
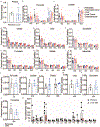
Fig. 2.
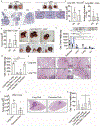
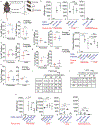
Fig. 2.. Pancreatic cancer cells derived from both the primary tumor and from metastatic sites generate tumors that grow fastest in the pancreas.
(a) Schematic depicting transplantation experiments to quantitatively assess pancreatic cancer cell proliferation in different tissue sites. (b) Equal numbers of cancer cells isolated from primary pancreatic tumors or paired liver metastases arising in the KPC mouse model were implanted into the pancreas, liver, or subcutaneous space, and resulting tumor size assessed after four weeks. Tissue site indicates the site where cells were implanted, and cells injected indicates whether the cells injected were derived from a primary tumor or liver metastasis (liver met). Relative weights of tumor and associated normal tissue compared with normal tissue of age-matched mice, or tumor weight in the subcutaneous flank, is shown. n=4 mice were used for the pancreas injection, n=3 mice were used for the liver and subcutaneous injections; n=5 mice were used for the normal tissue weights. Male mice were used for all the comparisons. Mean+/− stdev is shown. * p=0.0479; n.s. – not significant (c-d) The percent of cells that stain positive for Ki67 by immunohistochemistry was quantified in tissue sections from tumors arising from primary pancreatic cancer or liver metastatic cells implanted into the pancreas or liver as indicated (c) or implanted into the pancreas or lung as indicated (d). Data for c is from n=4 (pancreas) or n=3 (liver; primary cells) or n=5 (liver; liver met) mice is shown; Data for d is from n=3 (pancreas) or n=3 (lung) mice Ki67 percentage = number of positive stained cells in each image field divided by the total number of cells in the same field x 100. One representative field per tumor was analyzed; n.s.- not significant; mean +/− stdev is shown (e) The percent of cells stained positive for BrdU as assessed by immunohistochemistry was quantified in tissue sections from tumors arising from primary or metastatic cells in either the pancreas or the liver as indicated; each data point represents one region of a tumor obtained from n=2 (pancreas; primary cells), n=3 (pancreas; liver met), n=1 (liver, primary), n=2 (liver; liver met) mice per group; Quantification was determined by manually counting number of positive cells divided by the total number of cells in the same field x 100; * p =0.0109; mean +/− stdev is shown (f-g) The percent of cells that stain positive for cleaved caspase 3 by immunohistochemistry was quantified on tissue sections derived from tumors arising from either primary or metastatic cells in either the pancreas or liver (f) or in tumors arising from primary or metastatic cells in either the pancreas or the lung (g). Each data point indicates an average of three regions from each mouse (n=3 mice/group). Percent positivity was quantified by manually counting number of positive cells divided by the total number of cells in the same field x 100. n.s.- not significant; * p =0.0154 mean +/− stdev (h) Relative weights of tumors derived from equal numbers of cancer cells implanted into nude (NU/J) mice after four weeks and associated normal tissue weights from age-matched mice is shown. As in (b), tissue site indicates the site where cells were implanted, and cells injected indicates whether the cells injected were derived from a primary tumor or liver metastasis. n=4 (normal tissues), n=3 (cells injected in pancreas and liver) mice/group; both male and female mice were used. Mean +/− stdev is shown. *p=0.0150, ***p=0.0003, n.s.- not significant. (i-j) The indicated number of cancer cells derived from a primary pancreatic tumor (P), or liver metastases (M) were implanted into either the pancreas (i) or the liver (j), and animals followed to determine if a tumor formed as well as how long mice with tumors survived post-implantation; male mice were used for all the conditions. The number of mice with tumors is shown, with the total number of mice injected for each number of cells indicated in parentheses. These data were also used to calculate an approximate tumor initiating capacity (TIC) for primary- and metastasis-derived cells at each tissue site: Pancreas, primary (1/63.4), liver met (1/99.2), p-value = 0.531; Liver, primary (1/417), liver met (1/2005), p-value= 0.106. Statistical significance was determined using the ELDA: Extreme Limiting Dilution Analysis software (k) Equal numbers of cancer cells isolated from primary pancreatic tumors or paired liver or lung metastases arising in the KPC mouse model were implanted into the pancreas, liver, lung (via tail vein), or subcutaneous space, and resulting tumor size assessed after four weeks. As in (b), relative weights of tumor and associated normal tissue compared with normal tissue of age-matched mice, or tumor weight in the subcutaneous flank, is shown, and tissue site indicates the site where cells were implanted, and cells injected indicates whether the cells injected were derived from a primary tumor, liver, or lung metastasis. n=3 (all normal tissues), n=4 (pancreas; primary cells), n=4 (pancreas; liver met), n=5 (pancreas; lung met); n=3 (lung, liver, and subcutaneous tissue sites injected with cells) per group, Mean+/− stdev is shown. pancreas (**p=0.0045), liver (primary vs. normal liver- *p=0.0263; liver met vs. normal liver-*p=0.0383), lung (liver met vs. normal lung-****p<0.0001; lung met vs. normal lung- **p=0.0050). Comparisons between groups were made using a two-tailed Student’s t-test (b-h, and k).
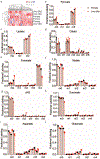
Fig. 3.
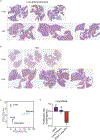
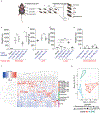
Fig. 3.. Pancreatic cancer cells retain metabolic phenotypes found in the primary tumor even when repeatedly passaged in a metastatic site.
(a) Schematic depicting propagation of lung and liver pancreatic cancer metastases arising in KPC mice by implantation into the lung or liver to form tumors three times prior to use in transplantation experiments to quantitatively assess proliferation and metabolic phenotypes in different tissue sites. (b-e) Equal numbers of cancer cells isolated from primary pancreatic tumors, paired liver, or lung metastases (P0), or liver or lung metastatic cancer cells that were passaged in the liver or lung as described in (a) (P3) were implanted into the pancreas, liver, lung (via tail vein), or subcutaneous space, and resulting tumor size assessed after 3 weeks. Relative weights of tumor and associated normal tissue compared with normal tissue of age-matched mice, or tumor weight in the subcutaneous flank, is shown. Tissue site indicates the site where cells were implanted, and cells injected indicates whether the cells injected were derived from a P0 or P3 liver or lung metastasis. Mean+/− stdev; n.s.- not significant, pancreas (**p=0.0070), lung (**p=0.00499, ****p<0.0001); n=3 (subcutaneous site), n=3 (lung site; all except Liver Met P3 (n=4)), n=5 (all normal tissues); n=4 (liver site), n=4 (pancreas site- all except Lung Met P0 (n=5)) mice per group. (f-g) Relative metabolite levels arising in tumors from primary, P0 and P3 lung metastases cells implanted in the pancreas were assessed by LC-MS. Metabolite levels were also measured for normal pancreas and lung tissue from age-matched wild-type mice. The metabolite data for each sample is clustered in two different ways: Unsupervised clustering represented as a heatmap (f) or K-means unsupervised clustering (g). Comparisons between groups were made using a two-tailed Student’s t-test (b-e).
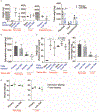
Fig. 4.
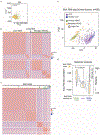
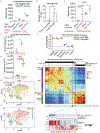
Fig. 4.. Tissue-of-origin influences the metabolism and tissue site preference for metastatic tumor growth.
(a) Equal numbers of lung adenocarcinoma cells derived from the LSL-KrasG12D/+; Trp53fl/fl; Ad-Cre mouse model were implanted into the pancreas or delivered to the lung and resulting tumor size assessed after four weeks. Relative weights of tumor and associated normal tissue compared with normal tissue from age-matched mice is shown. Mean+/− stdev; * p<0.05, **** p<0.0001; n=5 (normal tissues), n=3 (for both pancreas and lung sites) mice per group. (b) Equal number of cells derived from pancreatic lung metastasis (Lung Met) or from primary lung cancer described in (a) were introduced into the lung via intratracheal inhalation of the cancer cells; tumor burden in the lung is depicted as number of lung nodules in each section of 3 mice/group. Each data point represents one mouse. Mean +/− stdev; * p <0.05. (c) Equal numbers of RIL-176 hepatocellular carcinoma (HCC) cells were implanted into the pancreas or the liver and resulting tumor size assessed after four weeks. Relative weights of tumor and associated normal tissue compared with normal tissue from age-matched mice is shown. n=3 (liver primary cells; pancreas) and n=3 (liver primary cells; liver); n=5 (normal tissues) mice were used. Mean+/− stdev; * p<0.05. Comparisons between groups were made using a two-tailed Student’s t-test. (d) Equal numbers of primary lung cancer cells described in (a) were implanted into the liver or delivered to the lung via tail vein injection and tumor area determined via analysis of histological sections after 4 weeks. Each data point represents one mouse and 3 mice were used per tissue site. Mean +/− stdev. **p <0.005. Comparisons between groups were made using a two-tailed Student’s t-test (a-d). (e) Equal numbers of primary HCC cells described in (c) were implanted into the liver or delivered to the lung via tail vein injection and tumor area in each site was quantified as in (d) after 4 weeks; 3 mice were used per tissue site (f) Proliferation rate of primary pancreatic, liver, or lung metastatic cells in either standard cell culture media (DMEM, RPMI) or in media formulated to match the metabolite concentrations measured in normal mouse plasma or in mouse tissue (pancreas, liver, or lung) interstitial fluid. Representative data from 3 biological replicates from at least n=2 independent experiments per line per condition is shown. mean +/− stdev. (g-h) UMAP plot comparing metabolic gene expression in single cells from primary PDAC, lung metastases (lung met), and liver metastases (liver met) from the KPC model (g); and the UMAP plot of metabolic gene expression analysis in (g) with each clonal populations represented; these clones are arbitrarily labeled as clones 1-6 and are do not match clone numbers in the original publication (h). (i) Cross correlation of bulk metabolic gene expression profiles involving 3,240 genes from 620 samples with gene expression obtained from either hepatocellular carcinoma (HCC) TCGA, PDAC (Panc-seq), or PDAC TCGA data (top). Ranked metastatic samples with high degree of hepatocyte contamination as assessed by higher gene expression of hepatocyte markers and lower gene expression of ductal markers is shown on the bottom with corresponding correlation to normal liver.

References

    1. Yang D. et al. Lineage Recording Reveals the Phylodynamics, Plasticity and Paths of Tumor Evolution. bioRxiv 13, 2021.10.12.464111 (2021).
    1. Celià-Terrassa T & Kang Y Distinctive properties of metastasis-initiating cells. Genes Dev. 30, 892 (2016). - PMC - PubMed
    1. Boutin AT et al. Oncogenic Kras drives invasion and maintains metastases in colorectal cancer. Genes Dev. 31, (2017). - PMC - PubMed
    1. Makohon-Moore AP et al. Limited heterogeneity of known driver gene mutations among the metastases of individual patients with pancreatic cancer. Nat. Genet 49, 358–366 (2017). - PMC - PubMed
    1. Muir A & Vander Heiden MG The nutrient environment affects therapy. Science (80-. ). 360, 962–963 (2018). - PMC - PubMed

LinkOut - more resources