Multicenter Study
. 2024 Aug 19;17(1):70.
doi: 10.1186/s13045-024-01590-1.

Genomic characterization of AML with aberrations of chromosome 7: a multinational cohort of 519 patients

Affiliations
Multicenter Study

Genomic characterization of AML with aberrations of chromosome 7: a multinational cohort of 519 patients

Adriane Halik et al. J Hematol Oncol. .

Abstract

Background: Deletions and partial losses of chromosome 7 (chr7) are frequent in acute myeloid leukemia (AML) and are linked to dismal outcome. However, the genomic landscape and prognostic impact of concomitant genetic aberrations remain incompletely understood.

Methods: To discover genetic lesions in adult AML patients with aberrations of chromosome 7 [abn(7)], 60 paired diagnostic/remission samples were investigated by whole-exome sequencing in the exploration cohort. Subsequently, a gene panel including 66 genes and a SNP backbone for copy-number variation detection was designed and applied to the remaining samples of the validation cohort. In total, 519 patients were investigated, of which 415 received intensive induction treatment, typically containing a combination of cytarabine and anthracyclines.

Results: In the exploration cohort, the most frequently mutated gene was TP53 (33%), followed by epigenetic regulators (DNMT3A, KMT2C, IDH2) and signaling genes (NRAS, PTPN11). Thirty percent of 519 patients harbored ≥ 1 mutation in genes located in commonly deleted regions of chr7-most frequently affecting KMT2C (16%) and EZH2 (10%). KMT2C mutations were often subclonal and enriched in patients with del(7q), de novo or core-binding factor AML (45%). Cancer cell fraction analysis and reconstruction of mutation acquisition identified TP53 mutations as mainly disease-initiating events, while del(7q) or -7 appeared as subclonal events in one-third of cases. Multivariable analysis identified five genetic lesions with significant prognostic impact in intensively treated AML patients with abn(7). Mutations in TP53 and PTPN11 (11%) showed the strongest association with worse overall survival (OS, TP53: hazard ratio [HR], 2.53 [95% CI 1.66-3.86]; P < 0.001; PTPN11: HR, 2.24 [95% CI 1.56-3.22]; P < 0.001) and relapse-free survival (RFS, TP53: HR, 2.3 [95% CI 1.25-4.26]; P = 0.008; PTPN11: HR, 2.32 [95% CI 1.33-4.04]; P = 0.003). By contrast, IDH2-mutated patients (9%) displayed prolonged OS (HR, 0.51 [95% CI 0.30-0.88]; P = 0.0015) and durable responses (RFS: HR, 0.5 [95% CI 0.26-0.96]; P = 0.036).

Conclusion: This work unraveled formerly underestimated genetic lesions and provides a comprehensive overview of the spectrum of recurrent gene mutations and their clinical relevance in AML with abn(7). KMT2C mutations are among the most frequent gene mutations in this heterogeneous AML subgroup and warrant further functional investigation.

Keywords: IDH2; KMT2C; PTPN11; TP53; AML; Complex karyotype; Monosomy 7; del(7q).


Conflict of interest statement

F.D. reports personal fees from AbbVie, Amgen, Astra Zeneca, BeiGene, Gilead, Incyte, Novartis, and Roche outside the submitted work. L.B. reports advisory roles for Abbvie, Amgen, Astellas, Bristol-Myers Squibb, Celgene, Daiichi Sankyo, Gilead, Hexal, Janssen, Jazz Pharmaceuticals, Menarini, Novartis, Pfizer, Sanofi, Servier; as well as research funding from Bayer, Jazz Pharmaceuticals. A.H. reports travel fees outside of the submitted work from Jazz Pharmaceuticals. M.T. and P.S. declare no COI related to this work. E.J. reports current employment at AstraZeneca. H.D. declares consultancy with honoraria from AbbVie, AstraZeneca, Gilead, Janssen, Jazz, Pfizer, Servier, Stemline, Syndax and Clinical Research funding to the Institution from AbbVie, Astellas, Bristol Myers Squibb, Celgene, Jazz Pharmaceuticals, Kronos Bio and Servier. J.E. reports participation in Advisory Boards of Abbvie, Novartis, Astellas, Jazz Pharmaceuticals, BMS-Celgene, Pfizer, Amgen and Research grants from Novartis and Jazz Pharmaceuticals. J.K. reports personal fees from BMS/Celgene, Takeda, Janssen, Abbvie, Sanofi, Pfizer and Jazz Pharmaceuticals outside the submitted work. M.H. reports research funding to institution from Abbvie, Servier, Astellas, BergenBio, Glycostem, Jazz Pharmaceuticals, Karyopharm, Loxo Oncology, Novartis, PinotBio, honoraria by Abbvie, Bristol Myers Squibb, Janssen, Jazz Pharmaceuticals, Pfizer, Qiagen, Servier, Sobi, and consultancy fees by AvenCell, Abbvie, Astellas, Glycostem, Janssen, LabDelbert, Miltenyi, Novartis, Pfizer, PinotBio and Servier.

Figures

Fig. 1
Fig. 1
Classification of the abn(7) cohort according to cytogenetic characteristics. Depiction of the classification of abn(7) patients into different groups according to the karyotype information available (n = 519). The first level separates a group of abn(7) samples with complex karyotype (CK) from the non-CK cases. A second division separates non-CK cases and CK cases according to the presence of monosomy 7 (−7/non-CK or −7/CK) or the presence of a del(7q) [del(7q)/non-CK or del(7q)/CK]. A group of samples not fitting these definitions was not included (other/non-CK, n = 10 or other/CK, n = 19). A third division separates samples by the presence or absence of another cytogenetic alteration in addition to the abnormality detected in abn(7)/non-CK. Samples with an accompanying alteration (non-complex karyotype non-sole, non-CKns) and samples with only a chr7 aberration (sole)
Fig. 2
Fig. 2
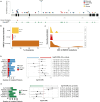
Mutations and SBS signatures found by WES and Targeted Sequencing in the abn(7) exploration and extension cohorts. A Bar graph showing the frequency of mutations identified by WES in patients (n = 60) per gene for genes mutated in ≥ 2 patients. Bars colored dark blue signify genes of particular importance due to high mutation frequency or previously underestimated prevalence in AML. The fraction of mutated patients per gene is shown above each bar (%). B The graph shows the mutational profile extracted from WES, which represents the two main signatures of most samples from the exploration cohort. Sig-A had high cosine similarities to the signatures reconstituted from the components that expectation maximization extracted SBS1/SBS5 in COSMIC (0.939) and SBS1/SBSblood in normal blood cells (0.945)[34, 35]. The bars represent the relative contributions of clustered genome-wide substitutions (SBS, y-axis) for each 96 trinucleotide sequences (x-axis) and distributed across the six possible cytosine or thymine bases substitutions. C Oncoplot showing mutations found in 43 of the 64 genes included in the TS gene panel in 452 patients of the extension cohort (n = 467 patients). According to baseline karyotype information, patients were segregated into two major groups: abn(7)/non-complex karyotype (non-CK, grey) or abn(7)/complex karyotype (CK, red). The marks on the top rows correspond to patients classified by cytogenetic information into having −7 (dark blue) or del(7q) (yellow). FLT3 includes all FLT3 alterations. *In the TS panel, only exons 28–38 of NF1 were investigated. The left bar plot shows the frequency (%) of mutated patients per gene. On the right side, a boxplot shows the statistical difference between the number of mutations found for these groups, median 4 versus 2 respectively for abn(7)/non-CK versus abn(7)/CK (two-tailed t test, n = 467, ****P < 0.0001)
Fig. 3
Fig. 3
Frequent low allele-burden mutations in KMT2C in AML with abn(7). A Lollipop plot depicts the localization and frequency of each KMT2C variant (n = 98, in 78/467 patients, from KMT2C refSeq NM_170606.3). Distribution in the context of Pfam domains was adapted from MutationMapper from cbioportal [64, 65] with information on the overlap of mutations to a statistically significant hotspot in cancer [66] or to reports of functional effects in the oncology knowledge base OncoKB™ [67, 68]. Color codes were used to distinguish types of observed mutations: 72 missense (blue), 16 truncating (red), 4 inframe (yellow), and 6 alterations affecting splice sites (light blue). B Frequency distribution of genomic events affecting the KMT2C locus: SNVs and CNVs lead to a multi-hit classification of 47 KMT2C-mutated patients from the extension cohort (n = 342) into groups according to genomic events present in the locus (1mut, > 1mut and mut + del). C Distribution of the VAF values of KMT2C mutations found for patients in the KMT2C multi-hit groups with at least one mutation present (n = 47). D, E The Odds ratio plot shows a multivariable binomial logistic regression fitted for the (D) ten genes with a P < 0.1 in univariate analysis (Figure S4A) and for (E) the six genes with a P < 0.1 in univariate analysis (Figure S4B). To the left, a bar plot diagram depicts the number of mutated patients: for each of the ten genes included in the multivariate model color-coded by (D) type of AML (de novo AML, blue; sAML, red) and (E) for each of the six genes included in the multivariate model color-coded by abn(7) group [−7, green; del(7q), grey]. To the right, logOR with confidence intervals of 95%, CI, and P values are shown
Fig. 4
Fig. 4
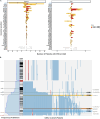
Positions and proportions of CNVs detected by TS. A Barplot illustrates the distribution of all 1376 manually curated CNVs derived from TS in the extension cohort (n = 342). Chromosomal CNVs spanning one arm or a whole chromosome are depicted on the left of each x-axis, while focal SNVs are shown to the right of the x-axis (according to arrows). The number of patients with a specific aberration is depicted according to the size of the event (yellow: large CNVs > 10 Mb; red: small CNVs ≤ 10 Mb). Chromosome 7 is displayed in blue. B To the right, genomic positions of chr7 covered by CNVs (deletions in blue, gains in red) identified in 188 AML patients (x-axis, excluding 154 cases with monosomy 7). Marked commonly deleted regions (CDRs)1–4 are adapted from Baeten et al. [16]. Potential genes of interest and their genomic positions are shown to the right. To the left, the frequency of deletions across the chromosome and recurrent breakpoint clusters, with the respective number of times a specific breakpoint occurred as a starting (black) or ending point of a CNV segment (red), are shown
Fig. 5
Fig. 5
Clonal hierarchies of events in patients with aberrations in chromosome 7. A Clonality analysis of SNV and CNV events derived from the CCFs calculated using ASCAT [69] and CNACS [47] data in the exploration cohort (n = 60 paired diagnosis/remission samples). x/xLOH represents a chromosome or arm level CNV, and del(xp) or del(xq) represents the deletion of any part of the respective p or q arm. B Plot shows SNV acquisition order resulting from a Bradley–Terry model applied to mutation pairs, using the CCF calculated by correction of sample purity, ploidy, and CNV/cnLOH presence determined in pureCN (depicted on the left) in n = 342 patients. The number of mutations that entered the model is reported for each gene. To the right, the points correspond to point estimations, and the bars represent the 95% confidence intervals. Early mutations have high estimations, thus their points are arranged on the left. The median point estimation value is taken as a reference point for early versus late distinctions (grey arrow). Genes are color-coded by their assumed functional category
Fig. 6
Fig. 6
Survival analysis according to the major abn(7) groups. Kaplan–Meier Curves showing the probability of A RFS for n = 230 and B OS for n = 389 intensively treated patients with available clinical data comparing the four major abn(7) groups: −7/CK versus del(7q)/CK versus −7/non-CK versus del(7q)/non-CK. Patients classified as "other/non-CK" or "other/CK" are not included (n = 25). P values derived from pairwise LogRank Test, *ns = not significant

References

    1. Dohner H, Weisdorf DJ, Bloomfield CD. Acute myeloid leukemia. N Engl J Med. 2015;373(12):1136–52. 10.1056/NEJMra1406184 - DOI - PubMed
    1. Papaemmanuil E, Gerstung M, Bullinger L, Gaidzik VI, Paschka P, Roberts ND, et al. Genomic classification and prognosis in acute myeloid leukemia. N Engl J Med. 2016;374(23):2209–21. 10.1056/NEJMoa1516192 - DOI - PMC - PubMed
    1. Döhner H, Wei AH, Appelbaum FR, Craddock C, DiNardo CD, Dombret H, et al. Diagnosis and management of AML in adults: 2022 recommendations from an international expert panel on behalf of the ELN. Blood. 2022;140(12):1345–77. 10.1182/blood.2022016867 - DOI - PubMed
    1. Schiffer CA, Lee EJ, Tomiyasu T, Wiernik PH, Testa JR. Prognostic impact of cytogenetic abnormalities in patients with de novo acute nonlymphocytic leukemia. Blood. 1989;73(1):263–70. 10.1182/blood.V73.1.263.263 - DOI - PubMed
    1. Scherer SW, Cheung J, MacDonald JR, Osborne LR, Nakabayashi K, Herbrick JA, et al. Human chromosome 7: DNA sequence and biology. Science. 2003;300(5620):767–72. 10.1126/science.1083423 - DOI - PMC - PubMed

Publication types

MeSH terms

Substances