. 2024 Aug 19;16(1):103.
doi: 10.1186/s13073-024-01376-7.

Evolutionary dependency of cancer mutations in gene pairs inferred by nonsynonymous-synonymous mutation ratios

Affiliations

Evolutionary dependency of cancer mutations in gene pairs inferred by nonsynonymous-synonymous mutation ratios

Dong-Jin Han et al. Genome Med. .

Abstract

Background: Determining the impact of somatic mutations requires understanding the functional relationship of genes acquiring mutations; however, it is largely unknown how mutations in functionally related genes influence each other.

Methods: We employed non-synonymous-to-synonymous or dNdS ratios to evaluate the evolutionary dependency (ED) of gene pairs, assuming a mutation in one gene of a gene pair can affect the evolutionary fitness of mutations in its partner genes as mutation context. We employed PanCancer- and tumor type-specific mutational profiles to infer the ED of gene pairs and evaluated their biological relevance with respect to gene dependency and drug sensitivity.

Results: We propose that dNdS ratios of gene pairs and their derived cdNS (context-dependent dNdS) scores as measure of ED distinguishing gene pairs either as synergistic (SYN) or antagonistic (ANT). Mutation contexts can induce substantial changes in the evolutionary fitness of mutations in the paired genes, e.g., IDH1 and IDH2 mutation contexts lead to substantial increase and decrease of dNdS ratios of ATRX indels and IDH1 missense mutations corresponding to SYN and ANT relationship with positive and negative cdNS scores, respectively. The impact of gene silencing or knock-outs on cell viability (genetic dependencies) often depends on ED, suggesting that ED can guide the selection of candidates for synthetic lethality such as TCF7L2-KRAS mutations. Using cell line-based drug sensitivity data, the effects of targeted agents on cell lines are often associated with mutations of genes exhibiting ED with the target genes, informing drug sensitizing or resistant mutations for targeted inhibitors, e.g., PRSS1 and CTCF mutations as resistant mutations to EGFR and BRAF inhibitors for lung adenocarcinomas and melanomas, respectively.

Conclusions: We propose that the ED of gene pairs evaluated by dNdS ratios can advance our understanding of the functional relationship of genes with potential biological and clinical implications.

Keywords: Cancer mutations; Drug sensitivity; Evolutionary dependency; Gene pairs; Genetic dependency; Mutation contexts; dNdS ratios.


Conflict of interest statement

The authors declare that they have no competing interests.

Figures

Fig. 1
Fig. 1
Schematics of dNdS ratio-based evolutionary dependency (ED) for mutation pairs. a Examples of synergistic (SYN) and antagonistic (ANT) gene pairs are shown for their presentations of mutations (depicted as the relationship between gene A and B). Two dNdS ratios (dNdS, context + and dNdS, context −) are calculated for gene B mutations in the presence and absence of mutation contexts (gene A mutations considered as mutation contexts). b Two dN/dS ratios are shown for known gene pairs with segregating gene pairs reflecting the types of functional relationship (red and blue for gene pairs representing co-occurrences (CO) and mutual exclusivity (ME), respectively). Three types of dN/dS ratios from missense, truncating, and indel mutations are shown separately, for those with significant ED (61 missense, 47 truncating mutations, and 41 indels, P < 0.01, permutation tests). c Summarized log2 odds of dN/dS ratios are calculated as cdNS (context-dependent dNdS ratios) scores and shown for missense, truncating mutations and indels. d cdNS scores of known gene pairs are compared with those obtained from independent MSK-IMPACT mutational profiles (TCGA and MSK-IMPACT, x- and y-axis, respectively)
Fig. 2
Fig. 2
PanCancer gene pairs under ED. a A total of 85 gene pairs identified in PanCancer mutational profiles are displayed for their dNdS ratios. The x-axis represents the dNdS ratios with mutation contexts (context +), while the y-axis represents the dNdS ratios without mutation contexts (context −). Blue and red dots denote missense and indel gene pairs, respectively. b cdNS scores of 85 gene pairs are shown in order of the cdNS scores. Blue and red lines represent the missense and indel gene pairs, respectively. c–f The dNdS ratios in the presence and absence of mutation contexts are separately illustrated in scatter plots for KRAS, TP53, PTEN, and IDH1 mutations. The y-axis represents the dNdS ratios with mutation contexts, while the x-axis represents the dNdS ratios without mutation contexts. Blue and red dots indicate missense and indel pairs, respectively
Fig. 3
Fig. 3
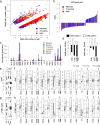
Tumor type-specific gene pairs under ED. a,b A total of 3870 mutation pairs gene pairs exhibiting tumor type-specific ED are depicted, showcasing their dNdS ratios and cdNS scores. c The prevalence of tumor type-specific gene pairs are shown across the examined tumor types. Colors represent the ED types (SYN and ANT) and mutation types (missense, truncating mutations, and indels). d For recurrent gene pairs of EPHA2-ATM and EP300-ATM, dNdS ratios are shown in tumor types where the gene pairs were observed. Shaded and unshaded boxes represent the dNdS ratios with or without mutation contexts, respectively. e Differences in variant allele frequency (VAF) are illustrated for SYN and ANT gene pairs as measured in PanCancer datasets. f VAF differences of gene pairs as estimated in the corresponding tumor types are shown separately across the tumor types. *, **, *** represent P < 0.05, P < 0.01, and P < 0.001, respectively. g Differences in tumor mutation burden (TMB) are presented in a boxplot (log10 scale). h TMB differences are shown across tumor types examined. Asterisks indicates the level of statistical significance
Fig. 4
Fig. 4
ED and genetic dependencies. a Effect sizes and dN/dS ratios for individual mutation pairs gene pairs are displayed across three databases of genetic dependencies (AVANA, DEMETER2, and DRIVE), with the y- and x-axis representing the mutation pairs and their respective dNdS ratios, respectively. The level of correlation and statistical significance by t-test is indicated. b Thirty eight mutation pairs gene pairs occurring more than once across databases are selected, and their effect sizes and dNdS ratios are presented. Four mutational categories are shown for rescuing and compromising effects (effect size > 0 and < 0, respectively) and synergistic and redundant/antagonistic effects (cdNS scores > 0 and < 0, respectively). c Boxplots depict pathway concordances for the four categories of mutation pairs. d The mutations in pairs are analyzed to determine whether they are oncogenes (OG) or tumor suppressor genes (TSG), and the abundance across the four categories of mutation pairs gene pairs is shown. e–h For selected examples of KRAS*-NRAS, BRAF*-KRAS, KRAS*-BRAF, and TCF7L2*-KRAS mutation pairs (where asterisk indicates the genes with knockouts), the cell viability of selected cancer cell lines with respect to their mutational states of gene members in the pairs are shown. Cell viability was used as available in AVANA database. Asterisks indicate knock-out genes with gene silencing. The dNdS ratios of mutations in genomes with or without the mutation contexts are also shown in barplots
Fig. 5
Fig. 5
ED with pharmacological impact. a cdNS scores of gene pairs containing EGFR as gene members, as estimated in lung adenocarcinoma (LUAD) mutational profiles. Blue, orange, and red denote partner genes harboring significant ED for missense, truncating mutations, and indels, respectively, with corresponding mutation contexts. Two arrows indicate pairs of EGFR and KRAS mutations as significant ANT gene partners. b IC50 levels across six EGFR inhibitors are displayed for four types of LUAD cell lines based on the mutational states of EGFR and KRAS (mt and wt representing mutant and wild types, respectively). Drug names and significance levels estimated between EGFRmt/KRASwt (blue) and EGFRmt/KRASmt (orange) by t-test are illustrated. The number of cell lines is also indicated. IC50 values of celllines with EGFRwt/KRASwt (grey) and EGFRwt/KRASmt (black) are separately shown. c The cdNS scores are shown for BRAF-harboring gene pairs identified in melanoma (SKCM) mutational profiles. Arrows indicate ANT relationship between the BRAF mutations and NRAS mutations. d IC50 values with BRAF inhibitors are shown for SKCM cell lines with respect to the mutational status of BRAF and NRAS mutations. e The effect size (the differential of IC50 values of cell lines between those with or without the mutations paired with mutation contexts) is shown against cdNS scores of mutation pairs (y- and x-axis, respectively). Red and blue dots represent the effect size as estimated from GDSC and CCLE database. Pairs of two databases were linked by arrows for selected mutation pairs. f,g IC50 values are similarly shown for mutation pairs of PRSS1-EGFR and CTCF-BRAF for LUAD and SKCM celllines, respectively

References

    1. Bailey MH, Tokheim C, Porta-Pardo E, Sengupta S, Bertrand D, Weerasinghe A, Colaprico A, Wendl MC, Kim J, Reardon B, et al. Comprehensive characterization of cancer driver genes and mutations. Cell. 2018;173(371–385): e318. - PMC - PubMed
    1. Stratton MR, Campbell PJ, Futreal PA. The cancer genome. Nature. 2009;458:719–24. 10.1038/nature07943 - DOI - PMC - PubMed
    1. Martinez-Jimenez F, Muinos F, Sentis I, Deu-Pons J, Reyes-Salazar I, Arnedo-Pac C, Mularoni L, Pich O, Bonet J, Kranas H, et al. A compendium of mutational cancer driver genes. Nat Rev Cancer. 2020;20:555–72. 10.1038/s41568-020-0290-x - DOI - PubMed
    1. Dees ND, Zhang Q, Kandoth C, Wendl MC, Schierding W, Koboldt DC, Mooney TB, Callaway MB, Dooling D, Mardis ER, et al. MuSiC: identifying mutational significance in cancer genomes. Genome Res. 2012;22:1589–98. 10.1101/gr.134635.111 - DOI - PMC - PubMed
    1. Lawrence MS, Stojanov P, Polak P, Kryukov GV, Cibulskis K, Sivachenko A, Carter SL, Stewart C, Mermel CH, Roberts SA, et al. Mutational heterogeneity in cancer and the search for new cancer-associated genes. Nature. 2013;499:214–8. 10.1038/nature12213 - DOI - PMC - PubMed

LinkOut - more resources