. 2024 Aug 19;12(1):153.
doi: 10.1186/s40168-024-01870-5.

Defining Vaginal Community Dynamics: daily microbiome transitions, the role of menstruation, bacteriophages, and bacterial genes

Affiliations

Defining Vaginal Community Dynamics: daily microbiome transitions, the role of menstruation, bacteriophages, and bacterial genes

Luisa W Hugerth et al. Microbiome. .

Abstract

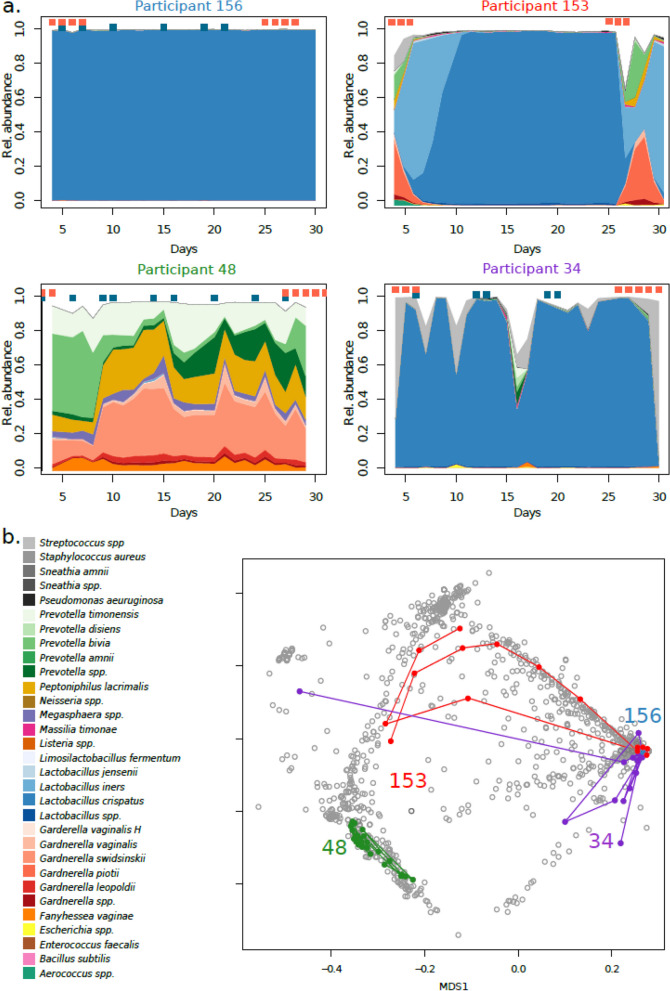
Background: The composition of the vaginal microbiota during the menstrual cycle is dynamic, with some women remaining eu- or dysbiotic and others transitioning between these states. What defines these dynamics, and whether these differences are microbiome-intrinsic or mostly driven by the host is unknown. To address this, we characterized 49 healthy, young women by metagenomic sequencing of daily vaginal swabs during a menstrual cycle. We classified the dynamics of the vaginal microbiome and assessed the impact of host behavior as well as microbiome differences at the species, strain, gene, and phage levels.

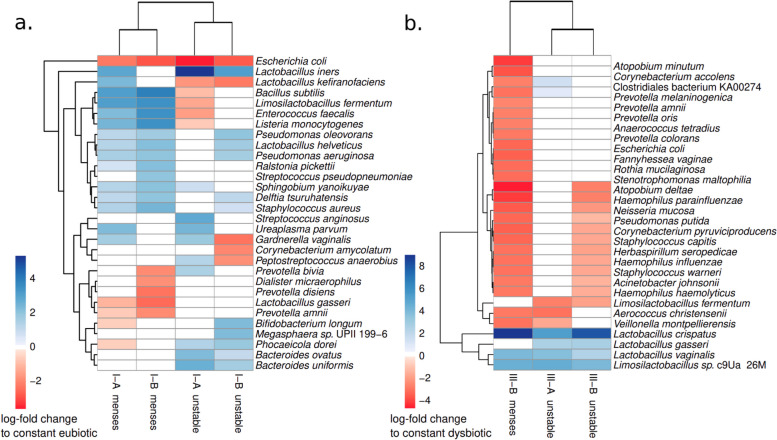
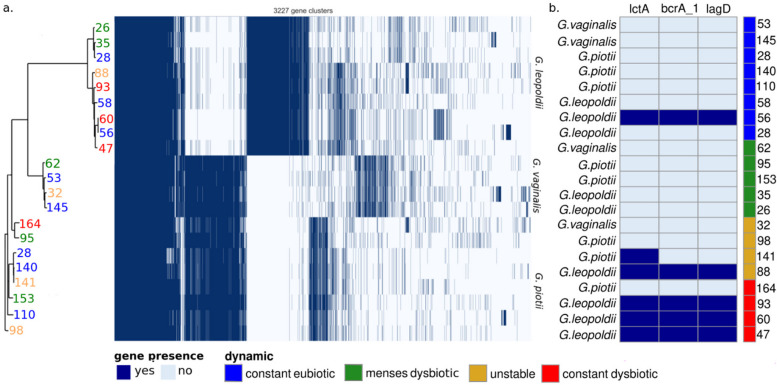
Results: Based on the daily shifts in community state types (CSTs) during a menstrual cycle, the vaginal microbiome was classified into four Vaginal Community Dynamics (VCDs) and reported in a classification tool, named VALODY: constant eubiotic, constant dysbiotic, menses-related, and unstable dysbiotic. The abundance of bacteria, phages, and bacterial gene content was compared between the four VCDs. Women with different VCDs showed significant differences in relative phage abundance and bacterial composition even when assigned to the same CST. Women with unstable VCDs had higher phage counts and were more likely dominated by L. iners. Their Gardnerella spp. strains were also more likely to harbor bacteriocin-coding genes.

Conclusions: The VCDs present a novel time series classification that highlights the complexity of varying degrees of vaginal dysbiosis. Knowing the differences in phage gene abundances and the genomic strains present allows a deeper understanding of the initiation and maintenance of permanent dysbiosis. Applying the VCDs to further characterize the different types of microbiome dynamics qualifies the investigation of disease and enables comparisons at individual and population levels. Based on our data, to be able to classify a dysbiotic sample into the accurate VCD, clinicians would need two to three mid-cycle samples and two samples during menses. In the future, it will be important to address whether transient VCDs pose a similar risk profile to persistent dysbiosis with similar clinical outcomes. This framework may aid interdisciplinary translational teams in deciphering the role of the vaginal microbiome in women's health and reproduction. Video Abstract.

Keywords: Daily variations; Dysbiosis; Menstrual cycle; Reproductive health; Vaginal microbiome.


Conflict of interest statement

The Centre for Translational Microbiome Research is partly funded by Ferring Pharmaceuticals (LWH, EF, JD, LE, IS-K). An unrestricted research grant from Ferring Pharmaceuticals enabled the clinical infrastructure and sampling (MCK, ZB and HSN). The funder was not involved in the study design, collection, analysis, interpretation of data, the writing of this article or the decision to submit it for publication.

Figures

Fig. 1
Fig. 1
The vaginal microbiota can be remarkably stable over 6 weeks, but also experience both cyclical and rapid shifts. Area plots represent bacterial composition inferred from 16S rRNA gene amplicons, with relative abundance on the Y-axis and days on the X-axis. Red dots above the area chart represent days with menstrual bleeding or spotting, and the blue dots represent days with vaginal intercourse. The black line above each profile shows their alpha diversity (inverse Simpson’s index)
Fig. 2
Fig. 2
Vaginal samples are dominated by either Lactobacillus spp., Gardnerella spp., or Prevotella spp., and can rapidly or cyclically switch between types. a Four representative individuals’ vaginal microbiomes are shown during a menstrual cycle, starting from cycle day 4. Women can be stably high Lactobacillus spp., stably Lactobacillus spp. depleted, high Lactobacillus spp. except during their menses or high Lactobacillus spp. but with relative abundances falling as a response to unprotected sexual intercourse. b a non-metric multidimensional scaling based on Bray–Curtis dissimilarity of all shotgun metagenomics samples in this study. The same individuals are highlighted, showing their trajectory during the follow-up
Fig. 3
Fig. 3
Contraceptive usage and intercourse frequency affect relative abundance of bacteria, while days with menses affect the influx of new bacteria. a Women not using hormonal contraceptives had higher total beta-diversity over the sampling period than women on combined oral contraceptives or with an IUS. b Pearson’s correlations between life events (bleedings, intercourses) and total beta-diversity, Aitchinson’s or Jaccard’s, per participant in different groups. c Number of days with unprotected sexual intercourse was positively correlated to total Aitchinson’s distance. Dark blue dots: women with unprotected sexual intercourse. Light blue dots: women with sexual intercourse with condoms. d The number of days with menstrual bleeding was directly correlated to total Jaccard dissimilarity. Dark red dots: women not using hormonal contraceptives or on combined oral contraceptives. Light red dots: women with an IUS, with typically very light bleeding
Fig. 4
Fig. 4
Vaginal time-series can be classified into four categories (Vaginal Community Dynamics) according to their proportion of eubiotic samples. a A decision tree can separate a time-series of samples into dynamic groups, based on the community state types. Input from the user is which CST are considered eubiotic (here: I, II, and V) and which days are to be considered free from the influence of menses (here: cycle day 9 to cycle day 25). Time-series with >  = 80% eubiotic samples are considered constant eubiotic; conversely, those with > 80% dysbiotic samples are considered constant dysbiotic. For those in the 20–80% range, a second assessment is done on the days free of menses: if they are > 80% eubiotic, the time-series is considered menses-related dysbiotic, and otherwise unstable (changing from eubiosis to dysbiosis without a clear temporal pattern). b A color map with one individual per row and one day per column. The color of each intersection depicts CST. Colored bars on the left side show the vaginal community dynamics of each woman. c Additional color bars show the inferred vaginal community dynamics of each participant when using fewer samples for classification
Fig. 5
Fig. 5
Samples belonging to the same CST, but deriving from different dynamic groups, have changes in the relative abundance of several bacterial species. a Samples in CST-IA and CST-IB from menses-related dysbiotic or unstable individuals were compared to those from stable eubiotic individuals. b Samples in CST-IIIA and CST-IIIB from menses-related dysbiotic or unstable individuals were compared to those from stable dysbiotic individuals. In each panel, the heatmap shows the log-fold change of the top 30 most extreme differences. White fields represent no significant change
Fig. 6
Fig. 6
While strains do not segregate by vaginal community dynamics, bacteriocins are associated with instability. a Phylogenomic analysis of all detected Gardnerella species did not find a correlation between the individuals’ vaginal community dynamics and the observed phylogeny. Each row represents a genome and each column is a gene cluster. b Three bacteriocins from G. leopoldii were over-represented in unstable and dysbiotic samples. The presence of a gene is represented in dark blue and its absence in light blue. Participants are colored after their VCD. Blue: women who are constantly eubiotic. Red: women who are constantly dysbiotic. Yellow: women with unstable VCD. Green: women who are menses-related dysbiotic
Fig. 7
Fig. 7
Phage profiles follow roughly the bacterial profiles but can fall below the detection limit in samples of lower coverage. Two representative individuals’ vaginal bacteriomes and phageomes are shown during a menstrual cycle, starting from cycle day 4. The red dots above the area chart represent days with menstrual bleeding or spotting, and the blue dots represent days with vaginal intercourse. The black line overlapped with the phage profiles represents the ratio between phage reads and bacterial reads. Days with missing data are omitted
Fig. 8
Fig. 8
Relative abundance of phages is connected to CST and vaginal community dynamics. The Y-axis in each plot represents log10 of the ratio between phage reads and bacterial reads. The X-axis represents the VCDs and the top indicates the CSTs. Each open circle is a sample, open diamonds are medians. Results that are significant in Welch’s test are framed in blue, with dark blue marking those that are also significant when adjusting for participant ID. For these only, the results significant on a post-hoc test are marked with stars. *p < 0.05; **p < 0.01; ***p < 0.001

References

    1. Wu S, Hugerth LW, Schuppe-Koistinen I, Du J. The right bug in the right place: opportunities for bacterial vaginosis treatment. NPJ Biofilms Microbiomes. 2022;8:34. 10.1038/s41522-022-00295-y - DOI - PMC - PubMed
    1. Gajer P, et al. Temporal dynamics of the human vaginal microbiota. Sci Transl Med. 2012;4:132ra52. 10.1126/scitranslmed.3003605 - DOI - PMC - PubMed
    1. Haahr T, et al. Abnormal vaginal microbiota may be associated with poor reproductive outcomes: a prospective study in IVF patients. Hum Reprod. 2016;31:795–803. 10.1093/humrep/dew026 - DOI - PubMed
    1. Brusselaers N, Shrestha S, van de Wijgert J, Verstraelen H. Vaginal dysbiosis and the risk of human papillomavirus and cervical cancer: systematic review and meta-analysis. Am J Obstet Gynecol. 2019;221:9-18.e8. Preprint at : 10.1016/j.ajog.2018.12.011. 10.1016/j.ajog.2018.12.011 - DOI - PubMed
    1. Tamarelle J, et al. The vaginal microbiota and its association with human papillomavirus, Chlamydia trachomatis, Neisseria gonorrhoeae and Mycoplasma genitalium infections: a systematic review and meta-analysis. Clin Microbiol Infecti. 2019;25:35–47. Preprint at : 10.1016/j.cmi.2018.04.019.10.1016/j.cmi.2018.04.019 - DOI - PMC - PubMed

LinkOut - more resources