. 2024 Aug 19:7:0457.
doi: 10.34133/research.0457. eCollection 2024.

DNA Methylation-Mediated GPX4 Transcriptional Repression and Osteoblast Ferroptosis Promote Titanium Particle-Induced Osteolysis

Affiliations

DNA Methylation-Mediated GPX4 Transcriptional Repression and Osteoblast Ferroptosis Promote Titanium Particle-Induced Osteolysis

Jian Dong et al. Research (Wash D C). .

Abstract

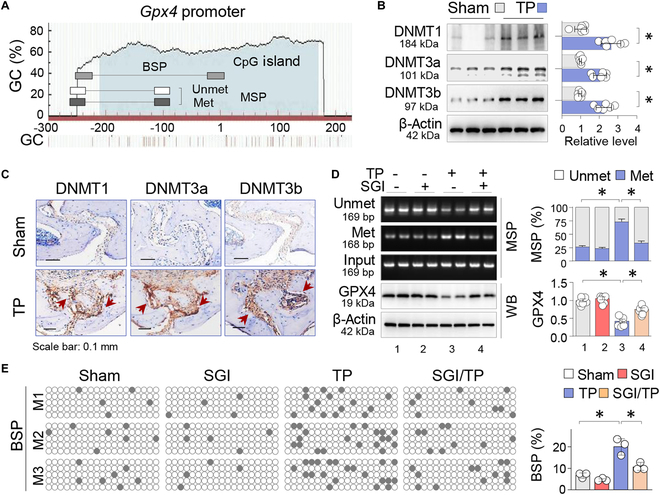
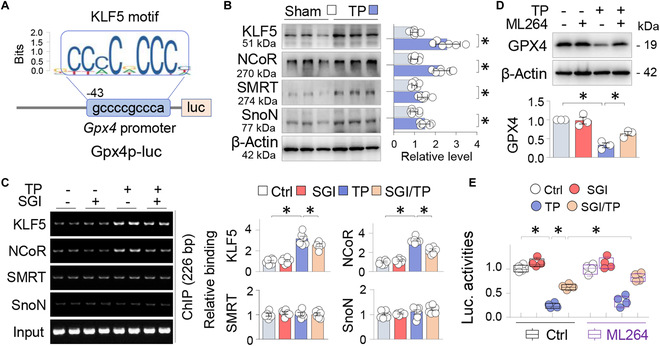
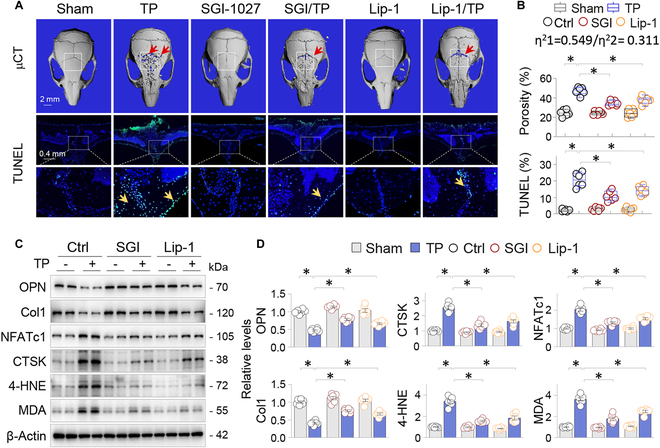
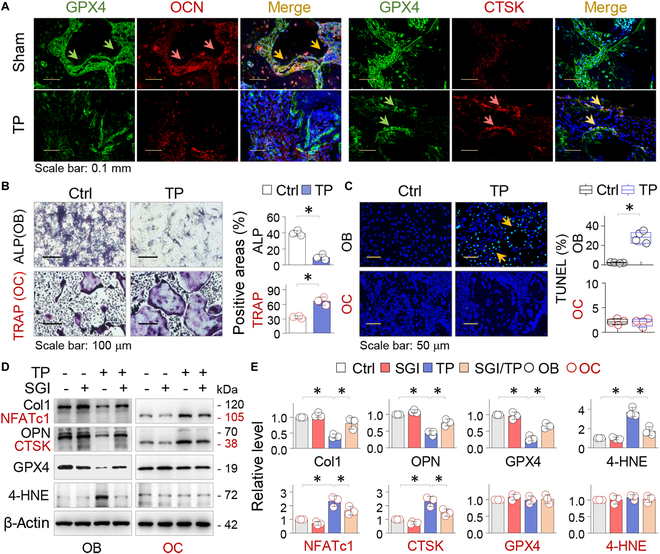
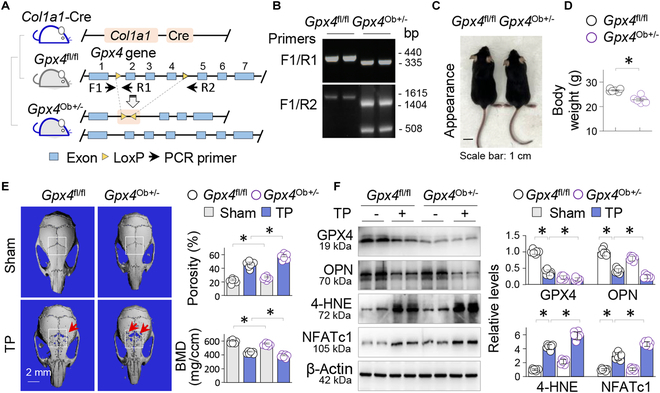
Metal wear particles generated by the movement of joint prostheses inevitably lead to aseptic osteolytic damage and ultimately prosthesis loosening, which are aggravated by various types of regulated cell death of bone. Nevertheless, the exact cellular nature and regulatory network underlying osteoferroptosis are poorly understood. Here, we report that titanium particles (TP) induced severe peri-implant osteolysis and ferroptotic changes with concomitant transcriptional repression of a key anti-ferroptosis factor, GPX4, in a mouse model of calvarial osteolysis. GPX4 repression was accompanied by an increase in DNA methyltransferases (DNMTs) 1/3a/3b and hypermethylation of the Gpx4 promoter, which were partly mediated by the transcriptional regulator/co-repressor KLF5 and NCoR. Conversely, treatment with SGI-1027, a DNMT-specific inhibitor, resulted in marked reversal of Gpx4 promoter hypermethylation and GPX4 repression, as well as improvement in ferroptotic osteolysis to a similar extent as with a ferroptosis inhibitor, liproxstatin-1. This suggests that epigenetic GPX4 repression and ferroptosis caused by the increase of DNMT1/3a/3b have a causal influence on TP-induced osteolysis. In cultured primary osteoblasts and osteoclasts, GPX4 repression and ferroptotic changes were observed primarily in osteoblasts that were alleviated by SGI-1027 in a GPX4 inactivation-sensitive manner. Furthermore, we developed a mouse strain with Gpx4 haplodeficiency in osteoblasts (Gpx4 Ob+/-) that exhibited worsened ferroptotic osteolysis in control and TP-treated calvaria and largely abolished the anti-ferroptosis and osteoprotective effects of SGI-1027. Taken together, our results demonstrate that DNMT1/3a/3b elevation, resulting GPX4 repression, and osteoblastic ferroptosis form a critical epigenetic pathway that significantly contributes to TP-induced osteolysis, and that targeting DNMT aberration and the associated osteoferroptosis could be a potential strategy to prevent or slow down prosthesis-related osteolytic complications.


Conflict of interest statement

Competing interests: The authors declare that they have no competing interests.

Figures

Fig. 1.
Fig. 1.
Titanium particles (TPs) induce significant GPX4 repression and ferroptosis in a mouse model of calvarial osteolysis. In a mouse model of calvarial osteolysis, mice underwent Sham or TP treatment for 2 weeks (TP, 20 mg per mouse, n = 6). (A) Representative calvarial sections stained by H&E (upper part) or Perls’ prussian blue with DAB enhancement (lower part). Bone resorption and iron deposition were indicated by arrows. (B) Representative 3D micro-x-ray computed tomography (μCT) images of calvaria (upper part) and TUNEL-stained calvarial sections (lower part). Region of interest (ROI) and positively stained cells were indicated by squares and arrows, respectively. Quantitative analyses of bone porosity, bone mineral density (BMD), and TUNEL-positive cell ratio were presented as box-and-whisker plots. *P < 0.05, Student’s t test. (C) Representative TEM microphotographs. Normal and ferroptotic mitochondria in TP-treated calvaria were pointed by arrows. (D) Western blotting. Calvarial tissues were examined for Col1, OPN, GPX4, 4-HNE, MDA, and NFATc1, with β-actin serving as control. Three random samples from each group were shown. Quantification was presented as mean ± SEM; n = 6; *P < 0.05, Student’s t test. (E) Representative calvarial sections stained by immunohistochemistry (IHC) for GPX4. Positively stained cells were pointed by arrows. (F) RT-PCR. Gpx4 mRNAs from mouse calvaria were assessed by RT-PCR and analyzed on agarose gel. Gapdh served as control. Three random samples from each group were shown. Quantification was presented as mean ± SEM. n = 6. (G) Perioprosthetic bone tissues from patients receiving joint replacement and normal controls were assayed for GPX4 protein by Western blotting and GPX4 mRNA by qRT-PCR, with β-actin and GAPDH serving as controls, respectively. Quantifications were presented as mean ± SEM. n = 6; *P < 0.05, Student’s t test.
Fig. 2.
Fig. 2.
TP-induced GPX4 suppression coincides with DNMT elevation and Gpx4 promoter hypermethylation. (A) Schematic diagrams of the mouse Gpx4 promoter. The positions of CpG island and MSP/BSP primers were depicted relative to the transcription starting site. (B) Western blotting of the calvarial tissues from Sham and TP-treated (20 mg per mouse, 2 weeks) mice for DNMT1, DNMT3a, and DNMT3b, with β-actin serving as control. Three random samples per group were shown. Quantification was presented as mean ± SEM; n = 6; *P < 0.05, Student’s t test. (C) IHC. Representative calvarial sections stained by IHC for DNMT1, DNMT3a, and DNMT3b. The positively stained cells were pointed by arrows. (D) MSP assay and Western blotting. Calvarial tissues from Sham or TP-treated mice with or without SGI-1027 (2.5 mg/kg daily, n = 6) were assessed by MSP to assess methylation levels of the Gpx4 promoter. PCR products were examined via agarose gel electrophoresis. Two random samples from each group were shown. The methylated and unmethylated PCR products were adjusted with input PCR, and quantification was presented as mean ratio ± SEM. The same tissues were assessed for GPX4 protein, and quantification was presented as mean ± SEM. *P < 0.05, 2-way ANOVA. (E) BSP assay of the Gpx4 promoter. BSP was performed on 3 random animals (designated M1, M2, and M3) from each group. Five cloned PCR products from each animal were sequenced. Each box represents one mouse, and each row of dots in each box represents one cloned sequence, with each dot representing one CpG site. Empty circles denote unmethylated CpGs, whereas black dots represent methylated CpGs. Quantitative data were presented as mean ratio ± SEM of methylated/unmethylated CpGs in total CpGs within the cloned fragments. *P < 0.05, 2-way ANOVA.
Fig. 3.
Fig. 3.
DNMT aberration-induced GPX4 suppression is co-regulated by KLF5. (A) Schematic diagram depicting mouse Gpx4 promoter luciferase reporter, Gpx4p-luc, the KLF5 binding motif, and its position relative to the transcription starting site. (B) Western blot. Calvarial tissues treated with control and TP (20 mg per mouse, 2 weeks) were assayed for KLF5, NCoR, SnoN, and SMRT, with β-actin serving as control. Two random samples per group were shown. Quantification beside blots was presented as mean ± SEM; n = 6; *P < 0.05, Student’s t test. (C) ChIP. Sham or TP-treated calvaria treated with or without SGI-1027 (2.5 mg/kg daily) were immunoprecipitated first with antibodies to KLF5, SMRT, NCoR, or SnoN, and then the immunoprecipitated DNA fragments were amplified through PCR with primer set specific for the KLF5 motif-containing region of the Gpx4 promoter, respectively. The non-immunoprecipitated DNA served as control (Input). PCR products were resolved on agarose gels. Quantifications on the right side were presented as mean ± SEM; n = 6; *P < 0.05, 2-way ANOVA. (D) Western blot. Primary osteoblasts (OBs) treated without or with TP (100 μg/ml) and the KLF5 inhibitor ML264 (10 μM) for 48 h were assayed for GPX4, with β-actin serving as control. Quantification below was presented as mean ± SD of 3 replicated experiments. *P < 0.05, 2-way ANOVA. (E) Luciferase assay. Primary OBs were transfected with a mouse Gpx4 promoter-luciferase reporter (Gpx4p-luc) and a Renilla luciferase reporter control, and then treated without or with TP (100 μg/ml) and SGI-1027 (10 μM) in the absence or presence of ML264 (10 μM) for 48 h. Luciferase activities of the Gpx4 promoter reporter were adjusted to Renilla luciferase activities and presented as box-and-whisker plots of 4 independent experiments. *P < 0.05, 3-way ANOVA.
Fig. 4.
Fig. 4.
DNMT inhibition by SGI-1027 alleviates TP-incurred GPX4 suppression and ferroptotic osteolysis. Mice were allocated to Sham or TP groups (20 mg per mouse, 2 weeks) and treated with control vehicle (Ctrl), SGI-1027 (2.5 mg/kg daily), or Lip-1 (10 mg/kg daily) (n = 6). (A) Exemplary 3D μCT calvarial images and TUNEL-stained calvarial sections. The ROI within μCT images was indicated by squares, while bone resorption areas and TUNEL-positive cells are pointed by arrows. (B) Quantitation of bone porosity and the ratio of TUNEL-positive cells. Data were presented as box-and-whisker plots. *P < 0.05, 2-way ANOVA. The effect size of the interaction between TP-induced calvarial porosity and SGI-1027 (η21) or Lip-1 (η22) intervention was indicated. (C) Western blotting of 2 random calvarial samples from each group for OPN, Col1, CTSK, NFATc1, 4-HNE, and MDA, with β-actin serving as control. (D) Quantification of (C). Data were depicted as mean ± SEM; n = 6; *P < 0.05, 2-way ANOVA.
Fig. 5.
Fig. 5.
TP-induced GPX4 repression and ferroptotic alterations occur primarily in OBs. (A) Immunofluorescent double staining. Representative calvarial sections from Sham or TP-treated mice were dual-stained for GPX4 (green) with either OCN or CTSK (red), counterstained with DAPI (blue), and then merged. The double-positive cells were indicated by arrows (yellow). (B) Primary OB and OC were treated with control (Ctrl) or TP (100 μg/ml) for 7 or 5 days, respectively. Representative images of OBs and OCs stained for ALP or TRAP activities. Quantifications were presented as average ratio of positively stained area ± SD of 3 independent assays; *P < 0.05, Student’s t test. (C) Representative images of OB and OC treated with control or TP (100 μg/ml) for 48 h and assayed by TUNEL staining. Quantifications were presented as box-and-whisker plots (n = 4). *P < 0.05, Student’s t test. (D) OB and OC treated with control (Ctrl) or TP (100 μg/ml) in the presence or absence of SGI-1027 (10 μM) for 48 h were examined by Western blotting for Col1, OPN, NFATc1, CTSK, GPX4, and 4-HNE, with β-actin serving as control. (E) Quantifications of (D) were presented as mean ± SD of 3 separate experiments. *P < 0.05, 2-way ANOVA.
Fig. 6.
Fig. 6.
GPX4 inactivation by RSL3 blocks the anti-ferroptotic effects of SGI-1027 in OBs. (A) Representative images of OBs (48 h) treated with TP (100 μg/ml) or RSL3 (0.3 μM) either alone or in conjunction with SGI-1027 (10 μM) and then assayed by C11-BODIPY (upper 3 panels). OBs treated as above were examined by TEM. The ferroptotic mitochondrial alterations were indicated by arrows (lower panel). (B) Quantifications of N-BODIPY and O-BODIPY. The data were presented by box-and-whisker plots (n = 4). *P < 0.05, 2-way ANOVA. (C) Luciferase assay. A mouse Gpx4 promoter luciferase reporter Gpx4p-Luc and a Renilla luciferase control were transfected into primary OBs. These cells were subsequently treated with TP (100 μg/ml), with or without SGI-1027 (10 μM) or RSL3 (0.3 μM) for 48 h. The luciferase activity of the Gpx4 promoter was adjusted with the Renilla luciferase readings and presented by box-and-whisker plots of 6 independent assays. *P < 0.05, 2-way ANOVA. (D) Western blotting. OBs that had undergone 48-h treatments with TP (100 μg/ml) and/or SGI-1027 (10 μM) in the absence or presence of RSL3 (0.3 μM) were detected for 4-HNE and GPX4. (E) Quantification of (D). Data were presented as mean ± SD; n = 3; *P < 0.05, 2-way ANOVA.
Fig. 7.
Fig. 7.
Osteoblastic GPX4 haplodeficiency exacerbates TP-induced osteolysis. (A) Schematic generation of OB-specific Gpx4 haplodeficient mice Gpx4Ob+/− by crossing Gpx4-flox mice (Gpx4fl/fl) with transgenic Col1a1-Cre mice. (B) Genotyping of Gpx4fl/fl and Gpx4Ob+/− mice by PCR with primers F1/R1 and R1/R2 and PCR product analysis on agarose gels. The sizes (bp) of PCR products were indicated. (C) Appearance and (D) quantification of body weight of Gpx4fl/fl and Gpx4Ob+/− mice at 8 weeks; n = 6; *P < 0.05, Student’s t test. (E) Representative 3D μCT calvarial images of Gpx4fl/fl and Gpx4Ob+/− mice. The ROIs were indicated by squares, while the areas of resorption were highlighted by arrows. Quantitative analyses of bone porosity and BMD were presented as mean ± SEM. *P < 0.05, 2-way ANOVA. (F) Western blotting of calvarial tissues for GPX4, 4-HNE, NFATc1, and OPN, with β-actin serving as control. Two random samples from each group were shown. Quantitative analysis was presented as mean ± SEM; n = 6; *P < 0.05, 2-way ANOVA.
Fig. 8.
Fig. 8.
OB GPX4 is critical for the anti-ferroptotic and osteoprotective effects of SGI-1027 in vivo. Gpx4fl/fl and Gpx4Ob+/− mice were divided into Sham, SGI-1027, TP, and SGI-1027/TP groups (n = 6, 2 weeks). (A) Representative images of 3D μCT calvaria (upper panel) and TUNEL-stained calvarial sections (lower panel). The ROIs of μCT images were indicated by squares, while the resorption areas and TUNEL-positive cells were indicated by arrows. (B) Quantification of (A). Data were presented as box-and-whisker plots (n = 6); *P < 0.05, 3-way ANOVA followed by Tukey’s post hoc test. (C) Western blotting of calvarial tissues for GPX4, 4-HNE, Col1, and NFATc1, with β-actin serving as control. Two random samples per group were presented. (D) Quantification of (C). Data were depicted as mean ± SEM; *P < 0.05, 2-way ANOVA. (E) Schematic diagram of sequential TP treatment, DNMT1/3a/3b elevations, GPX4 promoter hypermethylation (m), KLF5-assisted GPX4 transcriptional suppression, and resulting OB ferroptosis (FPT) that promote osteolysis. Contrarily, DNMT inhibition (DNMTi) by SGI-1027 blocks the processes (BLC, bone lining cell).

References

    1. Mediero A, Ramkhelawon B, Wilder T, Purdue PE, Goldring SR, Dewan MZ, Loomis C, Moore KJ, Cronstein BN. Netrin-1 is highly expressed and required in inflammatory infiltrates in wear particle-induced osteolysis. Ann Rheum Dis. 2016;75(9):1706–1713. - PMC - PubMed
    1. Landgraeber S, Jager M, Jacobs JJ, Hallab NJ. The pathology of orthopedic implant failure is mediated by innate immune system cytokines. Mediat Inflamm. 2014;2014: Article 185150. - PMC - PubMed
    1. Goodman SB, Gallo J. Periprosthetic osteolysis: Mechanisms, prevention and treatment. J Clin Med. 2019;8(12):2091. - PMC - PubMed
    1. Purdue PE, Koulouvaris P, Potter HG, Nestor BJ, Sculco TP. The cellular and molecular biology of periprosthetic osteolysis. Clin Orthop Relat Res. 2007;454:251–261. - PubMed
    1. Wauquier F, Leotoing L, Coxam V, Guicheux J, Wittrant Y. Oxidative stress in bone remodelling and disease. Trends Mol Med. 2009;15(10):468–477. - PubMed

LinkOut - more resources