

Saccharomycetaceae: delineation of fungal genera based on phylogenomic analyses, genomic relatedness indices and genomics-based synapomorphies
- PMID: 39161631
- PMCID: PMC11319838
- DOI: 10.3767/persoonia.2024.52.01
Saccharomycetaceae: delineation of fungal genera based on phylogenomic analyses, genomic relatedness indices and genomics-based synapomorphies
Abstract
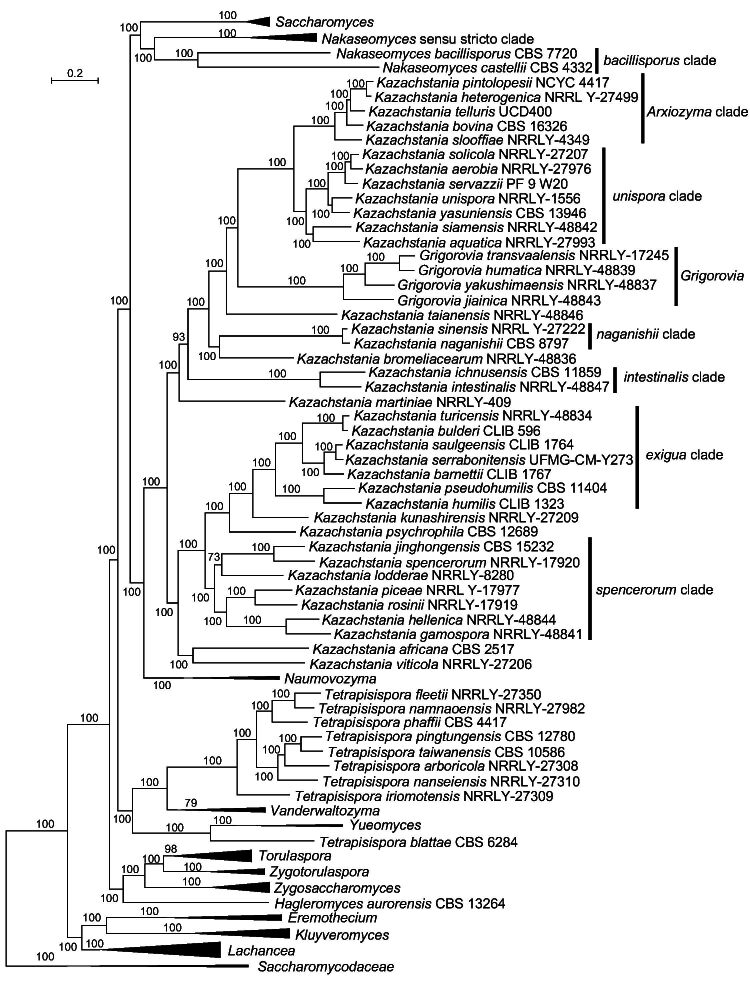
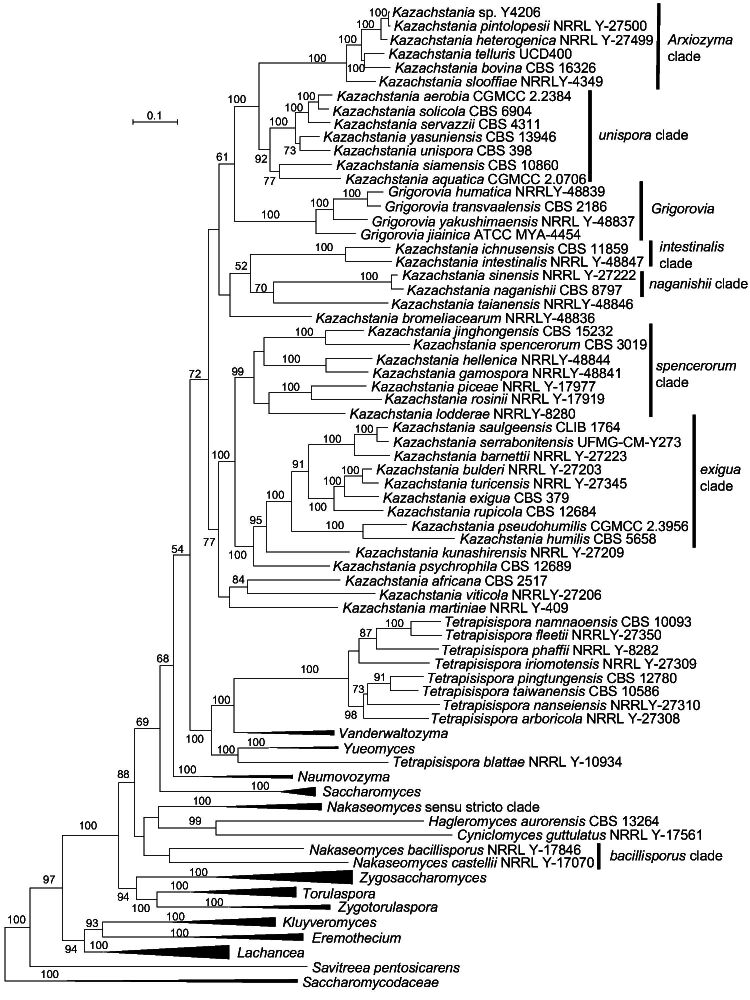
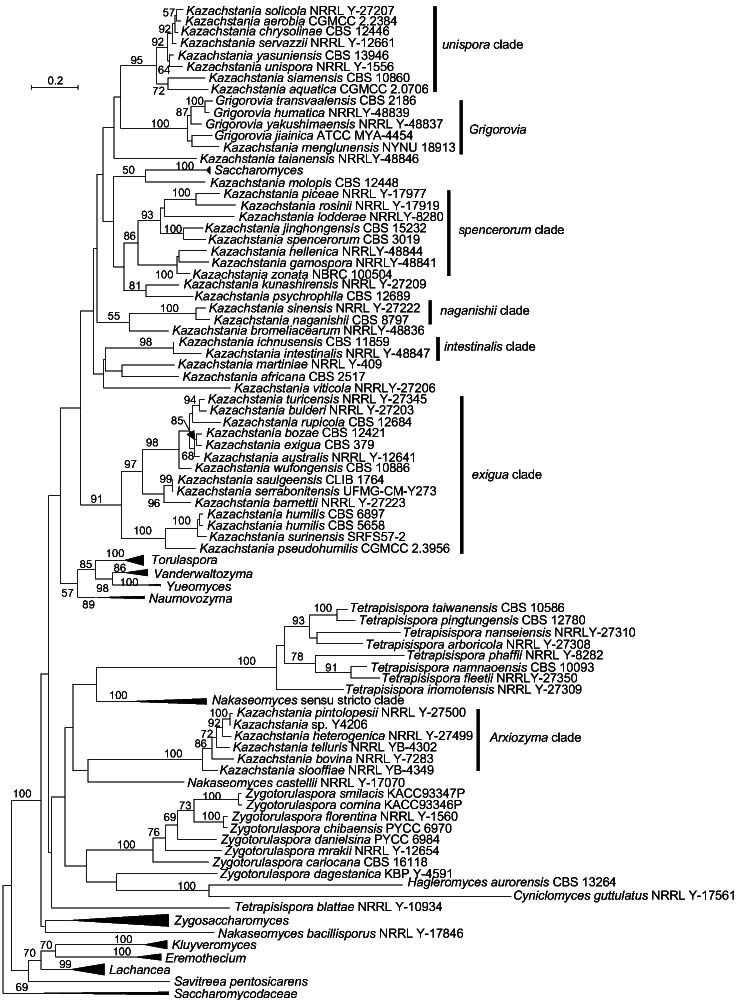
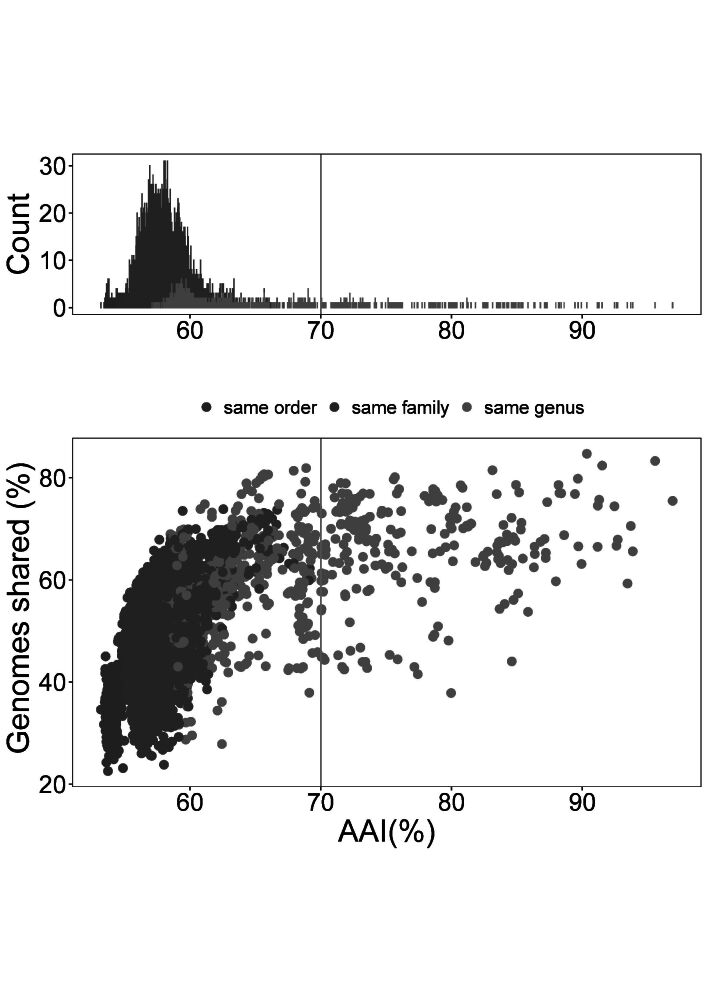
A correct classification of fungi, including yeasts, is of prime importance to understand fungal biodiversity and to communicate about this diversity. Fungal genera are mainly defined based on phenotypic characteristics and the results of single or multigene-based phylogenetic analyses. However, because yeasts often have less phenotypic characters, their classification experienced a strong move towards DNA-based data, from short ribosomal sequences to multigene phylogenies and more recently to phylogenomics. Here, we explore the usefulness of various genomics-based parameters to circumscribe fungal genera more correctly taking the yeast domain as an example. Therefore, we compared the results of a phylogenomic analysis, average amino acid identity (AAI) values, the presence of conserved signature indels (CSIs), the percentage of conserved proteins (POCP) and the presence-absence patterns of orthologs (PAPO). These genome-based metrics were used to investigate their usefulness in demarcating 13 hitherto relatively well accepted genera in Saccharomycetaceae, namely Eremothecium, Grigorovia, Kazachstania, Kluyveromyces, Lachancea, Nakaseomyces, Naumovozyma, Saccharomyces, Tetrapisispora, Torulaspora, Vanderwaltozyma, Zygosaccharomyces and Zygotorulaspora. As a result, most of these genera are supported by the genomics-based metrics, but the genera Kazachstania, Nakaseomyces and Tetrapisispora were shown to be genetically highly diverse based on the above listed analyses. Considering the results obtained for the presently recognized genera, a range of 80-92 % POCP values and a range of 60-70 % AAI values might be valuable thresholds to discriminate genera in Saccharomycetaceae. Furthermore, the genus-specific genes identified in the PAPO analysis and the CSIs were found to be useful as synapomorphies to characterize and define genera in Saccharomycetaceae. Our results indicate that the combined monophyly-based phylogenomic analysis together with genomic relatedness indices and synapomorphies provide promising approaches to delineating yeast genera and likely those of filamentous fungi as well. The genera Kazachstania, Nakaseomyces and Tetrapisispora are revised and we propose eight new genera and 41 new combinations. Citation: Liu F, Hu Z-D, Yurkov A, et al. 2024. Saccharomycetaceae: delinaeation of fungal genera based on phylogenomic analyses, genomic relatedness indices and genomics-based synapomorphies. Persoonia 52: 1-21. https://doi.org/10.3767/persoonia.2024.52.01.
Keywords: AAI; CSI; PAPO; POCP; barcode; new taxa; phenotypic comparisons; phylogenomics; taxonomy; yeasts.
© 2024 Naturalis Biodiversity Center & Westerdijk Fungal Biodiversity Institute.
Conflict of interest statement
The authors declare that there is no conflict of interest.
Figures
References
-
- Aliyu H, Lebre P, Blom J, et al. 2016. Phylogenomic re-assessment of the thermophilic genus Geobacillus. Systematic and Applied Microbiology 39: 527–533. - PubMed
-
- Alnajar S, Gupta RS. 2017. Phylogenomics and comparative genomic studies delineate six main clades within the family Enterobacteriaceae and support the reclassification of several polyphyletic members of the family. Infection, Genetics and Evolution 54: 108–127. - PubMed
Associated data
LinkOut - more resources
Full Text Sources
Research Materials