. 2024 Jul 31;3(8):pgae288.
doi: 10.1093/pnasnexus/pgae288. eCollection 2024 Aug.

Coupled oscillations orchestrate selective information transmission in visual cortex

Affiliations

Coupled oscillations orchestrate selective information transmission in visual cortex

Mohammad Bagher Khamechian et al. PNAS Nexus. .

Abstract

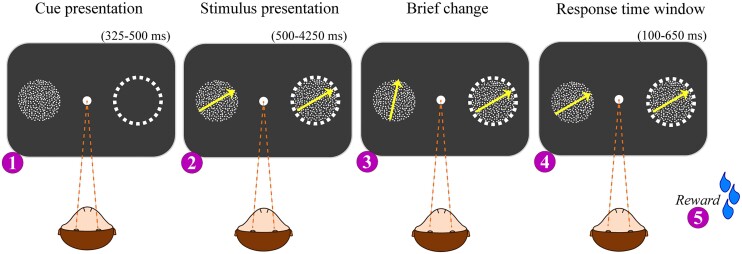
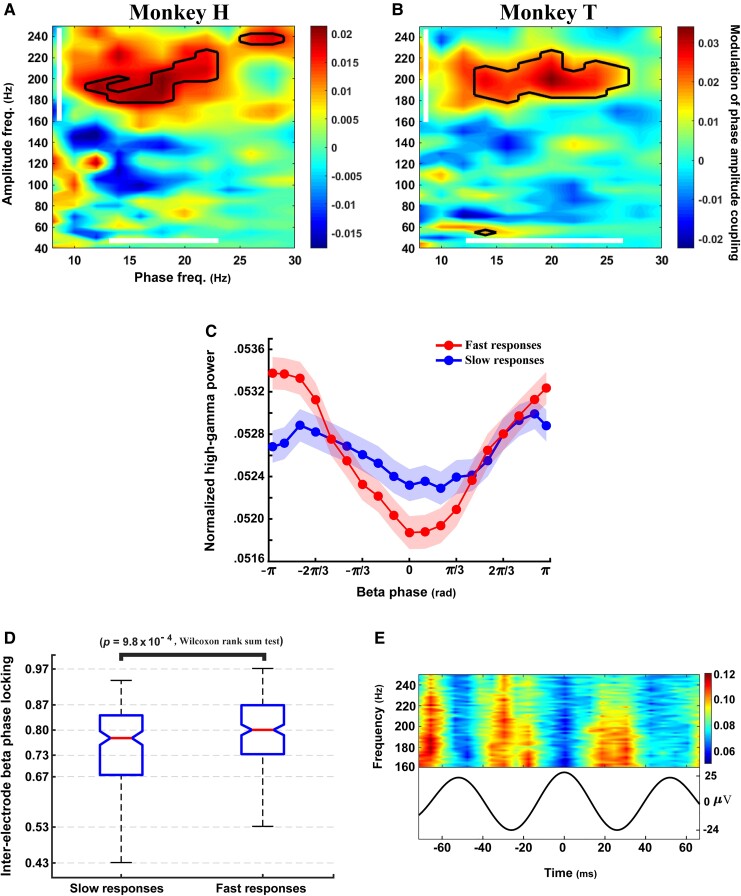
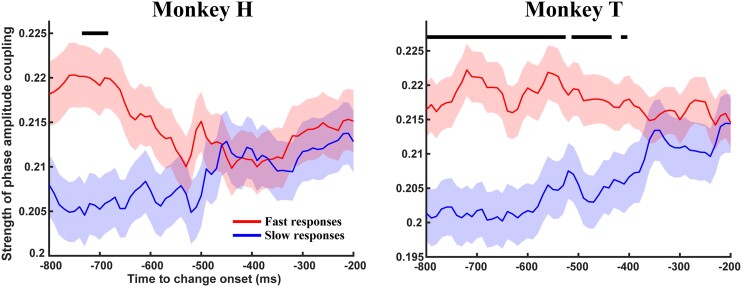
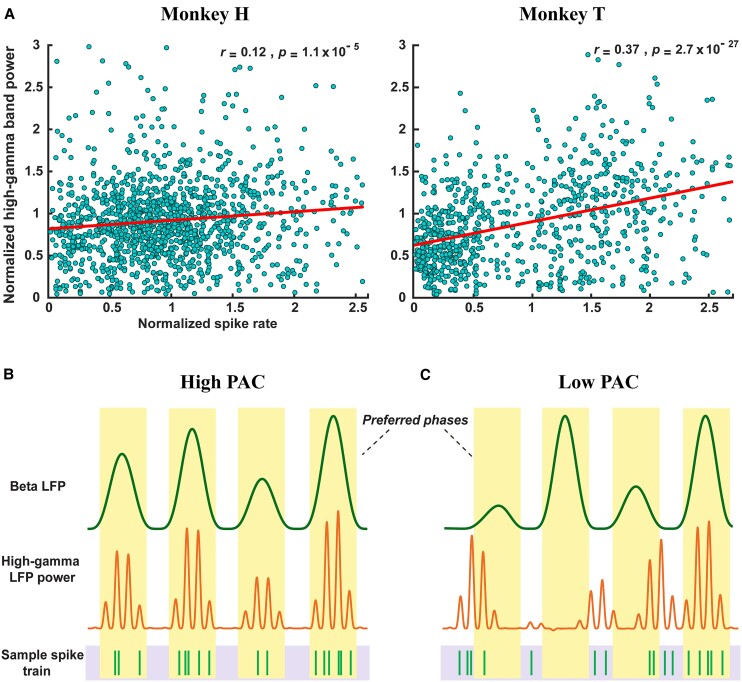
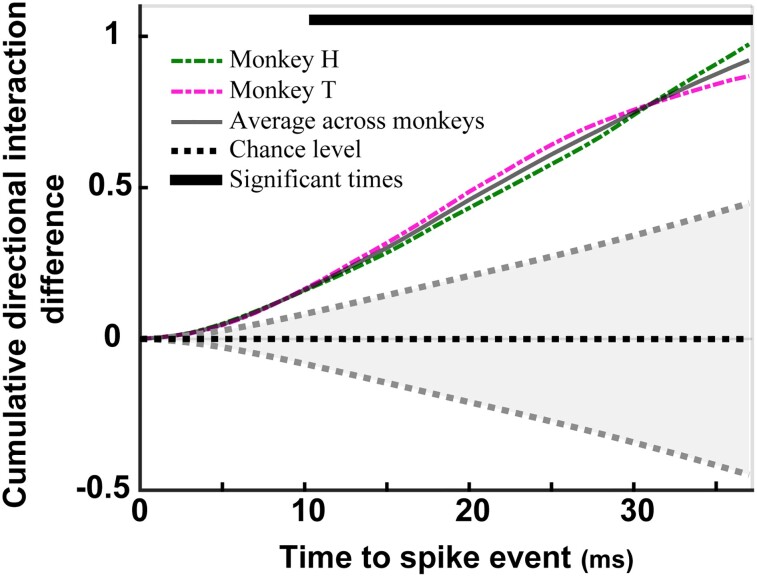
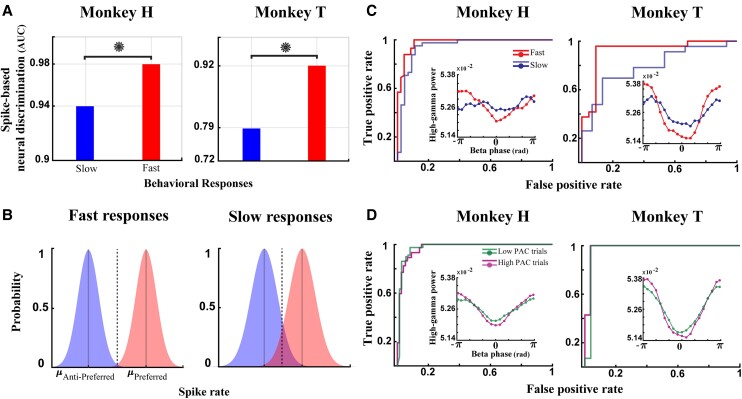
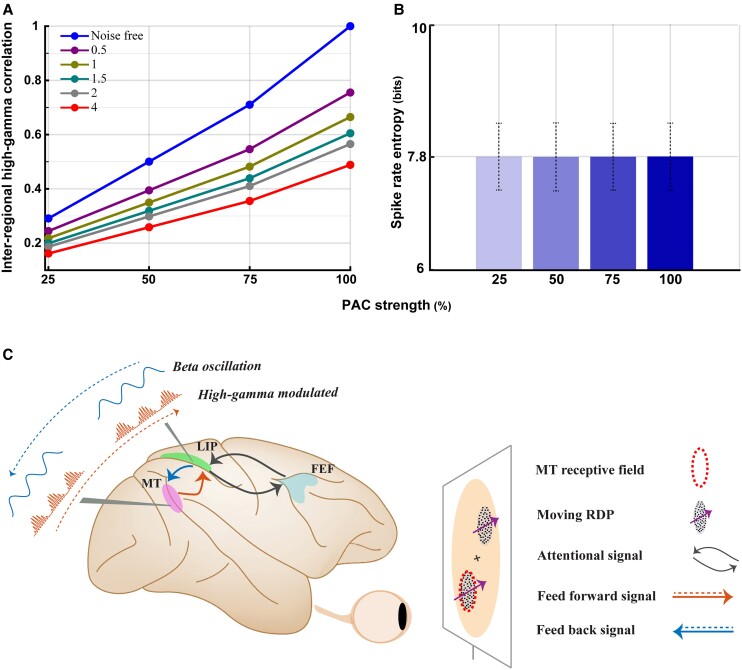
Performing visually guided behavior involves flexible routing of sensory information towards associative areas. We hypothesize that in visual cortical areas, this routing is shaped by a gating influence of the local neuronal population on the activity of the same population's single neurons. We analyzed beta frequencies (representing local population activity), high-gamma frequencies (representative of the activity of local clusters of neurons), and the firing of single neurons in the medial temporal (MT) area of behaving rhesus monkeys. Our results show an influence of beta activity on single neurons, predictive of behavioral performance. Similarly, the temporal dependence of high-gamma on beta predicts behavioral performance. These demonstrate a unidirectional influence of network-level neural dynamics on single-neuron activity, preferentially routing relevant information. This demonstration of a local top-down influence unveils a previously unexplored perspective onto a core feature of cortical information processing: the selective transmission of sensory information to downstream areas based on behavioral relevance.

Keywords: high-gamma oscillations; local field potentials; macaque visual area MT; neural oscillations; phase-amplitude coupling (PAC).


Figures

Fig. 1.
Fig. 1.
Behavioral paradigm. To start a trial, the monkey pressed a lever bar and maintained their gaze on a fixation point (filled circle or filled square for monkey H and T, respectively). Next, a static RDP (moving RDP for monkey T) appeared for 325–500 ms to signal (cue) the position of the target stimulus on the screen. After ending the cue exhibition period, two moving RDP stimuli were displayed for a random duration of 500–4250 ms. Next, a quick direction change (direction or color change for Monkey T) occurred in one of two RDPs and the monkey was instructed to release the lever bar within a response window of 100 to 650 ms. White dashed-circle was not displayed on the real behavioral task, yet it was employed for a representative purpose, to delineate the RF location of MT neurons on the monitor screen. The inset numbers implicate the behavioral task sequences.
Fig. 2.
Fig. 2.
Strength of PAC differs between fast and slow behavioral responses. A, B) Maps of differences between PAC strengths are calculated for 15(phase providing)*43(power providing) pairs of frequency bands calculated from nonoverlapping 2 Hz pass-band windows (changing between 1 and 30 Hz) and 10 Hz pass-band windows overlapping with 5 Hz bounds (changing between 35 and 255 Hz), respectively. The heat maps show the average PAC strength of slow trials subtracted from that of fast trials. X-/Y-axes indicate the lower bound of phase-providing/power-providing frequency bands. Black outlines demonstrate frequency pairs with a significant PAC difference between the fast and slow trials (ρ=0.0039 and ρ=0.0042 for monkeys H and T, respectively; two-sided Wilcoxon rank sum test with FDR correction for multiple comparisons). The phase-providing and power-providing frequency ranges with a significant behavioral modulation are indicated by white lines for each animal C, Normalized average of high-gamma power (160–250 Hz) within different phases of the beta band (19 nonoverlapping phase segments) averaged across animals. The beta frequency band was selected between 13–23 Hz/12–26 Hz for monkey H/T (frequencies with a significant PAC modulation-according to maps A/B). X values represent the middle of the phase segments and error bars show the SEM. D, The boxplot illustrates the phase locking value (PLV) of the oscillations within the beta band between pairs of sites (averaged across beta sub-bands, see SI Appendix, Extended Methods), recorded simultaneously for the two animals. The PLV indicates an average difference of instantaneous phases between two neighboring electrodes. PLV was significantly different between the fast and slow trials (ρ=0.00098 two-sided Wilcoxon rank sum test). E) Beta peak-triggered spectrogram for high-gamma. The spectrogram was calculated using short-time Fourier transform with 7 ms time windows of 1 ms overlaps. Both fast and the slow trials are pooled together here across both animals. Color bar scales between the minimum and maximum of the normalized powers across high-gamma frequencies. The bottom curve shows the beta-filtered LFPs (17–21 Hz) averaged across trials after aligning to their highest-amplitude peak.
Fig. 3.
Fig. 3.
Time-resolved changes of PAC strength within the 1,000 ms before the direction change. 400 ms sliding time windows, lagged by 10 ms were used for calculating the PAC strength within those frequencies, with their PACs significantly differentiated across reaction times (as shown in Fig. 2A and B). X values represent the middle of the analysis time windows. The black line marks time windows with a significant difference in PAC between fast and slow trials (monkey H: ρ=0.0039 and monkey T: ρ=0.0294; two-sided Wilcoxon rank sum test, corrected for multiple comparisons using FDR).
Fig. 4.
Fig. 4.
Correlation between high-gamma power (180–220 Hz) and spike rate. A) Each data point represents the normalized high-gamma power (Y-axis) as a function of the associated spike rate (X axis), calculated for each trial. The high-gamma power is significantly correlated with the spike rate across trials (monkey H; r=0.12, ρ=1.1×10⁻⁵ and monkey T; r=0.37, ρ=2.7×10⁻²⁷, Spearman correlation). Trials with a spike rate or high-gamma power exceeding mean ± 2×standard deviation were removed from this analysis. B and C) Cartoon rendition showing how a difference in the strength of beta-HG coupling causes spikes to be coupled (B) or de-coupled (C) from the beta phase.
Fig. 5.
Fig. 5.
Beta phase's directional interaction with spikes differs between fast and slow trials. We computed the relative directional interaction of the beta phase and the spikes computed within different time frames from the spike event. The y-axis represents the relative directional interaction in fast trials subtracted by the relative directional interaction in slow trials. Error bars reflect the standard deviation (SD) estimated by repeatedly shuffling the trial labels (fast/slow) (N = 1,000).
Fig. 6.
Fig. 6.
Neural discrimination and PAC modulate behavior, independently. A) Bars indicate the AUC for the discrimination of preferred and antipreferred direction of motion based on spike rates (separately performed for fast and slow trials). To evaluate the significance of differences between the AUCs of fast and slow trials, permutation hypothesis testing was performed (ρ=0.027 and ρ=0.008 for monkeys H and T—see Materials and methods section for details). B) Cartoon representation of the spike probability distribution in fast (right panel) and slow (left panel) trials when the stimulus moves in the preferred (red) or antipreferred (blue) direction. X-values represent the spike rate and Y-values indicate the probability of a given spike rate across neural population. C) ROC curves (for the discrimination of preferred vs. antipreferred direction of motion) and probability density of high-gamma relative to the beta phase for fast and slow trials (corresponding AUCs were shown in Fig. 6A). D) Neural discrimination of the two subsets of trials with a maximum difference between their average PAC strength and a minimum difference in their average reaction times. The two subsets were found to not have a significant difference in their average reaction time (two-sided Wilcoxon rank sum test, ρ=0.79 and ρ=0.99 for monkeys H and T, respectively), while they were significantly different in their average PAC strength (two-sided Wilcoxon rank sum test, ρ=1.1×10³ and ρ=1.7×10⁴ for monkeys H and T, respectively). AUCs and a permutation test show that the neural discrimination is not significantly different between the high-PAC and low-PAC trials (ρ=0.72 and ρ=0.30 for monkeys H and T, respectively). The AUC analysis for high-PAC trials and low-PAC trials resulted in AUCs of (0.970 [high PAC], 0.973 [low PAC]) and (0.980 [high PAC], 0.964 [low PAC]) in monkeys H and T, respectively.
Fig. 7.
Fig. 7.
Beta-HG PAC underlies inter-areal communication, independent of spike rate-based neural discrimination. A) Modeling results for the inter-areal high-gamma power correlation as a function of PAC strength; the y-axis shows the correlation of high-gamma power (modulated by the beta phase) between upstream (e.g. MT) and downstream (e.g. LIP) cortical areas. Colors illustrate different levels of additive noise magnitude; a larger value reflects a higher magnitude of additive noise (see SI Appendix, Extended Methods). B) Information capacity of spiking activity across different strengths of PAC; the y-axis shows the average Shannon entropy across 10,000 spike trains (see SI Appendix, Extended Methods). Error bars represent the standard deviation. The x-axis in (A) and (B) shows different PAC strengths, with 100% representing the highest possible PAC. C) Schematic description of inter-areal communication for transmission of the behaviorally relevant information. The top-down attention signal is believed to be mediated by a beta band oscillation generated within the LIP-FEF network. This beta activity (as a feed-back signal) may facilitate the feed-forward signal transmission from MT towards LIP, depending on the focus of attention. PAC (between beta and HG) has a facilitative role in routing sensory information across the visuo-motor network.

Similar articles

Cited by

References

    1. Parto Dezfouli M, Khamechian MB, Treue S, Esghaei M, Daliri MR. 2018. Neural activity predicts reaction in primates long before a behavioral response. Front Behav Neurosci. 12:207. - PMC - PubMed
    1. Khamechian MB, Kozyrev V, Treue S, Esghaei M, Daliri MR. 2019. Routing information flow by separate neural synchrony frequencies allows for “functionally labeled lines” in higher primate cortex. Proc Natl Acad Sci U S A. 2019;116(25):12506–12515. - PMC - PubMed
    1. Khamechian MB, Daliri MR. 2020. Decoding adaptive visuomotor behavior mediated by non-linear phase coupling in macaque area MT. Front Neurosci. 14:230. - PMC - PubMed
    1. Khamechian MB, Daliri MR. 2022. Frequency modulation of cortical rhythmicity governs behavioral variability, excitability and synchrony of neurons in the visual cortex. Sci Rep. 12:20914. - PMC - PubMed
    1. Schroeder CE, Lakatos P. 2009. Low-frequency neuronal oscillations as instruments of sensory selection. Trends Neurosci. 32:9–18. - PMC - PubMed

LinkOut - more resources