. 2024 Aug 6;3(8):pgae325.
doi: 10.1093/pnasnexus/pgae325. eCollection 2024 Aug.

Clinical immunity to malaria involves epigenetic reprogramming of innate immune cells

Affiliations

Clinical immunity to malaria involves epigenetic reprogramming of innate immune cells

Jason Nideffer et al. PNAS Nexus. .

Abstract

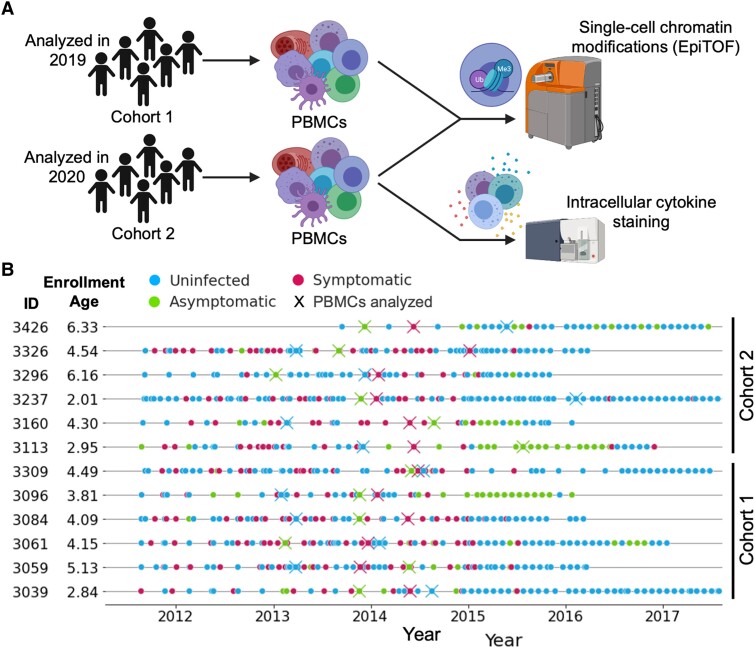
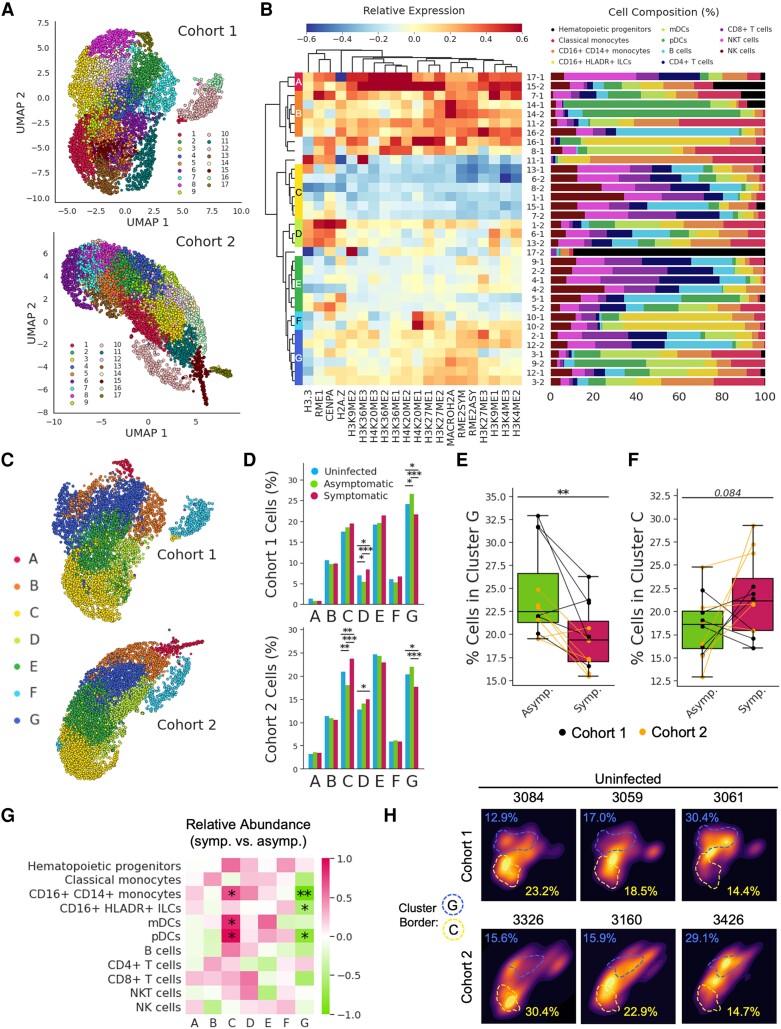
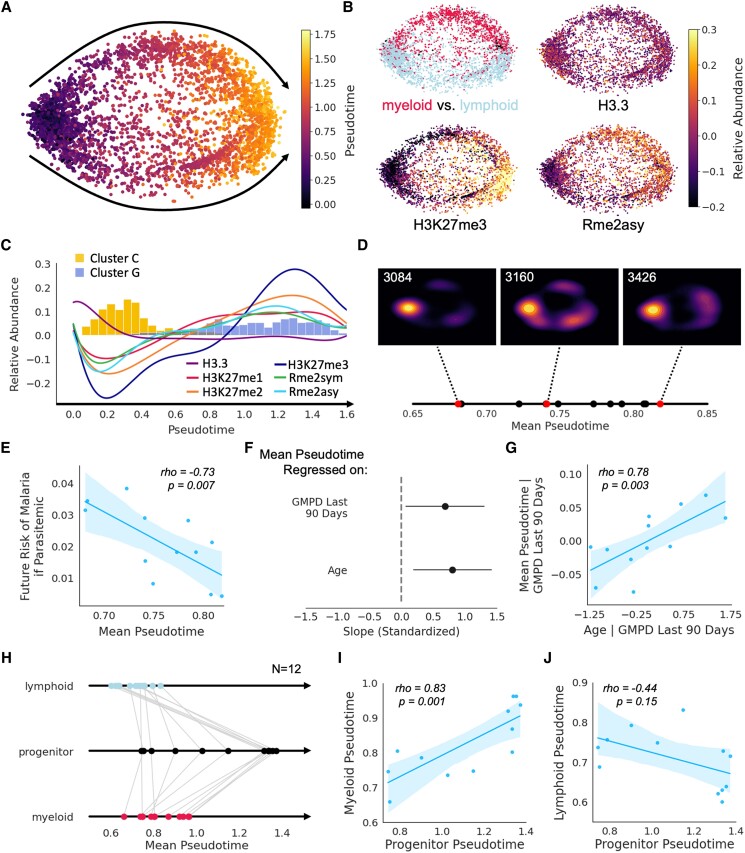
The regulation of inflammation is a critical aspect of disease tolerance and naturally acquired clinical immunity to malaria. Here, we demonstrate using RNA sequencing and epigenetic landscape profiling by cytometry by time-of-flight, that the regulation of inflammatory pathways during asymptomatic parasitemia occurs downstream of pathogen sensing-at the epigenetic level. The abundance of certain epigenetic markers (methylation of H3K27 and dimethylation of arginine residues) and decreased prevalence of histone variant H3.3 correlated with suppressed cytokine responses among monocytes of Ugandan children. Such an epigenetic signature was observed across diverse immune cell populations and not only characterized active asymptomatic parasitemia but also correlated with future long-term disease tolerance and clinical immunity when observed in uninfected children. Pseudotime analyses revealed a potential trajectory of epigenetic change that correlated with a child's age and recent parasite exposure and paralleled the acquisition of clinical immunity. Thus, our data support a model whereby exposure to Plasmodium falciparum induces epigenetic changes that regulate excessive inflammation and contribute to naturally acquire clinical immunity to malaria.


Figures

Fig. 1.
Fig. 1.
Differential gene expression in whole-blood implicates epigenetics in the outcomes of disease during Plasmodium infection of Ugandan children. A) Volcano plot showing differentially expressed genes in infants when they had symptomatic malaria vs. when they were uninfected. B) Volcano plot showing differentially expressed genes in children when they had asymptomatic parasitemia vs. when they were uninfected. P-values were adjusted to minimize false discovery. C, D) Enrichment of TLR signaling C) or cytokine-related D) gene sets in symptomatic malaria vs. uninfected (S vs. U) and asymptomatic parasitemia vs. uninfected (A vs. U). Enrichment was quantified as the normalized enrichment score (NES) between groups. Significant enrichments are annotated—P-value <0.05 (*); P-value <0.01 (**); P-value <0.001 (**).
Fig. 2.
Fig. 2.
Experimental design to assess epigenetic signatures that characterize clinical immunity in children living in malaria-endemic Uganda. A) Single-cell chromatin modifications were analyzed by EpiTOF. Twelve children were sampled when they were uninfected, when they had asymptomatic parasitemia, and when they had symptomatic malaria. These children were split into two cohorts (n = 6), the samples of which were analyzed in two separate EpiTOF experiments performed in 2019 and 2020 for cohorts 1 and 2, respectively. Intracellular cytokine staining was also performed on the samples from cohort 2. B) Timeline showing clinic visits (circles) and sample timepoints (X) of children included in our epigenetic study. Color indicates the disease state determined by qPCR and blood smear at the time of visit.
Fig. 3.
Fig. 3.
Epigenetic markers of asymptomatic parasitemia are associated with dampened cytokine responses in monocytes. A) The number (top) and effect size (bottom) of significantly differentially expressed epigenetic markers assessed via pairwise comparisons across disease states using MetaIntegrator (27, 28). Differentially expressed markers were defined as those that yielded a P-value <0.01 to minimize false discovery. B–D) Normalized expression of H3.3 B), H3K27me1 (C), and Rme2asy (D) in CD16+ CD14+ monocytes across disease states. E, F) Heatmap colored by Pearson correlation coefficients describing the relationship between cytokine expression and histone marker abundance) (left side). Select regressions are shown as scatterplots (right side; colored as in B–D according to disease state). Regressions demonstrate association between histone markers and cytokine expression in unstimulated CD16+ monocytes E) and Pam3CSK4-stimulated classical monocytes F). P-value <0.05 (*); P-value <0.01 (**). Flow cytometric data could not be obtained for one of the symptomatic samples analyzed by EpiTOF due to a lack of cells.
Fig. 4.
Fig. 4.
Inhibition of methyltransferases during myelopoiesis primes hematopoietic progenitors and monocytes for inflammatory cytokine production. A) Mechanisms by which tazemetostat and MS023 inhibit methyltransferases. B) Experimental design for monocyte differentiation in the presence of tazemetostat, MS023, or DMSO (control) and subsequent functional analysis. C, D) Percent of live cells that are monocytes C) or progenitors D) after differentiation. E) Percent of monocytes that are CD16+ after differentiation. F, G) Percent of progenitors that express TNFα (F) or IL-6 (G) after differentiation. H–K) Percent of classical monocytes. H, I) or CD16+ monocytes (J, K) that express TNFα (H, J) or IL-6 (I, K) in response to TLR stimulation. Statistical significance was determined by performing pairwise, paired T tests. P-value <0.05 (*); P-value <0.01 (**); P-value <0.001 (***).
Fig. 5.
Fig. 5.
Symptomatic malaria and asymptomatic parasitemia are characterized by distinct and reproducible epigenetic signatures that span immune cell populations. A) UMAP projections and Louvain clustering performed separately on single PBMCs from children of cohort 1 and cohort 2. B) The heatmap (left) displays the relative expression of epigenetic markers (columns) across clusters (rows) from both cohorts. Original cluster identities are labeled with their cluster number and the cohort from which they were derived (i.e. cluster 17 from cohort 1 is denoted 17-1). Hierarchical clustering of the clusters yielded epigenetically related meta clusters spanning both cohorts (labeled with letters A–G). The bar graph (right) displays the percent composition of each cluster by cell type. C) Original UMAP projections of clusters 1 and 2 with cells recolored according to their meta cluster identity. The axis for the cohort 2 UMAP was rotated so that its orientation is consistent with the cohort 1 UMAP. D) Percentage of cohort 1 (top) and cohort 2 (bottom) cells from a given disease state that were assigned to each meta cluster. Statistical significance was determined using Fisher's exact test with correction for multiple hypotheses. E, F) Percentage of each child's clustered PBMCs assigned to cluster G (E) or cluster C (F). G) Relative abundance of immune cell populations assigned to specific clusters when children from cohorts 1 and 2 (analyzed together) have symptomatic malaria vs. when they have asymptomatic parasitemia. Color represents effect size calculated using Hedges’ g formula; significance was determined using a paired two-sided T test. H) Kernel density estimate plots depicting the distributions of cells across the UMAPs from panel “C” for six different children at the uninfected timepoint. Dashed lines show the approximate borders of clusters G and C, respectively. Similarly colored percentages denote the proportion of each uninfected child's cells that belong to the corresponding cluster. P-value <0.05 (*); P-value <0.01 (**); P-value <0.001 (***).
Fig. 6.
Fig. 6.
Immune cell epigenetics during homeostasis predict the acquisition of disease tolerance and clinical immunity. A–D) Scatter plots displaying the relationship between the percentage of an uninfected child's sampled PBMCs assigned to cluster G and cluster C vs. their future incidence of malaria (A), their future test-positive rate (by blood smear) (B), their future parasite burden (log-scaled geometric mean parasite density [GMPD]) (C), and their future incidence of NMF (D). Future outcome variables were calculated using data collected for duration of 3 years after the sample timepoint. Shaded regions depict 95% CIs associated with a linear regression. We also performed Spearman correlations on these data—associated ρ and P values are displayed. E) Scatter plot depicting the negative correlation between cluster G and cluster C frequencies. Each observation represents a different child, and its color denotes that child's future risk of malaria if they test parasitemia-positive. Dashed circles highlight children that are “disease primed” (upper left) or “tolerance primed” (lower right). F) Box plot depicting past and future risks of malaria given parasitemia. Children are stratified based on whether they are “disease primed” or “tolerance primed” (according to panel “E”). P-value < 0.01 (**).
Fig. 7.
Fig. 7.
Pseudotime analyses model epigenetic changes that occur during childhood and contribute to clinical immunity among malaria-exposed Ugandans. A) tSpace projections of cells from uninfected children analyzed by EpiTOF. Cells from both cohorts (same as Fig. 4) were used and are colored based on pseudotime values. Black arrows depict two parallel trajectories through pseudotime. B) tSpace projections colored by cell lineage (top left), H3.3 abundance (top right), H3K27me3 abundance (bottom left), or Rme2asy (bottom right). C) Epigenetic marker (colored lines) and cluster (colored histograms) abundance over pseudotime. D) Mean pseudotime values calculated on a per-child basis are plotted along a solid line. Kernel density estimate plots are depicted for three children with early (3084), middle (3160), and late (3426) mean pseudotime values (red dots). E) Scatter plot depicting the relationship between mean pseudotime and future risk of malaria if parasitemic, demonstrating that children who have advanced further through pseudotime are more clinically immune. F) Fitted parameter values from a multiple regression of mean pseudotime on age and recent parasite burden (measured as geometric mean parasite density [GMPD] over the preceding 90 days)—values of fitted parameters are shown with 95% CIs. Independent and dependent variables were standardized prior to model fitting. G) Scatter plot depicting a partial regression where the effect of recent parasite burden is removed and mean pseudotime is regressed on age. H) Mean pseudotime calculated for lymphoid, progenitor, and myeloid cells. Gray lines connect values calculated from cells of the same child. I, J) Scatter plots depicting the relationship between myeloid pseudotime and progenitor pseudotime I) as well as between lymphoid pseudotime and progenitor pseudotime (J). For all scatter plots, shaded regions depict 95% CIs associated with a linear regression. We also performed Spearman correlations on these data—associated ρ and P-values are displayed.

Similar articles

Cited by

References

    1. World Health Organization . 2022. World malaria report 2022. Geneva: World Health Organization.
    1. Tran TM, et al. . 2013. An intensive longitudinal cohort study of Malian children and adults reveals no evidence of acquired immunity to Plasmodium falciparum infection. Clin Infect Dis. 57(1):40–47. - PMC - PubMed
    1. Rodriguez-Barraquer I, et al. . 2018. Quantification of anti-parasite and anti-disease immunity to malaria as a function of age and exposure. Elife. 7:e35832. - PMC - PubMed
    1. Medzhitov R, Schneider DS, Soares MP. 2012. Disease tolerance as a defense strategy. Science. 335(6071):936–941. - PMC - PubMed
    1. McCarville JL, Ayres JS. 2018. Disease tolerance: concept and mechanisms. Curr Opin Immunol. 50:88–93. - PMC - PubMed