

Longitudinal transcriptomic analysis reveals persistent enrichment of iron homeostasis and erythrocyte function pathways in severe COVID-19 ARDS
- PMID: 39161760
- PMCID: PMC11330807
- DOI: 10.3389/fimmu.2024.1397629
Longitudinal transcriptomic analysis reveals persistent enrichment of iron homeostasis and erythrocyte function pathways in severe COVID-19 ARDS
Abstract
Introduction: The acute respiratory distress syndrome (ARDS) is a common complication of severe COVID-19 and contributes to patient morbidity and mortality. ARDS is a heterogeneous syndrome caused by various insults, and results in acute hypoxemic respiratory failure. Patients with ARDS from COVID-19 may represent a subgroup of ARDS patients with distinct molecular profiles that drive disease outcomes. Here, we hypothesized that longitudinal transcriptomic analysis may identify distinct dynamic pathobiological pathways during COVID-19 ARDS.
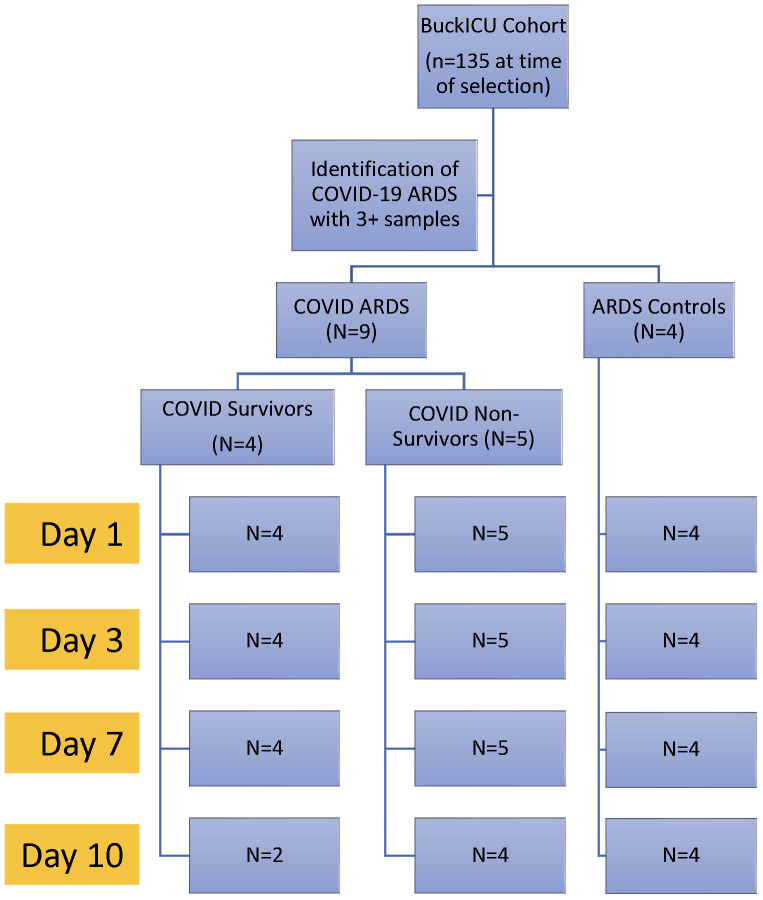
Methods: We identified a patient cohort from an existing ICU biorepository and established three groups for comparison: 1) patients with COVID-19 ARDS that survived hospitalization (COVID survivors, n = 4), 2) patients with COVID-19 ARDS that did not survive hospitalization (COVID non-survivors, n = 5), and 3) patients with ARDS from other causes as a control group (ARDS controls, n = 4). RNA was isolated from peripheral blood mononuclear cells (PBMCs) at 4 time points (Days 1, 3, 7, and 10 following ICU admission) and analyzed by bulk RNA sequencing.
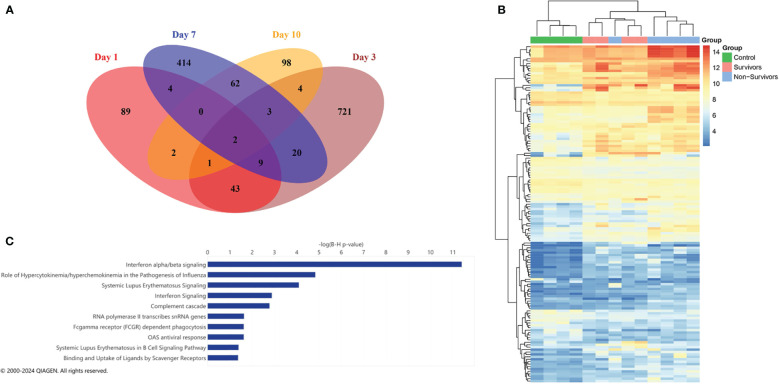
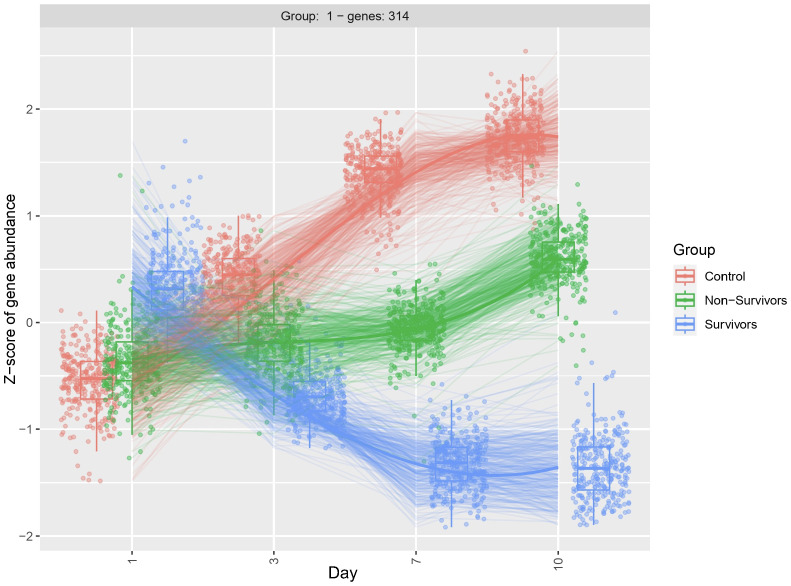
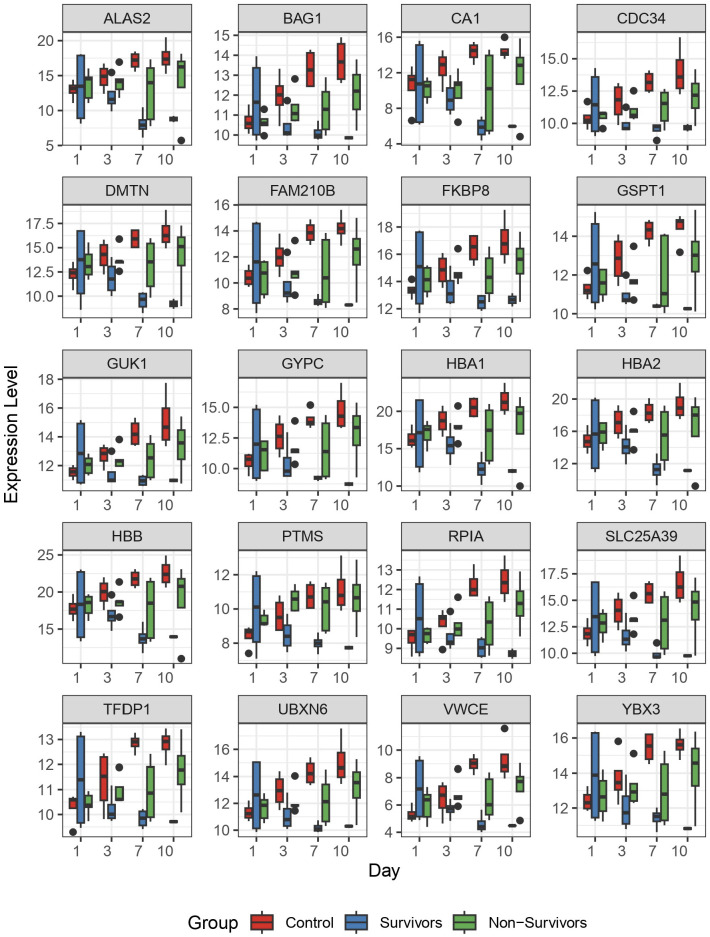
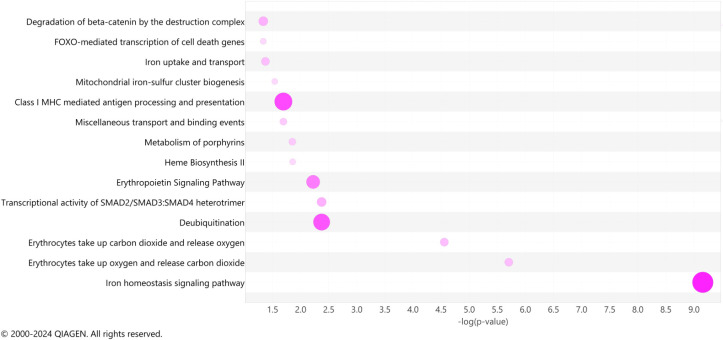
Results: We first compared transcriptomes between groups at individual timepoints and observed significant heterogeneity in differentially expressed genes (DEGs). Next, we utilized the likelihood ratio test to identify genes that exhibit different patterns of change over time between the 3 groups and identified 341 DEGs across time, including hemoglobin subunit alpha 2 (HBA1, HBA2), hemoglobin subunit beta (HBB), von Willebrand factor C and EGF domains (VWCE), and carbonic anhydrase 1 (CA1), which all demonstrated persistent upregulation in the COVID non-survivors compared to COVID survivors. Of the 341 DEGs, 314 demonstrated a similar pattern of persistent increased gene expression in COVID non-survivors compared to survivors, associated with canonical pathways of iron homeostasis signaling, erythrocyte interaction with oxygen and carbon dioxide, erythropoietin signaling, heme biosynthesis, metabolism of porphyrins, and iron uptake and transport.
Discussion: These findings describe significant differences in gene regulation during patient ICU course between survivors and non-survivors of COVID-19 ARDS. We identified multiple pathways that suggest heme and red blood cell metabolism contribute to disease outcomes. This approach is generalizable to larger cohorts and supports an approach of longitudinal sampling in ARDS molecular profiling studies, which may identify novel targetable pathways of injury and resolution.
Keywords: ARDS (acute respiratory disease syndrome); COVID - 19; RNA seq analysis; SARS-CoV-2; longitudinal analysis.
Copyright © 2024 Eltobgy, Johns, Farkas, Leuenberger, Cohen, Ho, Karow, Swoope, Pannu, Horowitz, Mallampalli, Englert and Bednash.
Conflict of interest statement
The authors declare that the research was conducted in the absence of any commercial or financial relationships that could be construed as a potential conflict of interest.
Figures
Similar articles
-
Whole blood RNA sequencing reveals a unique transcriptomic profile in patients with ARDS following hematopoietic stem cell transplantation.Respir Res. 2019 Jan 21;20(1):15. doi: 10.1186/s12931-019-0981-6. Respir Res. 2019. PMID: 30665420 Free PMC article.
-
Transpulmonary Plasma Endothelin-1 Arterial:Venous Ratio Differentiates Survivors from Non-Survivors in Critically Ill Patients with COVID-19-Induced Acute Respiratory Distress Syndrome.Int J Mol Sci. 2024 Oct 2;25(19):10640. doi: 10.3390/ijms251910640. Int J Mol Sci. 2024. PMID: 39408968 Free PMC article.
-
Plasma proteomic profiles correlate with organ dysfunction in COVID-19 ARDS.Physiol Rep. 2025 Apr;13(7):e70300. doi: 10.14814/phy2.70300. Physiol Rep. 2025. PMID: 40170544 Free PMC article.
-
Outcomes of critically ill COVID-19 survivors and caregivers: a case study-centred narrative review.Can J Anaesth. 2022 May;69(5):630-643. doi: 10.1007/s12630-022-02194-4. Epub 2022 Jan 31. Can J Anaesth. 2022. PMID: 35102495 Free PMC article. Review.
-
Understanding the pathophysiology of typical acute respiratory distress syndrome and severe COVID-19.Expert Rev Respir Med. 2022 Apr;16(4):437-446. doi: 10.1080/17476348.2022.2057300. Epub 2022 Mar 30. Expert Rev Respir Med. 2022. PMID: 35341424 Free PMC article. Review.
Cited by
-
A β-Thalassemia Cell Biobank: Updates, Further Validation in Genetic and Therapeutic Research and Opportunities During (and After) the COVID-19 Pandemic.J Clin Med. 2025 Jan 6;14(1):289. doi: 10.3390/jcm14010289. J Clin Med. 2025. PMID: 39797371 Free PMC article.
-
PBMCs gene expression predicts liver fibrosis regression after successful HCV therapy in HIV/HCV-coinfected patients.Front Pharmacol. 2025 Jan 22;15:1436198. doi: 10.3389/fphar.2024.1436198. eCollection 2024. Front Pharmacol. 2025. PMID: 39911830 Free PMC article.
-
Dynamic and reversible transcriptomic age shifts induced by COVID-19 in Korean whole blood.Aging (Albany NY). 2025 Jun 10;17(6):1484-1510. doi: 10.18632/aging.206270. Epub 2025 Jun 10. Aging (Albany NY). 2025. PMID: 40500114 Free PMC article.
-
Iron and the immune system.Nat Rev Immunol. 2025 Jun 16. doi: 10.1038/s41577-025-01193-y. Online ahead of print. Nat Rev Immunol. 2025. PMID: 40524018 Review.
References
-
- World Health Organization (WHO) . WHO COVID-19 dashboard. (2024). Available at: https://data.who.int/dashboards/covid19/cases.
MeSH terms
Substances
Grants and funding
LinkOut - more resources
Full Text Sources
Medical
Molecular Biology Databases
Miscellaneous