. 2024 Jul 23:9:100815.
doi: 10.1016/j.crfs.2024.100815. eCollection 2024.

Anthocyanins-rich cranberry extract attenuates DSS-induced IBD in an intestinal flora independent manner

Affiliations

Anthocyanins-rich cranberry extract attenuates DSS-induced IBD in an intestinal flora independent manner

Jun Wang et al. Curr Res Food Sci. .

Abstract

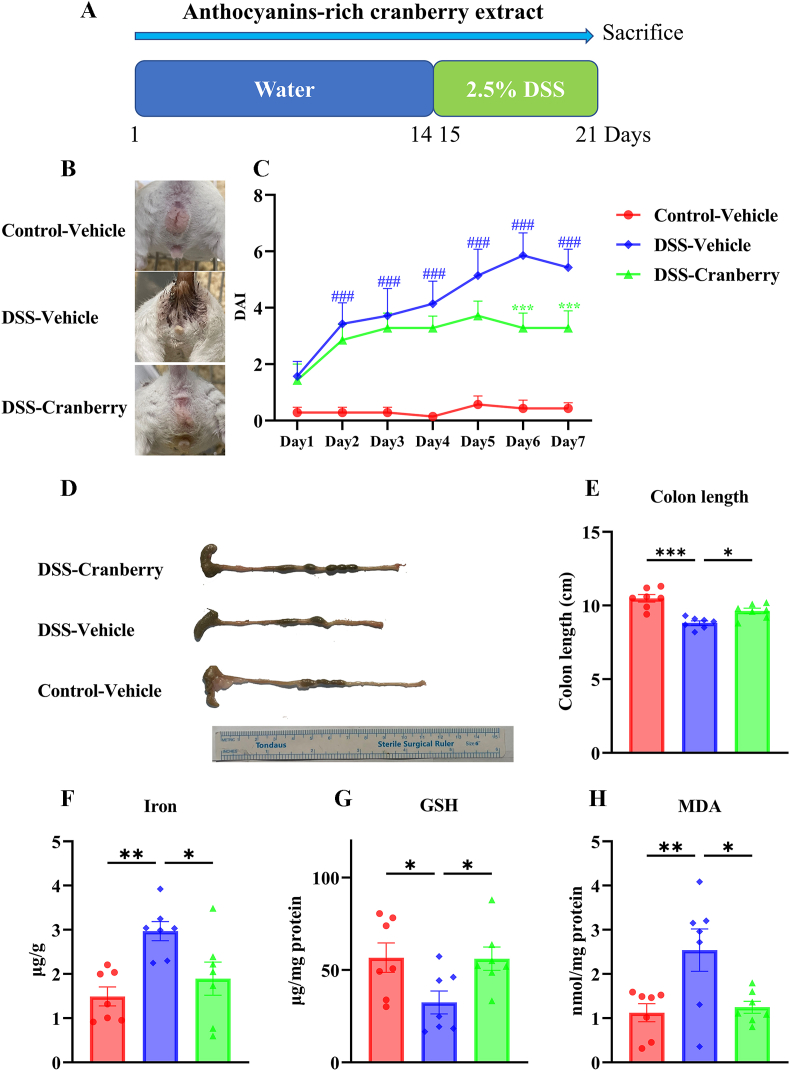
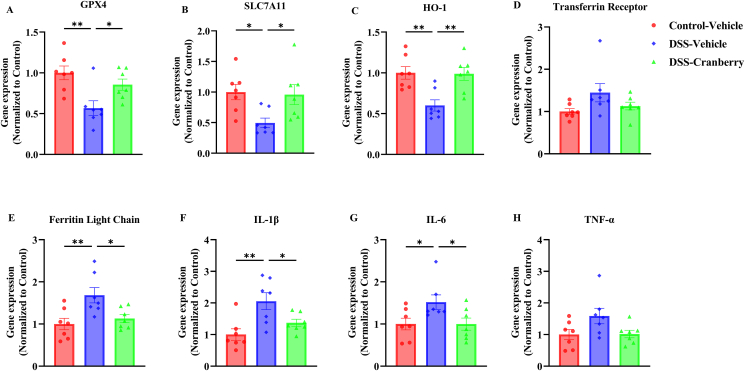
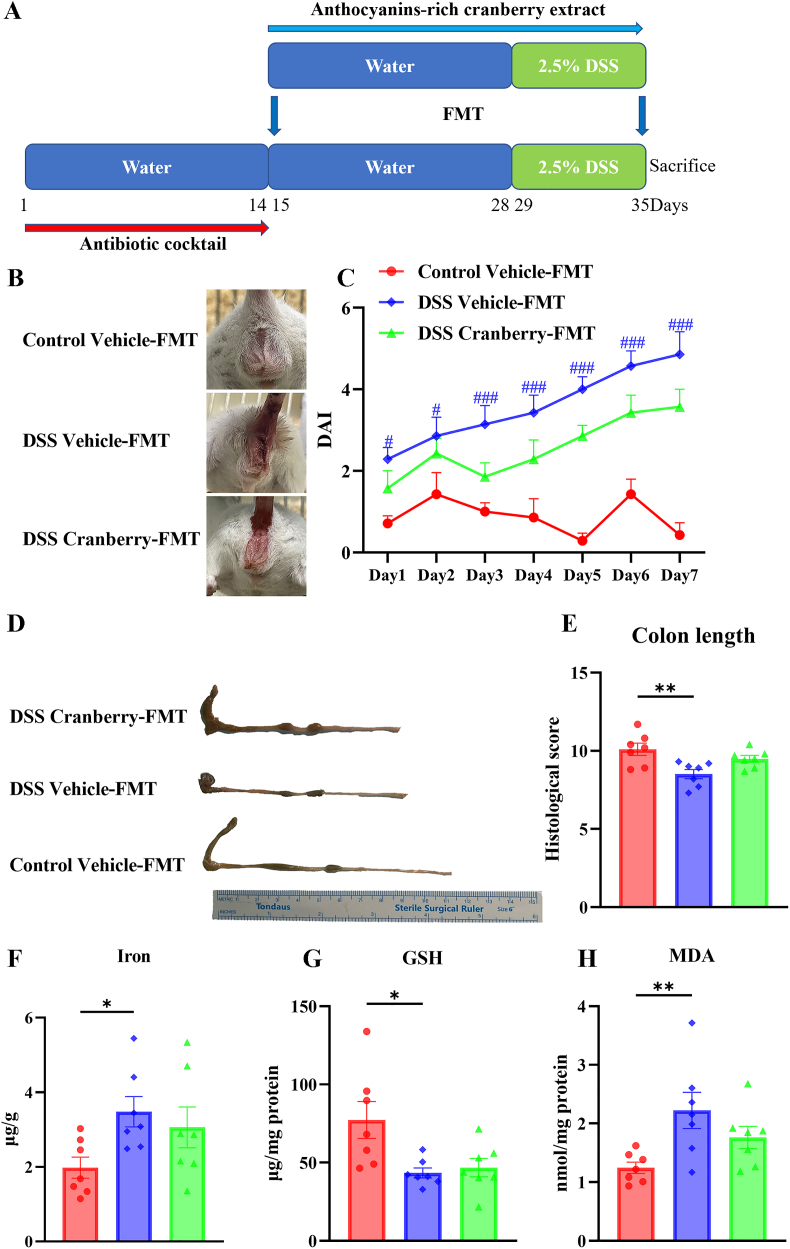
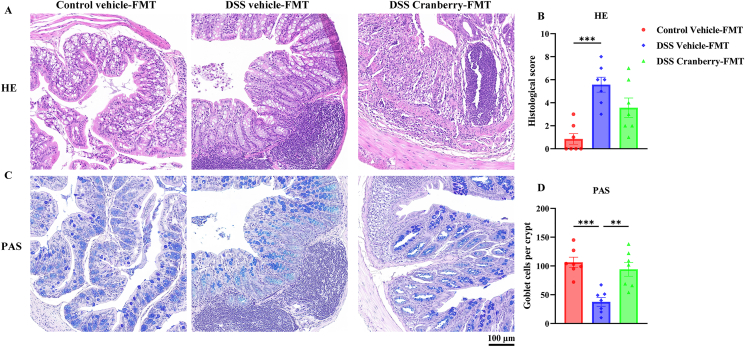
Cranberry is abundantly rich in anthocyanins, a type of flavonoid with potent antioxidant properties and the resistance against certain diseases. In this study, anthocyanin-rich cranberry extract was extracted, purified, and its components were analyzed. 92.18 % of anthocyanins was obtained and the total content of anthocyanins was 302.62 mg/g after AB-8 resin purification. Quantification analysis showed that the extract mainly contained cyanidin-3-galactoside, procyanidin B2 and procyanidin B4. Then we explored its effects on dextran sulfate sodium (DSS)-induced inflammatory bowel disease (IBD) in mice. The supplementation of cranberry extract resulted in an alleviation of IBD symptoms, evidenced by improvements in the disease activity index (DAI), restoration of colon length and colonic morphology. Cranberry extract reversed the elevated iron and malondialdehyde (MDA) levels and restored glutathione (GSH) levels in IBD mice. Further analysis revealed that cranberry modulated ferroptosis-associated genes and reduced expression of pro-inflammatory cytokines. Although cranberry influenced the intestinal flora balance by reducing Proteobacteria and Escherichia-Shigella, and increasing Lactobacillus, as well as enhancing SCFAs content, these effects were not entirely dependent on intestinal flora modulation, as indicated by antibiotic intervention and fecal microbiota transplantation (FMT) experiments. In conclusion, our findings suggest that the beneficial impact of cranberry extract on IBD may primarily involve the regulation of colonic ferroptosis, independent of significant alterations in intestinal flora.

Keywords: Anthocyanins; Cranberry; Fecal microbiota transplantation (FMT); Ferroptosis; Inflammatory bowel disease (IBD).


Conflict of interest statement

The authors declare that they have no known competing financial interests or personal relationships that could have appeared to influence the work reported in this paper.

Figures

Image 1
Graphical abstract
Fig. 1
Fig. 1
The total ion flow chromatogram of anthocyanin-rich cranberry.
Fig. 2
Fig. 2
The therapeutic impact of anthocyanin-rich cranberry extract on DSS-induced IBD in mice. (A) Experimental timeline depicting the administration of water or 2.5% DSS over 21 days with cranberry extract supplementation. (B) Representative images of mice from the Control-Vehicle, DSS-Vehicle, and DSS-Cranberry groups. (C) DAI scores over a 7-day period showing the progression of IBD symptoms and the attenuated effect of cranberry extract (###p < 0.001 vs. Control-Vehicle; ***p < 0.001 vs. DSS-Vehicle). (D) Comparison of colon morphology and (E) measured colon length among the three groups (*p < 0.05, ***p < 0.001). (F) Iron concentration, (G) GSH levels, and (H) MDA content in colonic tissue indicating oxidative stress and the antioxidative response induced by cranberry treatment (*p < 0.05, **p < 0.01). Data are presented as mean ± SEM (n = 7).
Fig. 3
Fig. 3
Histopathological analysis of colonic tissue from IBD-induced mice treated with cranberry extract. (A) HE staining of colon sections from Control-Vehicle, DSS-Vehicle, and DSS-Cranberry groups, showing the structural integrity and inflammatory cell infiltration. (B) Histological scores quantifying the degree of tissue damage and inflammation, with cranberry treatment significantly reducing histological severity in DSS-induced IBD mice (***p < 0.001, *p < 0.05 compared to DSS-Vehicle). (C) PAS staining indicating goblet cell abundance in the colonic epithelium. (D) Goblet cell counts per crypt, with cranberry treatment maintaining goblet cell numbers despite DSS-induced damage (***p < 0.001 compared to DSS-Vehicle). Scale bar = 100 μm. Data represent mean ± SEM (n = 7).
Fig. 4
Fig. 4
Microbial diversity and composition analysis in control and IBD-induced mice with and without cranberry extract treatment. (A) Principal coordinate analysis (PCoA) on OTU level showing distinct clustering of microbial communities among Control, IBD, and Cranberry-treated groups, with significant separation (PERMANOVA p < 0.001). (B) MDI revealing increased diversity in Cranberry-treated compared to IBD mice (***p < 0.001). (C) Phylum-level distribution of microbial communities highlighting shifts in bacterial populations. (D) Genus-level community composition depicted in stacked bar charts, with notable changes in key bacterial genera among groups. Relative abundance of bacterial phyla: (E) Bacteroidetes, (F) Firmicutes, (G) Proteobacteria, (H) Verrucomicrobia, and (I) Actinobacteria, and (J) Desulfobacterota, indicating significant variations. (K–U) Relative abundance of specific bacterial genera and groups, demonstrating alterations in the gut microbiome due to IBD and its modulation by cranberry treatment. Data are presented as mean ± SEM (n = 7); *p < 0.05, **p < 0.01, ***p < 0.001 indicate statistical significance across the groups.
Fig. 5
Fig. 5
Gene expression analysis in colonic tissue of IBD-induced mice treated with cranberry extract. (A–H) Relative expression levels of genes associated with ferroptosis and inflammation in Control-Vehicle, DSS-Vehicle, and DSS-Cranberry groups. (A) GPX4, (B) SLC7A11, (C) HO-1, and (E) ferritin light chain gene expressions were not significantly altered by cranberry treatment. (D) Transferrin receptor levels indicate no change. (F) IL-1β and (G) IL-6 show a significant decrease, whereas (H) TNF-α expression is not inhibited in the DSS-Cranberry group compared to DSS-Vehicle. Data presented as mean ± SEM (n = 7); *p < 0.05, **p < 0.01 indicate statistical significance.
Fig. 6
Fig. 6
SCFAs profiles and microbial correlations in IBD-induced mice treated with cranberry extract. Concentrations of various SCFAs in colonic contents: (A) Acetic acid, (B) Propionic acid, (C) Butyric acid, (D) Isobutyric acid, (E) Valeric acid, and (F) Isovaleric acid, with cranberry extract increasing the levels of butyric acid and total SCFAs (G) in comparison to the control and DSS-vehicle groups. Spearman correlation heatmaps showing the association between SCFAs and gut microbiota composition at the phylum level (H) and at a more detailed taxonomic resolution (I), with significant correlations highlighted (*p < 0.05, **p < 0.01, ***p < 0.001). Data are represented as mean ± SEM (n = 7).
Fig. 7
Fig. 7
Cranberry induced tight junction protein levels in colon. (A) Representative images depicting the expression of claudin-1, occludin, and ZO-1 in the Control-Vehicle, DSS-Vehicle, and DSS-Cranberry groups. Quantitative analysis of fluorescence intensity is shown for (B) claudin-1, (C) occludin, and (D) ZO-1. Cranberry increased the levels of claudin-1 (p = 0.053), occludin, ZO-1 compared to DSS-Vehicle group. Data points represent individual mice, with bar heights indicating the mean ± SEM (n = 7); *p < 0.05, **p < 0.01, ***p < 0.001 indicate statistical differences between groups.
Fig. 8
Fig. 8
Evaluation of the efficacy of cranberry with antibiotic pretreatment in DSS-induced IBD mice. (A) Schematic timeline showing the experimental design, including periods of water, DSS, antibiotic cocktail, and anthocyanins-rich cranberry extract administration until sacrifice. (B) Representative images of mice from each group depicting the progression of symptoms. (C) DAI over a 7-day period for Control-Vehicle, DSS-Vehicle, DSS-Cranberry, DSS-Antibiotics, and DSS-Antibiotics + Cranberry groups, indicating the effect of treatments on IBD symptoms (###p < 0.001 vs. Control-Vehicle; *p < 0.05, **p < 0.01, ***p < 0.001 vs. DSS-Vehicle). (D) Visual comparison of colon morphology and (E) quantification of colon length, showing cranberry extract's influence on colon size (*p < 0.05, **p < 0.01, ***p < 0.001). (F) HE and (G) PAS staining of colon sections for histopathological assessment. (H) Histological scores and (I) goblet cell counts per crypt demonstrate the protective role of cranberry against tissue damage and its effect on mucosal health, even after antibiotic pretreatment (***p < 0.001, **p < 0.01). Scale bar = 100 μm. Data represent mean ± SEM (n = 7).
Fig. 9
Fig. 9
Anthocyanin-rich cranberry extract FMT did not cause any alteration on DSS-induced IBD in mice. (A) Experimental timeline depicting the administration of water or 2.5% DSS over 21 days with cranberry FMT. (B) Representative images of mice from the Control Vehicle-FMT, DSS Vehicle-FMT, and DSS Cranberry-FMT groups. (C) DAI scores over a 7-day period showing the progression of IBD symptoms (#p < 0.05 and ###p < 0.001 vs. Control Vehicle-FMT). (D) Comparison of colon morphology and (E) measured colon length among the three groups (**p < 0.01). (F) Iron concentration, (G) GSH levels, and (H) MDA content in colonic tissue (*p < 0.05, **p < 0.01). Data are presented as mean ± SEM (n = 7).
Fig. 10
Fig. 10
Histopathological evaluation of colonic tissues following FMT with cranberry. (A) HE staining displays the colonic architecture across Control Vehicle-FMT, DSS Vehicle-FMT, and DSS Cranberry-FMT groups, indicating inflammation and structural integrity. (B) Histological scoring quantifies tissue damage, with cranberry-FMT did not decrease histological severity compared to DSS Vehicle-FMT. (C) PAS staining highlights goblet cell density within the colonic epithelium. (D) Goblet cell counts per crypt demonstrate no alteration between cranberry-FMT and vehicle-FMT groups. Scale bar = 100 μm. Data are expressed as mean ± SEM (n = 7) with statistical significance denoted as **p < 0.01, ***p < 0.001 compared to the DSS Vehicle-FMT group.
Fig. 11
Fig. 11
Gene expression analysis of ferroptosis and inflammation-related markers in FMT-treated mice. (A–H) Bar graphs representing relative gene expression levels in colonic tissues from Control Vehicle-FMT, DSS Vehicle-FMT, and DSS Cranberry-FMT groups: (A) GPX4, (B) SLC7A11, (C) HO-1, (D) Transferrin Receptor, (E) Ferritin Light Chain, (F) IL-1β, (G) IL-6, and (H) TNF-α. Cranberry-FMT did not significantly alter the expression of ferroptosis-related genes except for a decrease in TNF-α. Data are normalized to control and presented as mean ± SEM (n = 7); *p < 0.05, **p < 0.01, ***p < 0.001 indicate statistical significance compared to the DSS-vehicle group.
Fig. 12
Fig. 12
Immunofluorescence analysis of ferroptosis-related proteins in colonic tissues following FMT treatment. (A) Representative images depicting the expression of pNrf2, GPX4, SLC7A11, ferritin light chain, and transferrin receptor in the Control Vehicle-FMT, DSS Vehicle-FMT, and DSS Cranberry-FMT groups. The images show the localization and intensity of protein expression, with red indicating the specific protein and blue representing the cell nuclei. Quantitative analysis of fluorescence intensity is shown for (B) pNrf2, (C) GPX4, (D) SLC7A11, (E) ferritin light chain, and (F) transferrin receptor, demonstrating a non-significant alteration in these ferroptosis associated proteins in the DSS Cranberry-FMT group compared to DSS Vehicle-FMT. Data are normalized to control values and presented as mean ± SEM (n = 7); *p < 0.05, **p < 0.01 indicate statistical significance. Scale bar = 100 μm. (For interpretation of the references to color in this figure legend, the reader is referred to the Web version of this article.)
Fig. 13
Fig. 13
SCFAs concentrations in fecal samples from FMT-treated mice. The bar graphs illustrate the levels of (A) Acetic acid, (B) Propionic acid, (C) Butyric acid, (D) Isobutyric acid, (E) Valeric acid, (F) Isovaleric acid, and (G) Total SCFAs measured in Control Vehicle-FMT, DSS Vehicle-FMT, and DSS Cranberry-FMT groups. Cranberry-FMT significantly increased the concentrations of butyric acid and total SCFAs compared to DSS Vehicle-FMT, whereas other individual SCFA levels did not show a significant increase. Data points represent individual mice, with bar heights indicating the mean ± SEM (n = 7); *p < 0.05, **p < 0.01, ***p < 0.001 indicate statistical differences between groups.
Fig. 14
Fig. 14
Tight junction protein levels in colonic samples from cranberry FMT-treated mice. (A) Representative images depicting the expression of claudin-1, occludin, and ZO-1 in the Control Vehicle-FMT, DSS Vehicle-FMT, and DSS Cranberry-FMT groups. Quantitative analysis of fluorescence intensity is shown for (B) claudin-1, (C) occludin, and (D) ZO-1. Cranberry-FMT significantly increased the levels of ZO-1 compared to DSS Vehicle-FMT, whereas claudin-1 and occludin levels did not show a significant increase. Data points represent individual mice, with bar heights indicating the mean ± SEM (n = 7); *p < 0.05, **p < 0.01, ***p < 0.001 indicate statistical differences between groups.

Similar articles

Cited by

References

    1. Abdelhalim K.A. Short-chain fatty acids (SCFAs) from gastrointestinal disorders, metabolism, epigenetics, central nervous system to cancer - a mini-review. Chem. Biol. Interact. 2024;388 - PubMed
    1. Alemany-Cosme E., Saez-Gonzalez E., Moret I., Mateos B., Iborra M., Nos P., Sandoval J., Beltran B. Oxidative stress in the pathogenesis of crohn's disease and the interconnection with immunological response, microbiota, external environmental factors, and epigenetics. Antioxidants. 2021;10 - PMC - PubMed
    1. Barnes J.S., Nguyen H.P., Shen S., Schug K.A. General method for extraction of blueberry anthocyanins and identification using high performance liquid chromatography-electrospray ionization-ion trap-time of flight-mass spectrometry. J. Chromatogr. A. 2009;1216:4728–4735. - PubMed
    1. Breugelmans T., Van Spaendonk H., De Man J.G., De Schepper H.U., Jauregui-Amezaga A., Macken E., Linden S.K., Pintelon I., Timmermans J.P., De Winter B.Y., Smet A. In-depth study of transmembrane mucins in association with intestinal barrier dysfunction during the course of T cell transfer and DSS-induced colitis. J Crohns Colitis. 2020;14:974–994. - PubMed
    1. Cai X., Han Y., Gu M., Song M., Wu X., Li Z., Li F., Goulette T., Xiao H. Dietary cranberry suppressed colonic inflammation and alleviated gut microbiota dysbiosis in dextran sodium sulfate-treated mice. Food Funct. 2019;10:6331–6341. - PMC - PubMed

LinkOut - more resources