. 2024 Oct;11(39):e2401351.
doi: 10.1002/advs.202401351. Epub 2024 Aug 20.

Trapped in Endosome PEGylated Ultra-Small Iron Oxide Nanoparticles Enable Extraordinarily High MR Imaging Contrast for Hepatocellular Carcinomas

Affiliations

Trapped in Endosome PEGylated Ultra-Small Iron Oxide Nanoparticles Enable Extraordinarily High MR Imaging Contrast for Hepatocellular Carcinomas

Dandan Zhou et al. Adv Sci (Weinh). 2024 Oct.

Abstract

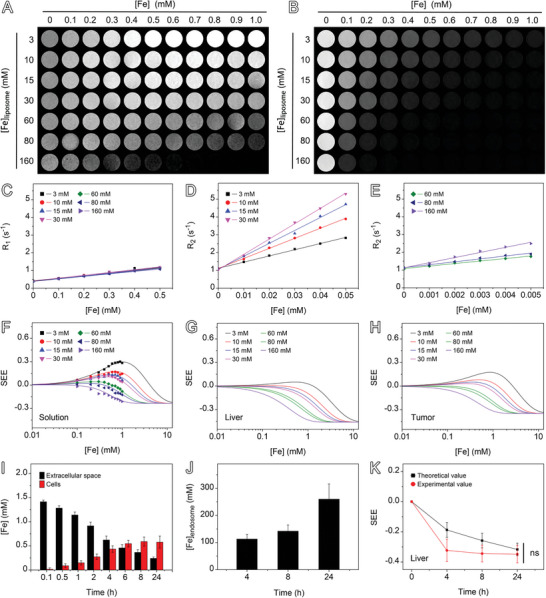
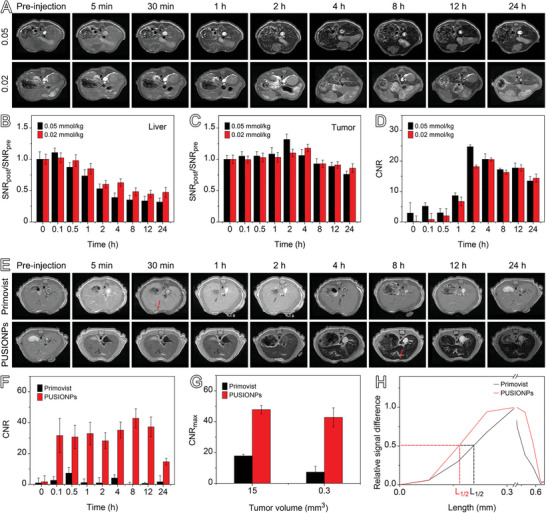
The early diagnosis of hepatocellular carcinomas (HCCs) remains challenging in the clinic. Primovist-enhanced magnetic resonance imaging (MRI) aids HCC diagnosis but loses sensitivity for tumors <2 cm. Therefore, developing advanced MRI contrast agents is imperative for improving the diagnostic accuracy of HCCs in very-early-stage. To address this challenge, PEGylated ultra-small iron oxide nanoparticles (PUSIONPs) are synthesized and employed as liver-specific T1 MRI contrast agents. Intravenous delivery produces simultaneous hyperintense HCC and hypointense hepatic parenchyma signals on T1 imaging, creating an extraordinarily high tumor-to-liver contrast. Systematic studies uncover PUSIONP distribution in hepatic parenchyma, HCC lesions at the organ, tissue, cellular, and subcellular levels, revealing endosomal confinement of PUSIONP without aggregation. By mimicking such situations, the dependency of relaxometric properties on local PUSIONP concentration is investigated, emphasizing the key role of different endosomal concentrations in liver and tumor cells for high tumor-to-liver contrast and clear tumor boundaries. These findings offer exceptional imaging capabilities for early HCC diagnosis, potentially benefiting real HCC patients.

Keywords: contrast agent; early diagnosis; hepatocellular carcinoma; iron oxide nanoparticle.


Conflict of interest statement

The authors declare no conflict of interest.

Figures

Figure 1
Figure 1
Characterization of PUSIONPs. A) TEM image and size distribution histogram of hydrophilic iron oxide nanoparticles (the scale bar corresponds to 20 nm). B) Hydrodynamic size profile of PUSIONPs. C) Temporal evolution of the hydrodynamic size and zeta potential of PUSIONPs in water. Data are presented as mean ± SD, n = 3, with p‐values calculated using unpaired Student's t‐test. The mean values at all other time points were not statistically different from the mean values at 0 h (p > 0.05). D) T1‐ and T2‐weighted images of aqueous solutions containing different concentrations of Magnevist, Primovist, and PUSIONPs. E,F) Iron concentration‐dependent R1 (E) and R2 (F) for extracting longitudinal and transverse relaxivities through linear regression fitting.
Figure 2
Figure 2
MRI of mice bearing orthotopic HCC xenografts with PUSIONPs. A) T1‐weighted MR images acquired with the FSE sequence at different time points after intravenous injection of Primovist and PUSIONPs. B) Enhancement patterns showing the advantage of PUSIONPs over Primovist on T1‐weighted MRI of HCCs shown as a round area in the liver. C) Temporal variations in CNR obtained with Primovist and PUSIONPs. Data are presented as mean ± SD, n = 1. The mean represents the signal intensity in the region of interest (ROI), while the SD denotes the standard deviation calculated from the ROI of MR images. D) Profiles of the relative signal drawn along the red lines in the MRI images in panel A.
Figure 3
Figure 3
Biodistribution of PUSIONPs in liver and tumor. A–C) SPECT/CT images of HCC‐bearing mice acquired after intravenous injection of 99mTc‐labeled PUSIONPs (A), together with γ‐signals of the liver (B) and tumor (C), determined at different time points post‐injection. D) Temporal concentrations of PUSIONPs in the liver and tumor. E) Theoretical SEE‐[Fe] curves obtained by assuming that PUSIONPs are evenly distributed in both the liver and tumor. F,G) Comparisons of theoretically predicted and experimentally determined SEE values of liver (F) and tumor (G) at different time points post‐injection. Data are presented as mean ± SD, n = 3. p‐values were calculated using a unpaired Student's t‐test. Statistical significance is indicated as follows: **p < 0.01, *p ≤ 0.05, ns = not significant (p > 0.05).
Figure 4
Figure 4
Distribution of PUSIONPs at tissue and cellular level. A) Immunofluorescence images of liver tissues extracted at different time points post intravenous injection of PUSIONPs‐FITC (the scale bar corresponds to 10 µm). Each condition was replicated in three different mice (biological replicates), n = 3. B) Percentage of PUSIONPs‐positive cells in the liver and tumor at different time points post‐injection. Data are presented as mean, n = 3. C,D) Temporal variations in PUSIONPs‐positive cell ratios for each kind of liver cell (C) and tumor cell (D). Data are presented as mean, n = 3.
Figure 5
Figure 5
Distribution of PUSIONPs at subcellular level. TEM images (first and second rows) and iron mapping of liver tissues through STEM (third row) taken at different time points post‐injection of PUSIONPs to show the distribution of PUSIONPs at the cellular level. The black scale bar corresponds to 2 µm, and the white scale bar corresponds to 200 nm.
Figure 6
Figure 6
Experimentally determined and theoretically derived SEE values. A,B) T1‐weighted (A) and T2‐weighted (B) MR images of aqueous solutions of liposomes containing PUSIONPs with different [Fe]liposome and [Fe]. C–E) Experimental data together with the corresponding theoretical fittings (solid lines) for extracting r 1 (C) and r 2 (D‐E) of PUSIONPs‐in‐liposome. F) Comparison of experimentally determined SEE values with the theoretical SEE‐[Fe] curves of liposomes containing different concentrations of PUSIONPs, obtained with Equation 2 by employing the relaxivity values extracted from the data in panels (C–E). g,h) Theoretical SEE‐[Fe] curves for liver (G) and tumor (H) at given [Fe]endosome ranging from 3 to 160 mm. I) Temporal iron concentration in liver cells and extracellular spaces after intravenous injection of PUSIONPs. Data are presented as mean ± SD, n = 3. J) Temporal [Fe]endosome in liver cells. Data are presented as mean ± SD, n = 3. K) Experimentally determined and theoretically derived SEE values of liver for different time points post‐injection of PUSIONPs. Data are presented as mean ± SD, n = 3, p‐value was calculated using unpaired Student's t test, ns = not significant (p > 0.05).
Figure 7
Figure 7
Schematic drawing of the mechanism for HCC Diagnosis. Schematic drawing showing the mechanism underlying the extremely high tumor‐to‐liver contrast in PUSIONPs‐enhanced MRI of HCCs.
Figure 8
Figure 8
Dose‐dependent MR imaging of PUSIONPs. A) T1‐weighted MR images of HCC‐bearing mice acquired before and at different time points after intravenously injecting PUSIONPs at doses of 0.05 and 0.02 mmol Fe per kg body weight, respectively. B,C) Relative SNR values of the hepatic parenchyma (B) and tumor (C) at different time points post‐injection. D) CNR values of the tumor site after injecting PUSIONPs at different doses. E) T1‐weighted MR images of a mouse bearing HCC of 0.3 mm3 enhanced by Primovist and PUSIONPs, respectively, with a dose of 0.1 mmol Gd/Fe per kg body weight. F) Temporal CNR values of the tiny tumor. G) The maximum CNR values for HCCs of different sizes obtained with Primovist and PUSIONPs. H) Profiles of the relative signal drawn along the red lines in the MRI images in panel (E). For insets (B–D) and (F,G), data are presented as mean ± SD, n = 1. The mean stands for signal intensity in the ROI and SD stands for the standard deviation analyzed from the ROI of MR images.
Figure 9
Figure 9
Theoretical SEE prediction for HCC patients. A) Representative T1‐weighted, T2‐weighted, T1 mapping, and T2 mapping images of an HCC patient acquired by MRI scans without contrast agent. B) Relaxation time data for the liver and tumor regions from 15 HCC patients. Data are presented as mean ± SD, n = 15. C,D) Theoretical curves depicting SEE as a function of average [Fe] for the liver (C) and tumor (D) at specified enrichment levels, with [Fe]endosome exceeding the average [Fe] in the liver or tumor matrix by 50–500 times.

Similar articles

Cited by

References

    1. C. Global Burden of Disease Cancer , JAMA Oncol. 2019, 5, 1749. - PMC - PubMed
    1. a) Siegel R. L., Miller K. D., Fuchs H. E., Jemal A., CA Cancer J. Clin. 2022, 72, 7; - PubMed
    2. b) Lu J., Sun J., Li F., Wang J., Liu J., Kim D., Fan C., Hyeon T., Ling D., J. Am. Chem. Soc. 2018, 140, 10071; - PubMed
    3. c) Lee Y. L., Lee J. M., Lee J. S., Lee H. Y., Park B. H., Kim Y. H., Han J. K., Choi B. I., Radiology 2015, 275, 97; - PubMed
    4. d) Forner A., Llovet J. M., Bruix J., Lancet 2012, 379, 1245. - PubMed
    1. a) Galle P. R., Forner A., Llovet J. M., Mazzaferro V., Piscaglia F., Raoul J. L., Schirmacher P., Vilgrain V., J. Hepatol. 2018, 69, 182; - PubMed
    2. b) Marrero J. A., Kulik L. M., Sirlin C. B., Zhu A. X., Finn R. S., Abecassis M. M., Roberts L. R., Heimbach J. K., Hepatology 2018, 68, 723; - PubMed
    3. c) Reig M., Forner A., Rimola J., Ferrer‐Fabrega J., Burrel M., Garcia‐Criado A., Kelley R. K., Galle P. R., Mazzaferro V., Salem R., Sangro B., Singal A. G., Vogel A., Fuster J., Ayuso C., Bruix J., J. Hepatol. 2022, 76, 681; - PMC - PubMed
    4. d) Nur Syafiqah Abu Bakar F. S. S., Mahmud M. H., Healthscope 2019, 1, 143;
    5. e) Jia Z., Song L., Zang F., Song J., Zhang W., Yan C., Xie J., Ma Z., Ma M., Teng G., Gu N., Zhang Y., Theranostics 2016, 6, 1780. - PMC - PubMed
    1. Bruix J., Gores G. J., Mazzaferro V., Gut 2014, 63, 844. - PMC - PubMed
    1. El‐Serag H. B., Marrero J. A., Rudolph L., Reddy K. R., Gastroenterology 2008, 134, 1752. - PubMed

MeSH terms

LinkOut - more resources