. 2024 Aug;13(16):e70044.
doi: 10.1002/cam4.70044.

Epigenome-wide association study of prostate cancer in African American men identified differentially methylated genes

Affiliations

Epigenome-wide association study of prostate cancer in African American men identified differentially methylated genes

Anders Berglund et al. Cancer Med. 2024 Aug.

Abstract

Introduction: Men with African ancestry have the highest incidence and mortality rates of prostate cancer (PCa) worldwide.

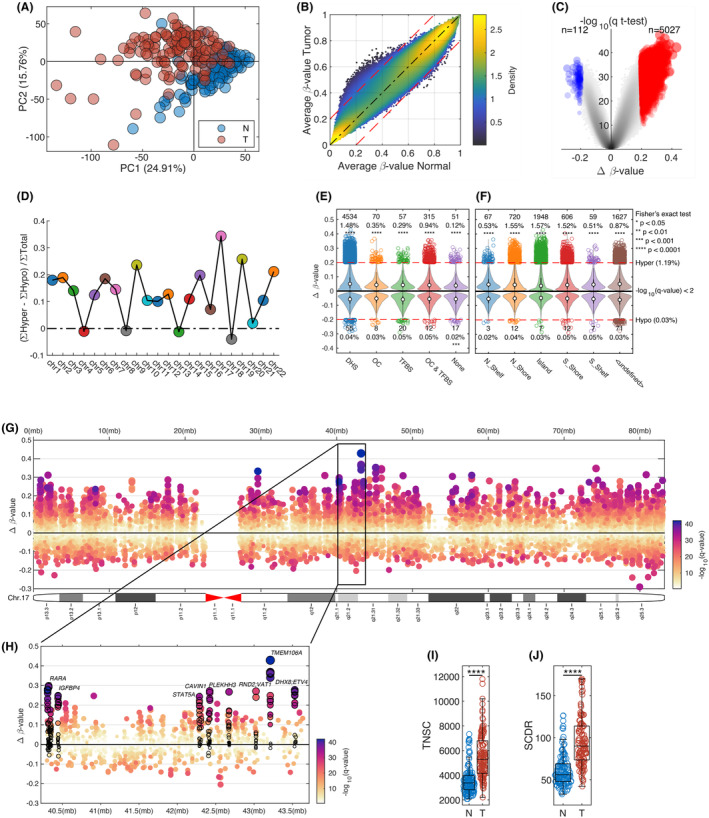
Methods: This study aimed to identify differentially methylated genes between tumor vs. adjacent normal and aggressive vs. indolent PCa in 121 African American patients. Epigenome-wide DNA methylation patterns in tumor DNA were assessed using the human Illumina Methylation EPIC V1 array.

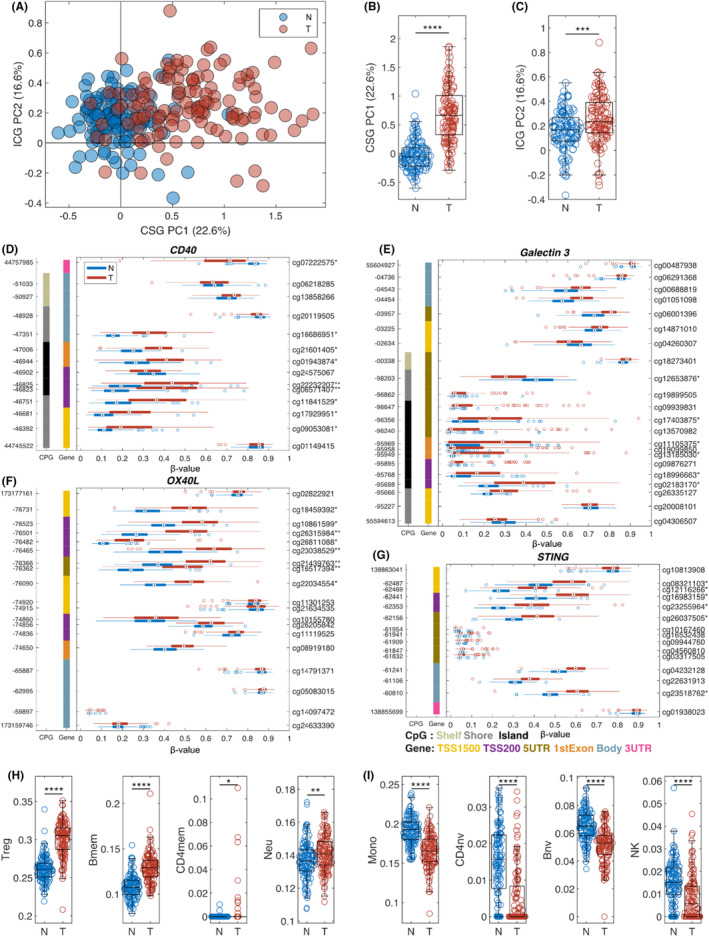
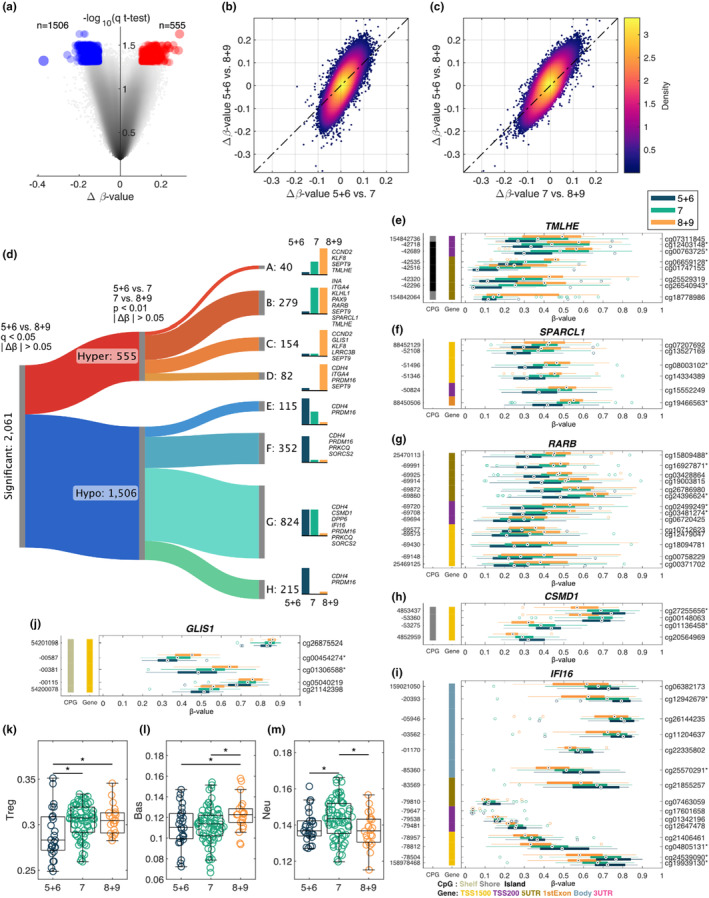
Results: Around 5,139 differentially methylated CpG-sites (q < 0.01, lΔβl > 0.2) were identified when comparing normal vs. tumor, with an overall trend of hypermethylation in prostate tumors. Multiple representative differentially methylated regions (DMRs), including immune-related genes, such as CD40, Galectin3, OX40L, and STING, were detected in prostate tumors when compared to adjacent normal tissues. Based on an epigenetic clock model, we observed that tumors' total number of stem cell divisions and the stem cell division rate were significantly higher than adjacent normal tissues. Regarding PCa aggressiveness, 2,061 differentially methylated CpG-sites (q < 0.05, lΔβl > .05) were identified when the grade group (GG)1 was compared with GG4/5. Among these 2,061 CpG sites, 155 probes were consistently significant in more than one comparison. Among these genes, several immune system genes, such as COL18A1, S100A2, ITGA4, HLA-C, and ADCYAP1, have previously been linked to tumor progression in PCa.

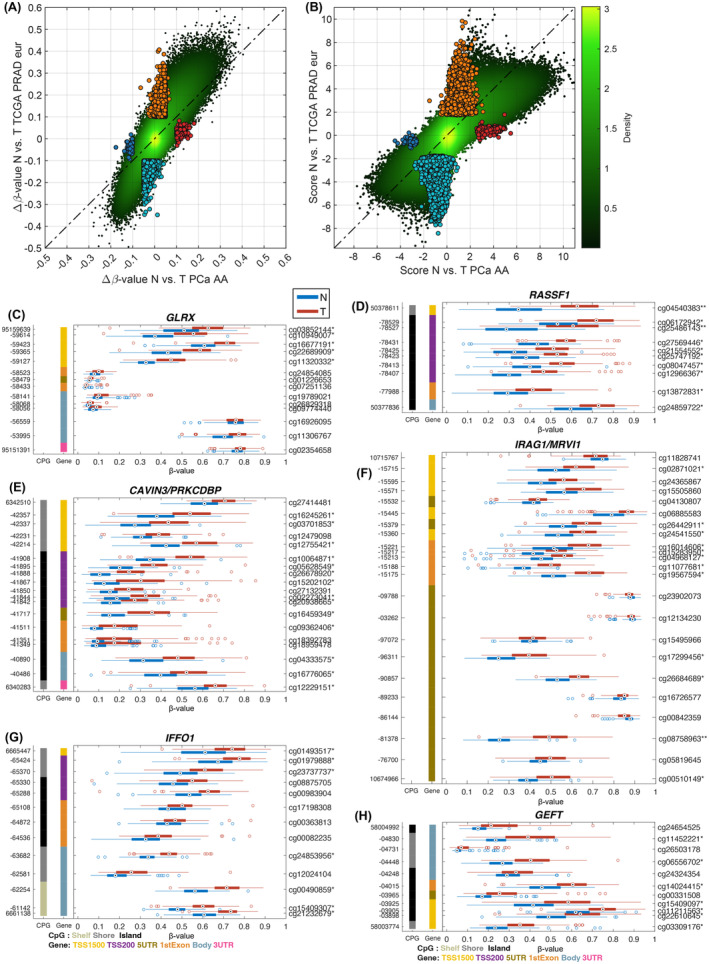
Conclusion: Several differentially methylated genes involved in immune-oncologic pathways associated with disease risk or aggressiveness were identified. In addition, 261 African American-specific differentially methylated genes related to the risk of PCa were identified. These results can shedlight on potential mechanisms contributing to PCa disparities in the African American Population.

Keywords: epidemiology; epigenetics; methylation; prostate cancer.


Figures

FIGURE 1
FIGURE 1
Hypermethylation in AA PCa compared to adjacent normal tissue. (A) A principal component analysis (PCA) using all CpG sites shows the separation of tumor (red circles) and normal tissue (blue circles). (B) Density scatter plot average β‐value for normal samples versus tumor samples. (C) Volcano plot comparing Normal versus tumor with Δβ‐value on the x‐axis and multiple tested corrected p‐value on the y‐axis. (D) Degree of hypermethylation across 22 chromosomes. (E) TFBS, Distribution of significant DNase hypersensitivity (DHS) CpG‐probes, and open chromatin (OC) probes, (F) Distribution of significant CpG‐probes across the different part of CpG‐islands. (G) Chromosome plot of methylation changes between normal and tumor for chromosome 17. Δβ‐value on the y‐axis, color based on q‐value, and size based Δβ‐value. (H) Zoomed in region of chromosome 17 (40,300,000–43,640,000) with a few selected genes highlighted (ETV4, RARA, IGFBP4, TMEM106A, STAT5A, RND2, CAVIN1, PLEKHH3, VAT1, and DHX8). Box plots comparing (I) TNSC per stem cell and (J) SCDR for normal versus tumor. ****p < 0.0001.
FIGURE 2
FIGURE 2
Epigenetic changes in immune genes for AA PCa. (A) Scatter plot of prediction using immune synapse principal component analysis (PCA) model with adjacent normal tissue in blue and prostate cancer (PCa) in red. Boxplots of normal and tumor samples for co‐stimulatory genes (CSGs) (B) and immune checkpoint gene (ICG) (C). Several genes show a significant difference in methylation for the immune synapse genes (***p < 0.001, ****p < 0.0001). Individual gene structure methylation (GSM)‐plots for (D) CD40, (E) Galectin 3, (F) OX40L, and (G) STING (*q < 0.05 and |Δβ| > 0.1, **q < 0.01 and |Δβ| > 0.2). Boxplots comparing normal versus tumor for immune cell types with an increased amount in (H), and decreased amount in (I) in tumor compared to normal (**p < 0.01, ***p < 0.001, ****p < 0.0001).
FIGURE 3
FIGURE 3
Comparing methylation changes in PCa AA to European cohorts. Density scatter plot comparing Δβ‐value (A) and score (B) (combining Δβ‐value and −log10(p‐value)) for TCGA PRAD European (y‐axis) and our PCa AA (x‐axis) between normal and tumor. Highlighted markers indicate unique CpG‐probes that are only significant in one of the groups. Individual GSP plots for genes that are only significant in our PCa AA cohort when comparing normal versus tumor, (C) GLRX, (D) RASSF1, (E) CAVIN3, (F) IRAG1, (G) IFFO1, and (H) GEFT (*q < 0.05 and |Δβ| > 0.1, **q < 0.01 and |Δβ| > 0.2).
FIGURE 4
FIGURE 4
Methylation changes based on Gleason score. (a) Volcano plot describing the methylation changes between samples with GG1 versus GG4/5, ∆β‐value on the x‐axis and multiple tested corrected p‐value on the y‐axis. Density scatter plot comparing the ∆β‐value for GG1 versus GG4/5 and (b) ∆β‐value for GG1 versus GG2/3 and (c) ∆β‐value for GG2/3 versus GG4/5. (d) Sankey diagram classifying significant (GG1 vs. GG4/5) CpG‐probes into eight different categories based on their changes when comparing GG1 versus GG2/3 and GG2/3 versus GG4/5. A, hypermethylated CpG‐probes that are significant in both GG1 versus GG2/3 and GG2/3 versus GG4/5. B, hypermethylated CpG‐probes that are significant in GG1 versus GG2/3. C, hypermethylated CpG‐probes that are significant in GG2/3 versus GG4/5. D, hypomethylated CpG‐probes that are not significant in any of the other comparisons. E, hypo‐methylated CpG‐probes that are significant in both GG1 versus GG2/3 and GG2/3 versus GG4/5. F, hypermethylated CpG‐probes that are significant in GG1 versus GG2/3. G, hypomethylated CpG‐probes that are significant in GG2/3 versus GG4/5. H, hypomethylated CpG‐probes that are not significant in any of the other comparisons. Selected genes are listed for each category. gene structure methylation (GSM) plots comparing the methylation levels between the three groups for (e) TMLHE, (f) SPARCL1, (g) RARB, (h) CSMD1, (i) IFI16, (j) GLIS1 (*q < 0.05 and |∆β| > 0.1 for GG1 vs. GG4 + 5). Boxplots comparing GG1 versus GG2/3 versus GG4/5 for immune cell types with (k) Treg, (l) Basophiles, and (m) Neutrophiles, *p < 0.05.

References

    1. Massie CE, Mills IG, Lynch AG. The importance of DNA methylation in prostate cancer development. J Steroid Biochem Mol Biol. 2017;166:1‐15. - PubMed
    1. Xu N, Wu YP, Ke ZB, et al. Identification of key DNA methylation‐driven genes in prostate adenocarcinoma: an integrative analysis of TCGA methylation data. J Transl Med. 2019;17(1):311. - PMC - PubMed
    1. Carleton NM, Zhu G, Gorbounov M, et al. PBOV1 as a potential biomarker for more advanced prostate cancer based on protein and digital histomorphometric analysis. Prostate. 2018;78(7):547‐559. - PMC - PubMed
    1. Komura K, Sweeney CJ, Inamoto T, Ibuki N, Azuma H, Kantoff PW. Current treatment strategies for advanced prostate cancer. Int J Urol. 2018;25(3):220‐231. - PMC - PubMed
    1. Giudice A, Montella M, Boccellino M, et al. Epigenetic changes induced by green tea catechins a re associated with prostate cancer. Curr Mol Med. 2017;17(6):405‐420. - PubMed

Substances