DeepEnzyme: a robust deep learning model for improved enzyme turnover number prediction by utilizing features of protein 3D-structures
- PMID: 39162313
- PMCID: PMC11880767
- DOI: 10.1093/bib/bbae409
DeepEnzyme: a robust deep learning model for improved enzyme turnover number prediction by utilizing features of protein 3D-structures
Abstract
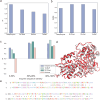
Turnover numbers (kcat), which indicate an enzyme's catalytic efficiency, have a wide range of applications in fields including protein engineering and synthetic biology. Experimentally measuring the enzymes' kcat is always time-consuming. Recently, the prediction of kcat using deep learning models has mitigated this problem. However, the accuracy and robustness in kcat prediction still needs to be improved significantly, particularly when dealing with enzymes with low sequence similarity compared to those within the training dataset. Herein, we present DeepEnzyme, a cutting-edge deep learning model that combines the most recent Transformer and Graph Convolutional Network (GCN) to capture the information of both the sequence and 3D-structure of a protein. To improve the prediction accuracy, DeepEnzyme was trained by leveraging the integrated features from both sequences and 3D-structures. Consequently, DeepEnzyme exhibits remarkable robustness when processing enzymes with low sequence similarity compared to those in the training dataset by utilizing additional features from high-quality protein 3D-structures. DeepEnzyme also makes it possible to evaluate how point mutations affect the catalytic activity of the enzyme, which helps identify residue sites that are crucial for the catalytic function. In summary, DeepEnzyme represents a pioneering effort in predicting enzymes' kcat values with improved accuracy and robustness compared to previous algorithms. This advancement will significantly contribute to our comprehension of enzyme function and its evolutionary patterns across species.
Keywords: deep learning; enzyme turnover number; graph convolutional network; protein 3D-structure.
© The Author(s) 2024. Published by Oxford University Press.
Figures


Similar articles
-
NNKcat: deep neural network to predict catalytic constants (Kcat) by integrating protein sequence and substrate structure with enhanced data imbalance handling.Brief Bioinform. 2025 May 1;26(3):bbaf212. doi: 10.1093/bib/bbaf212. Brief Bioinform. 2025. PMID: 40370097 Free PMC article.
-
MPEK: a multitask deep learning framework based on pretrained language models for enzymatic reaction kinetic parameters prediction.Brief Bioinform. 2024 Jul 25;25(5):bbae387. doi: 10.1093/bib/bbae387. Brief Bioinform. 2024. PMID: 39129365 Free PMC article.
-
Robust enzyme discovery and engineering with deep learning using CataPro.Nat Commun. 2025 Mar 20;16(1):2736. doi: 10.1038/s41467-025-58038-4. Nat Commun. 2025. PMID: 40108140 Free PMC article.
-
Deep learning methods for protein function prediction.Proteomics. 2025 Jan;25(1-2):e2300471. doi: 10.1002/pmic.202300471. Epub 2024 Jul 12. Proteomics. 2025. PMID: 38996351 Free PMC article. Review.
-
A structural perspective on enzymes and their catalytic mechanisms.Curr Opin Struct Biol. 2025 Jun;92:103040. doi: 10.1016/j.sbi.2025.103040. Epub 2025 Mar 29. Curr Opin Struct Biol. 2025. PMID: 40158299 Review.
Cited by
-
Advances in Microbial Alkaline Proteases: Addressing Industrial Bottlenecks Through Genetic and Enzyme Engineering.Appl Biochem Biotechnol. 2025 Aug;197(8):4861-4896. doi: 10.1007/s12010-025-05270-9. Epub 2025 May 15. Appl Biochem Biotechnol. 2025. PMID: 40372653 Review.
-
Enzyme catalytic efficiency prediction: employing convolutional neural networks and XGBoost.Front Artif Intell. 2024 Oct 21;7:1446063. doi: 10.3389/frai.2024.1446063. eCollection 2024. Front Artif Intell. 2024. PMID: 39498388 Free PMC article.
-
NNKcat: deep neural network to predict catalytic constants (Kcat) by integrating protein sequence and substrate structure with enhanced data imbalance handling.Brief Bioinform. 2025 May 1;26(3):bbaf212. doi: 10.1093/bib/bbaf212. Brief Bioinform. 2025. PMID: 40370097 Free PMC article.
-
A structure-oriented kinetics dataset of enzyme-substrate interactions.Sci Data. 2025 Aug 26;12(1):1489. doi: 10.1038/s41597-025-05829-5. Sci Data. 2025. PMID: 40858593 Free PMC article.
-
IECata: interpretable bilinear attention network and evidential deep learning improve the catalytic efficiency prediction of enzymes.Brief Bioinform. 2025 May 1;26(3):bbaf283. doi: 10.1093/bib/bbaf283. Brief Bioinform. 2025. PMID: 40548541 Free PMC article.
References
-
- Nilsson A, Nielsen J, Palsson BO. Metabolic models of protein allocation call for the kinetome. Cell Systems 2017;5:538–41. - PubMed
MeSH terms
Substances
Grants and funding
LinkOut - more resources
Full Text Sources

