

Transcriptional regulators SP110 and SP140 modulate inflammatory response genes in Mycobacterium tuberculosis-infected human macrophages
- PMID: 39162523
- PMCID: PMC11448263
- DOI: 10.1128/spectrum.00101-24
Transcriptional regulators SP110 and SP140 modulate inflammatory response genes in Mycobacterium tuberculosis-infected human macrophages
Abstract
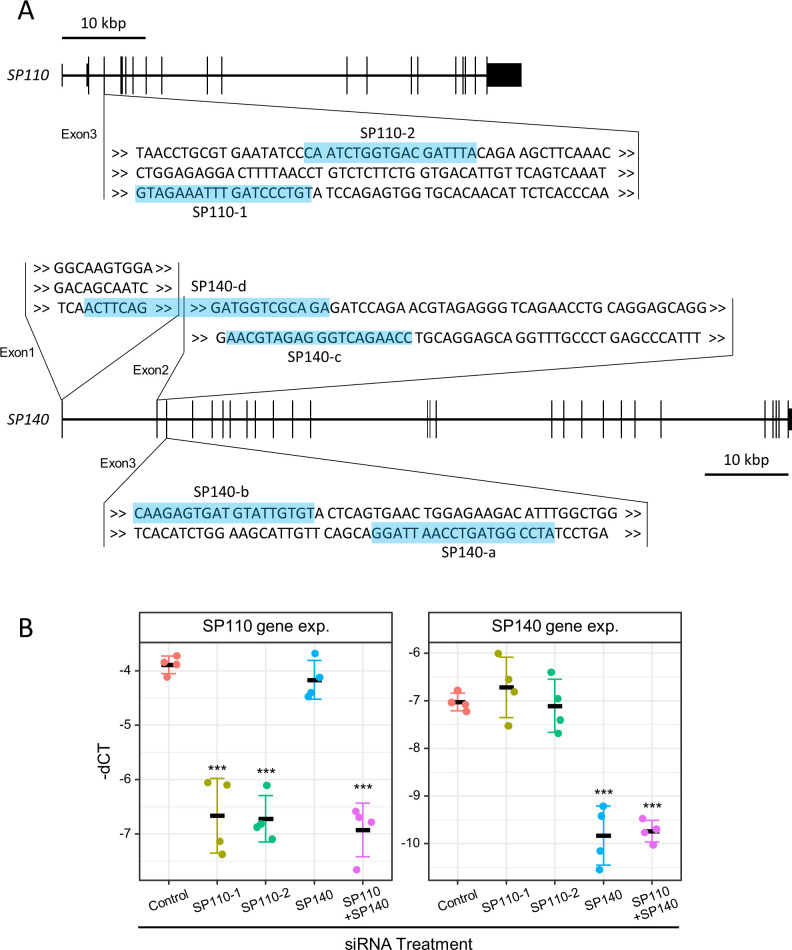
Understanding the functions of human transcriptional regulatory genes SP110 and SP140 during Mycobacterium tuberculosis infection is crucial; in a mouse model, homologous genes Sp110 and Sp140 have been shown to negatively regulate inflammatory response genes, including the type I interferon (IFN) response. The reduction of these genes in mice is associated with susceptibility to M. tuberculosis infection and the development of necrotizing granulomatous lesions. To investigate the involvement of SP110 and SP140 in human inflammatory response, we analyzed their regulatory manner in THP-1 macrophages infected with M. tuberculosis. Genome-wide transcriptional profiling revealed that the depletion of SP110 and/or SP140 impaired the induction of gene expression associated with inflammatory responses, including IFN response genes, although it had little effect on the intracellular proliferation of M. tuberculosis. By contrast, genes related to phosphorylation were upregulated in infected macrophages with SP110 and/or SP140 knockdown, but downregulated in infected control macrophages without their knockdown. Reverse transcription-quantitative PCR and ELISA further confirmed the impairment of the induction of IFN response genes by the depletion of SP110 and/or SP140 in M. tuberculosis-infected macrophages. These findings suggest that human SP110 and SP140 act as positive regulators for genes associated with inflammatory responses in M. tuberculosis-infected macrophages.
Importance: Tuberculosis (TB) is one of the most serious infectious diseases, with high morbidity and mortality worldwide. C3HeB/FeJ mice are widely utilized for evaluating anti-TB drugs because their drug sensitivity and pathology during M. tuberculosis infection resemble those of human TB, including the development of necrotizing granulomas. Downregulation of the transcriptional regulatory genes Sp110 and Sp140 in C3HeB/FeJ mice has been demonstrated to activate gene expression associated with inflammatory responses during M. tuberculosis infection, resulting in susceptibility to the infection. Here, we examined the regulatory manner of SP110 and SP140 using transcriptomic analysis in M. tuberculosis-infected human macrophages. Depletion of SP110 and/or SP140 in M. tuberculosis-infected THP-1 macrophages impaired the induction of gene expression associated with inflammatory responses, including interferon response genes, compared with that in control macrophages. These results suggest that human SP110 and SP140 act as positive regulators for genes associated with inflammatory responses upon M. tuberculosis infection.
Keywords: Mycobacterium tuberculosis; RNA sequencing; SP110; SP140; interferon response; macrophage; oxidative phosphorylation; transcriptional factor.
Conflict of interest statement
The authors declare no conflict of interest.
Figures


Similar articles
-
Single-cell transcriptomic profiling reveals a novel signature of necrotizing granulomatous lesions in the lungs of Mycobacterium tuberculosis-infected C3HeB/FeJ mice.Front Immunol. 2025 Aug 6;16:1624072. doi: 10.3389/fimmu.2025.1624072. eCollection 2025. Front Immunol. 2025. PMID: 40843005 Free PMC article.
-
The Transcriptional Foundations of Sp110-mediated Macrophage (RAW264.7) Resistance to Mycobacterium tuberculosis H37Ra.Sci Rep. 2016 Feb 25;6:22041. doi: 10.1038/srep22041. Sci Rep. 2016. PMID: 26912204 Free PMC article.
-
Comparative transcriptomic analysis of THP-1-derived macrophages infected with Mycobacterium tuberculosis H37Rv, H37Ra and BCG.J Cell Mol Med. 2021 Nov;25(22):10504-10520. doi: 10.1111/jcmm.16980. Epub 2021 Oct 10. J Cell Mol Med. 2021. PMID: 34632719 Free PMC article.
-
Macrophage heterogeneity and plasticity in tuberculosis.J Leukoc Biol. 2019 Aug;106(2):275-282. doi: 10.1002/JLB.MR0318-095RR. Epub 2019 Apr 2. J Leukoc Biol. 2019. PMID: 30938876 Review.
-
Uncharted territory: the role of mitochondrial DNA variation in macrophage-mediated host susceptibility to tuberculosis.Tuberculosis (Edinb). 2025 Jul;153:102650. doi: 10.1016/j.tube.2025.102650. Epub 2025 May 8. Tuberculosis (Edinb). 2025. PMID: 40354681 Review.
Cited by
-
Sp140L functions as a herpesvirus restriction factor suppressing viral transcription and activating interferon-stimulated genes.Proc Natl Acad Sci U S A. 2025 Jun 24;122(25):e2426339122. doi: 10.1073/pnas.2426339122. Epub 2025 Jun 17. Proc Natl Acad Sci U S A. 2025. PMID: 40526717
-
Single-cell transcriptomic profiling reveals a novel signature of necrotizing granulomatous lesions in the lungs of Mycobacterium tuberculosis-infected C3HeB/FeJ mice.Front Immunol. 2025 Aug 6;16:1624072. doi: 10.3389/fimmu.2025.1624072. eCollection 2025. Front Immunol. 2025. PMID: 40843005 Free PMC article.
-
Sp140L Is a Novel Herpesvirus Restriction Factor.bioRxiv [Preprint]. 2025 Apr 12:2024.12.13.628399. doi: 10.1101/2024.12.13.628399. bioRxiv. 2025. Update in: Proc Natl Acad Sci U S A. 2025 Jun 24;122(25):e2426339122. doi: 10.1073/pnas.2426339122. PMID: 39713285 Free PMC article. Updated. Preprint.
References
-
- WHO . 2023. Global tuberculosis report 2023
-
- Seto S, Morimoto K, Yoshida T, Hiramatsu M, Hijikata M, Nagata T, Kikuchi F, Shiraishi Y, Kurashima A, Keicho N. 2019. Proteomic profiling reveals the architecture of granulomatous lesions caused by tuberculosis and Mycobacterium avium complex lung disease. Front Microbiol 10:3081. doi:10.3389/fmicb.2019.03081 - DOI - PMC - PubMed
-
- Franzblau SG, DeGroote MA, Cho SH, Andries K, Nuermberger E, Orme IM, Mdluli K, Angulo-Barturen I, Dick T, Dartois V, Lenaerts AJ. 2012. Comprehensive analysis of methods used for the evaluation of compounds against Mycobacterium tuberculosis. Tuberculosis (Edinb) 92:453–488. doi:10.1016/j.tube.2012.07.003 - DOI - PubMed
MeSH terms
Substances
Grants and funding
- 23wm02250828,23fk0108607,23fk0108674,23gm1610013,24fk0108703/Japan Agency for Medical Research and Development (AMED)
- 20K16260/MEXT | Japan Society for the Promotion of Science (JSPS)
- 20KK0197/MEXT | Japan Society for the Promotion of Science (JSPS)
- 22K07065/MEXT | Japan Society for the Promotion of Science (JSPS)
LinkOut - more resources
Full Text Sources
Medical
Molecular Biology Databases
Research Materials
