. 2024 Aug 31;38(16):e23862.
doi: 10.1096/fj.202302615RR.

Loss of periostin function impairs ligament fibroblast activity and facilitates ROS-mediated cellular senescence

Affiliations

Loss of periostin function impairs ligament fibroblast activity and facilitates ROS-mediated cellular senescence

Muhammad Farooq Rai et al. FASEB J. .

Abstract

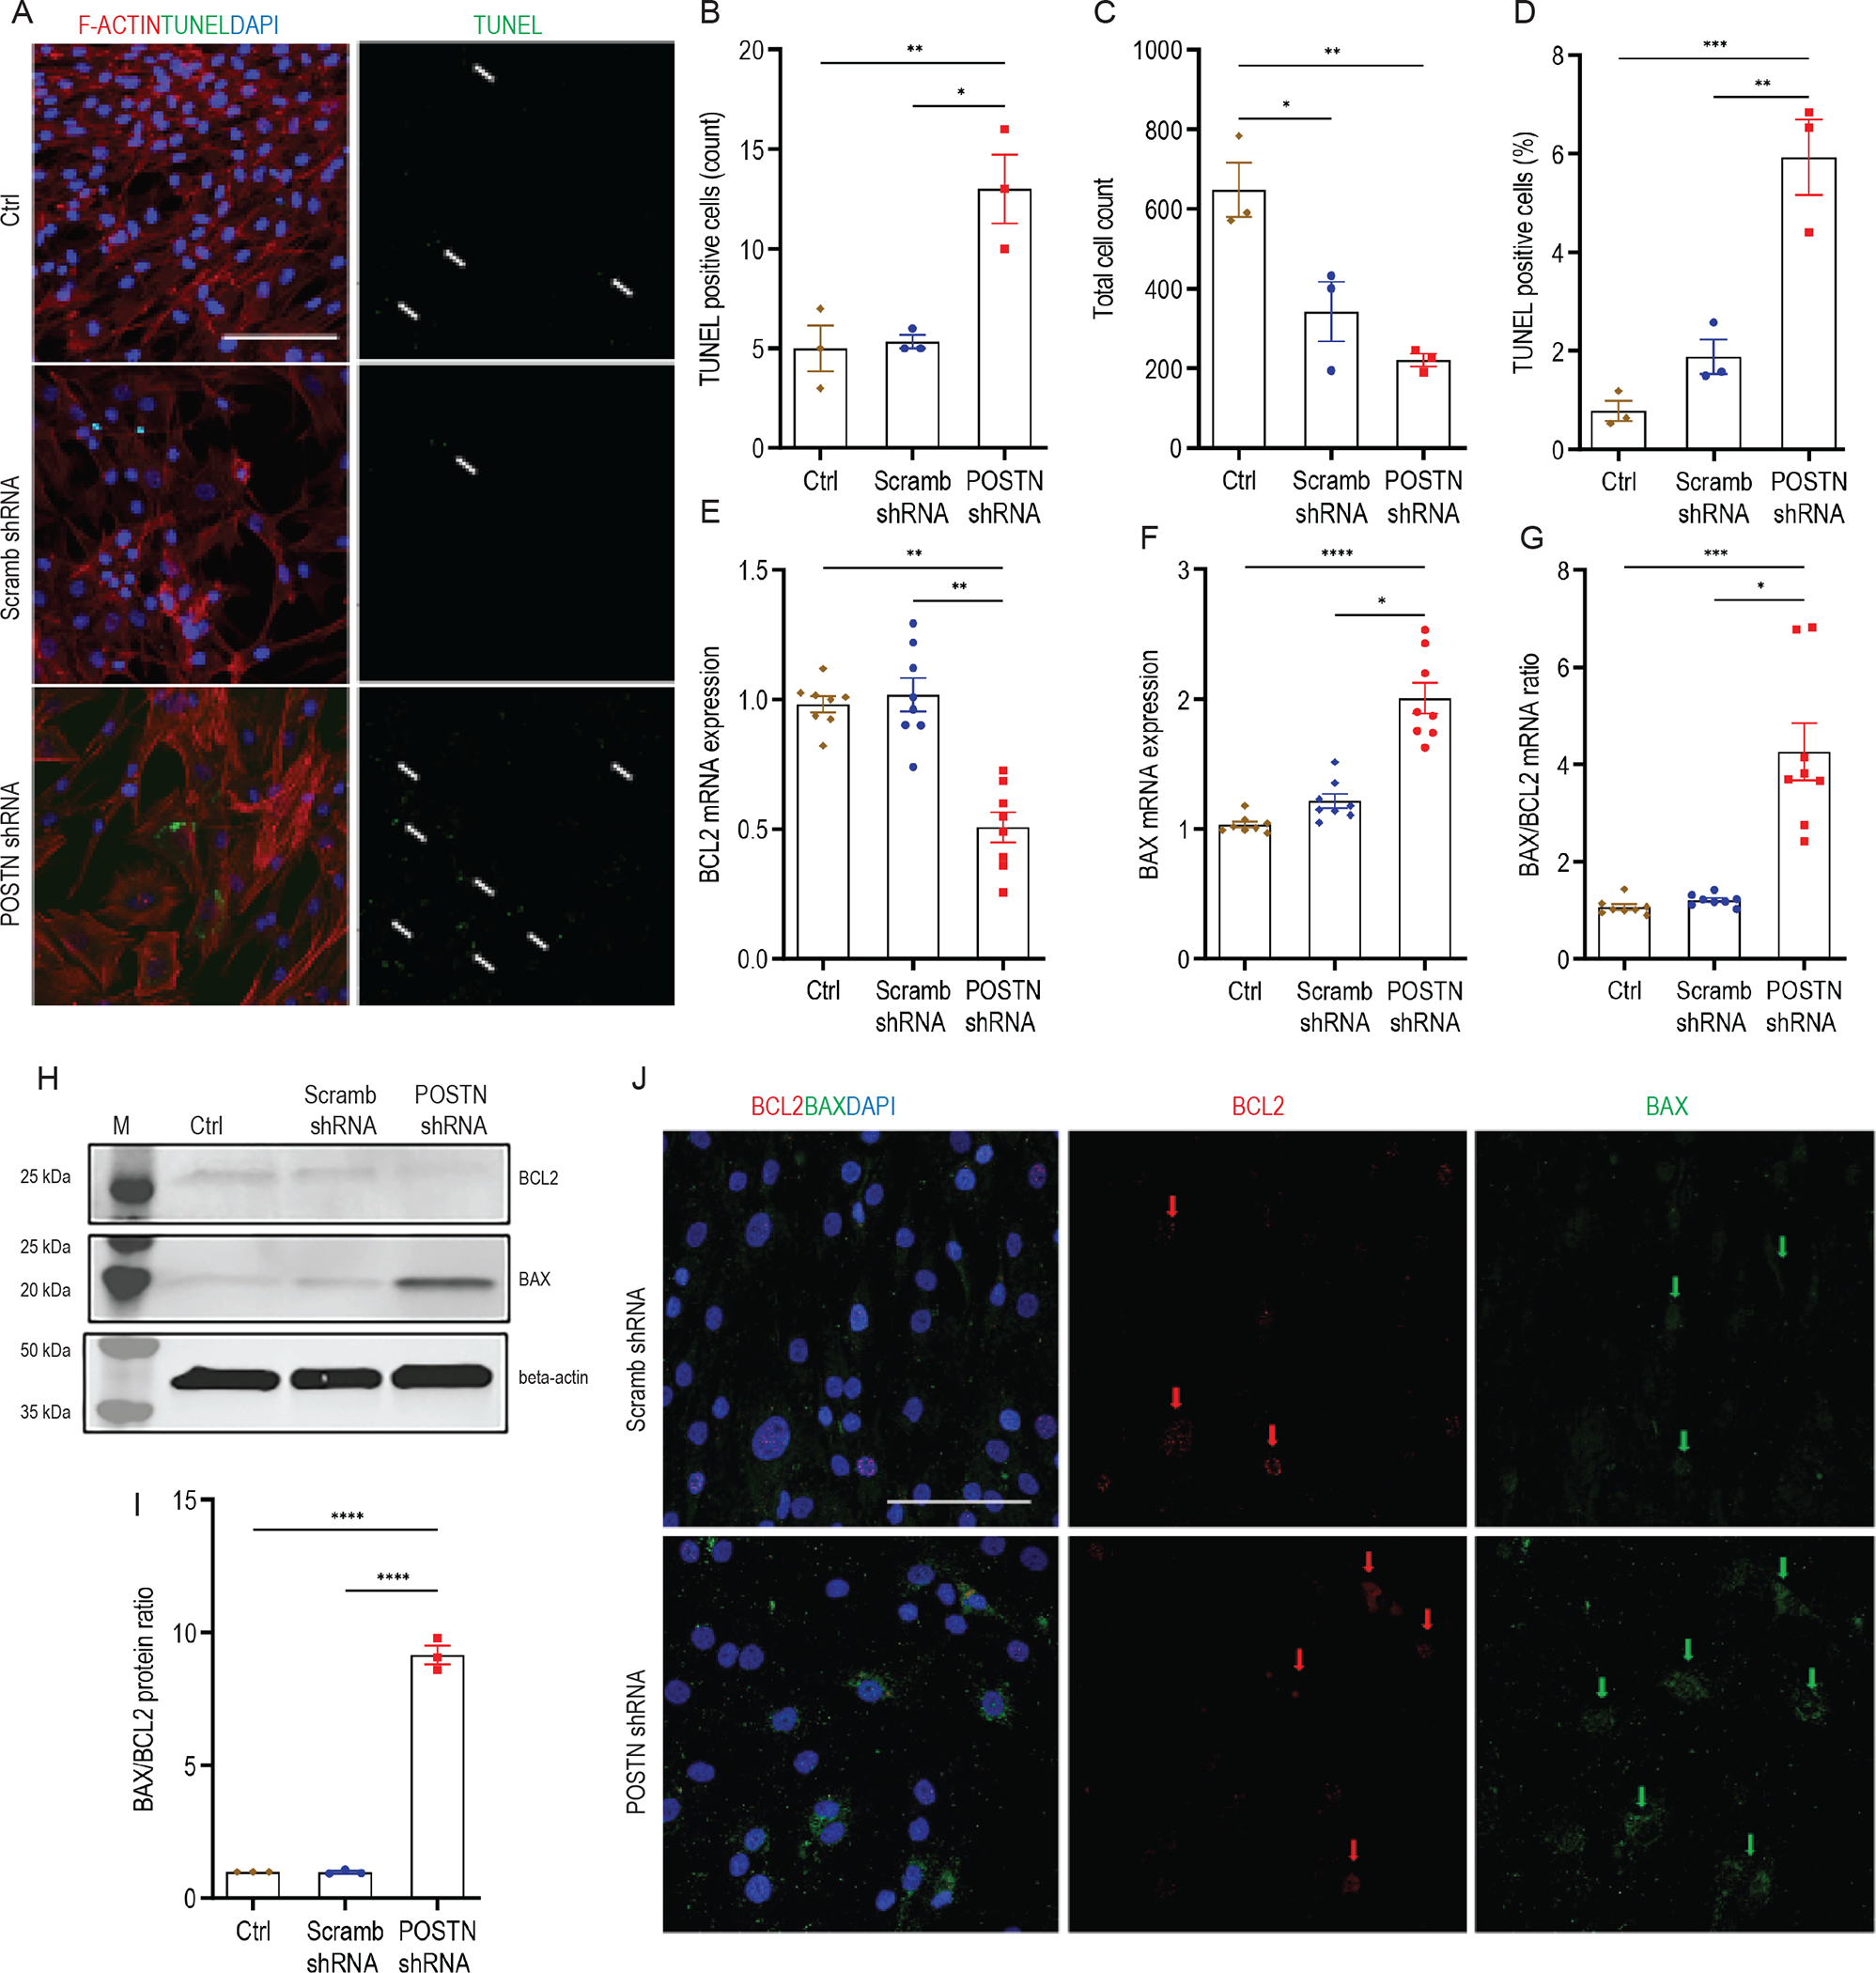
Anterior cruciate ligament (ACL) injuries pose a significant challenge due to their limited healing potential, often resulting in premature arthritis. The factors and mechanisms contributing to this inadequate healing process remain elusive. During the acute phase of injury, ACL tissues express elevated periostin levels that decline over time. The functional significance of periostin in ligament biology remains understudied. In this study, we investigated the functional and mechanistic implications of periostin deficiency in ACL biology, utilizing ligament fibroblasts derived from patients and a murine model of ACL rupture. Our investigations unveiled that periostin knockdown compromised fibroblast growth characteristics, hindered the egress of progenitor cells from explants, and arrested cell-cycle progression, resulting in the accumulation of cells in the G0/G1 phase and moderate apoptosis. Concurrently, a significant reduction in the expression of cell-cycle and matrix-related genes was observed. Moreover, periostin deficiency triggered apoptosis through STAT3Y705/p38MAPK signaling and induced cellular senescence through increased production of reactive oxygen species (ROS). Mechanistically, inhibition of ROS production mitigated cell senescence in these cells. Notably, in vivo data revealed that ACL in Postn-/- mice exhibited a higher tearing frequency than wild-type mice under equivalent loading conditions. Furthermore, injured ACL with silenced periostin expression, achieved through nanoparticle-siRNA complex delivery, displayed an elevated propensity for apoptosis and senescence compared to intact ACL in C57BL/6 mice. Together, our findings underscore the pivotal role of periostin in ACL health, injury, and potential for healing.

Keywords: ACL; ROS; STAT3; cell‐cycle; p16INK4A; p38MAPK.


Conflict of interest statement

Conflict of interest

The authors declare that they have no conflicts of interest regarding the contents of this article. All authors have read the journal’s policy on disclosure of potential conflicts of interest.

Figures

Figure 1.
Figure 1.
ACL fibroblasts were transduced with scrambles or periostin shRNA or left untransduced (Ctrl) for 21 days or indicated time points. A. Periostin knockdown was confirmed by RT-qPCR. B. Periostin protein measurement was made by Western blot. Representative immunoblots corresponding to human periostin and β-actin proteins from five independent experiments are displayed (M = molecular weight marker). C. Graphs were constructed based on the gray values of the protein bands normalized to β-actin as measured in ImageJ. *p < 0.05.
Figure 2.
Figure 2.
ACL fibroblasts were transduced with scrambles or periostin shRNA or left untransduced (Ctrl) for 21 days or indicated time points. A. Cell proliferation was detected with the CCK-8 assay by measuring the optical density (OD) at 450 nm wavelength. B. Relative colony formation (%) was calculated by dividing the total number of colonies in the periostin shRNA group by the total number of colonies counts in the scrambled shRNA group multiplied by 100. C. Representative photomicrographs of ACL fibroblasts taken by light microscope at 0 and 24 h (dotted lines depict cell front, magnification = 100×). D. The migration was ascertained by measuring the gap (in μm) between cell fronts with ImageJ at 6, 18, and 24 h. E. ACL explants were transduced with scrambles or periostin shRNA and cultured for three weeks to monitor the egression of cells from the explants. Images were taken 14 and 21 days after culture/transduction (dense black areas in the plate represent explants, arrows indicate the crawling direction of ACL progenitor cells from explants, and dotted lines indicate cell front) (magnification = 200×). Note: The plate was full of cells in the scrambled shRNA group on day 21. *p < 0.05, ****p < 0.0001, ns = non-significant.
Figure 3.
Figure 3.
ACL fibroblasts were transduced with scrambles or periostin shRNA or left untransduced (Ctrl) for 21 days or indicated time points A. Cell cycle distribution was analyzed by assessing the DNA content using FACS. Cell cycle distribution values are shown in the inset. B. Quantitative cell cycle distribution (as a percentage of total cells) is displayed at the G0/G1, S, and G2/M phases. C. mRNA expression of cell cycle-related genes CCNB1 and CCND1 was measured by RT-qPCR. D. mRNA expression of genes related to the extracellular matrix was measured by RT-qPCR for DCN, FN1, COL3A1, COL1A1, IGF1, and FGF2. *p < 0.05, **p < 0.01, ***p < 0.001.
Figure 4.
Figure 4.
ACL fibroblasts were transduced with scrambled or periostin shRNA or left untransduced (Ctrl) for 21 days. A. Cell apoptosis was detected by TUNEL assay, and images were taken with a confocal microscope (green = TUNEL, red = F-actin, blue = DAPI, scale bar = 100 μm, magnification = 400×). Note: the panel on the right displays F-actin, TUNEL, and DAPI, whereas the panel on the left shows only TUNEL in a different set of sections. B-D. Two areas of interest were selected from two sections per patient to obtain the average number of apoptotic cells. TUNEL-positive cells and the total number of cells in each field were counted to calculate the percentage of apoptotic cells. E-G. mRNA expression of BCL2 and BAX was measured by RT-qPCR. The ratio between BCL2 and BAX mRNA expression was calculated for each group. H. Total cellular proteins were subjected to Western blot. Representative immunoblots corresponding to human BCL2, BAX, and β-actin proteins are shown from three independent experiments (M = molecular weight marker). I. The western blot gray signal intensity of BCL2 and BAX bands normalized to -actin, quantified by ImageJ to obtain the BAX/BCL2 ratio. J. BCL2 and BAX protein measurements were detected by immunofluorescence and images acquired by confocal microscope (red = BCL2, green = BAX, blue = DAPI, scale bar = 100 μm, magnification = 400×). *p < 0.05, **p < 0.01, ***p < 0.001, ****p < 0.0001.
Figure 5.
Figure 5.
ACL fibroblasts were transduced with scrambled or periostin shRNA or left untransduced (Ctrl) for 21 days. A. Western blot was performed for total STAT3, P-STAT3Y705, p38MAPK, P-p38MAPK, and β-actin (M = molecular weight marker). B-C. Quantification of signal intensity was made with ImageJ software relative to β-actin, and ratios between P-STAT3 Y705 and total STAT3 (B) and between P-p38MAPK and p38MAPK (C) were computed. *p < 0.05, **p < 0.01.
Figure 6.
Figure 6.
ACL fibroblasts were transduced with scrambled or periostin shRNA or left untransduced (Ctrl) for 21 days. A. Cells were treated with Staurosporine (1 μM) or DMSO for 6 h. The activity of cleaved caspase-3 was determined by Western blot using total cellular proteins with β-actin used as loading control (M = molecular weight marker, DMSO = dimethylsulfoxide). B. Quantification of Western blot signaling intensity was determined relative to β-actin by ImageJ. C-E. Cells were treated with Staurosporine (1 μM) or DMSO for 6 h. mRNA expression of BCL2 (C) and BAX (D) was measured by RT-qPCR. The ratio between BAX and BCL2 mRNA expression was calculated for each (E). *p < 0.05, **p < 0.01.
Figure 7.
Figure 7.
ACL fibroblasts were transduced with scrambled or periostin shRNA or left untransduced (Ctrl) for 21 days A. Cell senescence was measured by SA-β-gal staining (blue), and photomicrographs were taken under a microscope (scale bar = 100 μm, magnification = 200×). B. The percentage of cells positive for SA-β-gal staining was calculated in each group C. Western blot was performed on cell lysates from control cells and cells transduced with scrambled or periostin shRNA for P-p53 (undetectable in all samples) and p16INK4A along with β-actin (M = molecular weight marker). D. Quantification of signal intensity was made for p16INK4A with ImageJ relative to β-actin. E-F. mRNA expression of p16 gene (CDKN2A) and some SASP genes such as CXCL1, CXCL2, and MMP3 was measured by RT-qPCR. *p < 0.05, ***p < 0.001, ****p < 0.0001.
Figure 8.
Figure 8.
ACL fibroblasts were transduced with scrambled or periostin shRNA or left untransduced (Ctrl) for 21 days A. DCFDA assay was used to measure intracellular ROS levels B. ACL fibroblasts were transduced with scrambled or periostin shRNA for 48 h. NAC, a ROS inhibitor, was added, and cells were cultured for 21 days. Intracellular ROS levels were measured by DCFDA fluorescence (S = scrambled, P = periostin). C. SA-β-gal staining (blue) was used as a measurement of cellular senescence, and photomicrographs were acquired using a microscope (scale bar = 100 μm, magnification = 200×). D. The percentage of SA-β-gal-positive cells was computed in each group. *p < 0.05, **p < 0.01.
Figure 9.
Figure 9.
A. ACL fibroblasts were transfected with scrambled or periostin siRNA for 21 days. Periostin knockdown was confirmed by RT-qPCR. B-D. The expression of BCL2 (B) and BAX (C) mRNA was measured by RT-qPCR, and the ratio between BAX and BCL2 (D) was measured. E. Intracellular ROS was measured using a DCFDA assay. F. mRNA expression of CDKN2A was measured by RT-qPCR. G. Cellular senescence was measured by SA-β-gal staining (blue), and images were acquired using a microscope (scale bar =100 μm, magnification = 200×). *p < 0.05, **p < 0.01, ***p < 0.001.
Figure 10.
Figure 10.
A. Cell apoptosis was measured in ACL histological sections at two different locations marked as B and C and shown at higher magnification in panels B and C (ACL= anterior cruciate ligament, F = femur, T = tibia, scale bar = 500 μm, magnification = 100×). B-C. Photomicrographs showing areas of interest with TUNEL positive cells denoted by white arrows (green = TUNEL, red = collagen type II, blue = DAPI, scale bar = 50 μm, magnification = 400×). D. The total number of TUNEL positive cells and percentage of TUNEL positive cells (calculated by dividing the total number of TUNEL positive cells by total number of cells in the area of interests) in Postn−/− and wt mice. E. Sections were stained using the P-p16 antibody to indirectly detect senescence in Postn/ and wt mice. The staining intensity was quantified to show quantitative P-p16 signal intensity (scale bar =100 μm, magnification = 200×). *p < 0.05.
Figure 11.
Figure 11.
A. Periostin was knocked down in the knees of C57BL/6 mice using periostin siRNA nanoparticle complex for 8 weeks. Cell apoptosis was measured in histological ACL sections at two different locations marked as L (ligament body) and J (junction of the ligament with the tibia) as shown at higher magnification (ACL = anterior cruciate ligament, F = femur, T = tibia, (green = TUNEL, red = collagen type II, blue = DAPI, scale bar = 100 μm, magnification = 100×). Photomicrographs showing areas of interest with TUNEL positive cells denoted by white arrows (scale bar = 100 μm, magnification = 100×). B. The total number of all cells, total TUNEL positive cells, and percentage of TUNEL positive cells (calculated by dividing the total number of TUNEL positive cells by the total number of cells) in mice treated with periostin siRNA and scrambled siRNA. C. Sections were stained using a P-p16 antibody to detect senescence in periostin indirectly and scrambled siRNA groups. The staining intensity was quantified to show quantitative P-p16 signal intensity (scale bar =100 μm, magnification = 200×).
Figure 12.
Figure 12.
A. Postn−/− and wt mice were subjected non-invasively to 60 cycles of 7.5 N of loading on the knee joints in an Instron material testing machine by positioning the limb between the two cups of the loading machine. B. ACL rupture was monitored by an abrupt drop in the load-cycle curve during loading in both Postn−/− (solid line) and wt (dotted line) mice. C. The percentage of mice experienced ACL rupture (tear rate in %) after compressive loading (n = 9 each).
Figure 13.
Figure 13.
Our data illustrate that periostin loss-of-function in ‘injured’ ACL fibroblasts inhibited cell proliferation and migration, potentially via arresting cell cycle progression. Periostin knockdown also induced cellular apoptosis by interacting with the STAT3Y705/p38MAPK signaling pathway. In addition, periostin knockdown propagated cell senescence (increased SA-β-gal activity and SASP), which is mechanistically mediated by intracellular ROS production and p16INK4A signaling. Together, these studies highlight an essential mechanistic role of periostin in the injured ACL. ROS = reactive oxygen species; SASP = senescence-associated secretory phenotype; SA-β-gal = senescence-associated β-galactosidase.

References

    1. Mall NA, Chalmers PN, Moric M, Tanaka MJ, Cole BJ, Bach BR Jr., and Paletta GA Jr. (2014) Incidence and trends of anterior cruciate ligament reconstruction in the United States. Am J Sports Med 42, 2363–2370 - PubMed
    1. Kiapour AM, and Murray MM (2014) Basic science of anterior cruciate ligament injury and repair. Bone Joint Res 3, 20–31 - PMC - PubMed
    1. Lohmander LS, Englund PM, Dahl LL, and Roos EM (2007) The long-term consequence of anterior cruciate ligament and meniscus injuries: osteoarthritis. Am J Sports Med 35, 1756–1769 - PubMed
    1. Houck DA, Kraeutler MJ, Belk JW, Goode JA, Mulcahey MK, and Bravman JT (2019) Primary Arthroscopic Repair of the Anterior Cruciate Ligament: A Systematic Review of Clinical Outcomes. Arthroscopy 35, 3318–3327 - PubMed
    1. Costa-Paz M, Ayerza MA, Tanoira I, Astoul J, and Muscolo DL (2012) Spontaneous healing in complete ACL ruptures: a clinical and MRI study. Clin Orthop Relat Res 470, 979–985 - PMC - PubMed

LinkOut - more resources