. 2024 Nov;37(6):1010-1032.
doi: 10.1007/s10548-024-01074-y. Epub 2024 Aug 20.

Brain Evoked Response Qualification Using Multi-Set Consensus Clustering: Toward Single-Trial EEG Analysis

Affiliations

Brain Evoked Response Qualification Using Multi-Set Consensus Clustering: Toward Single-Trial EEG Analysis

Reza Mahini et al. Brain Topogr. 2024 Nov.

Abstract

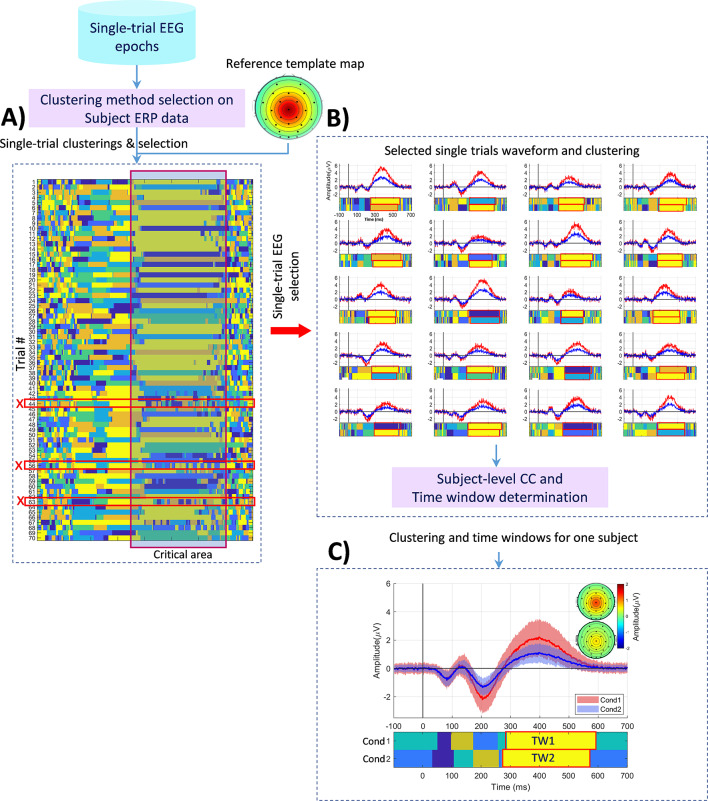
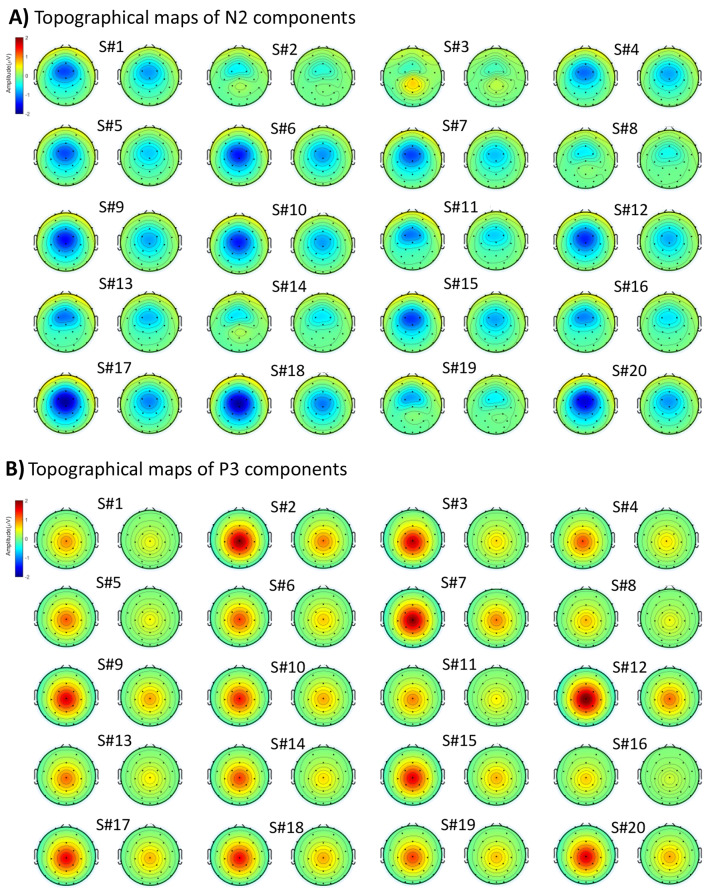
In event-related potential (ERP) analysis, it is commonly assumed that individual trials from a subject share similar properties and originate from comparable neural sources, allowing reliable interpretation of group-averages. Nevertheless, traditional group-level ERP analysis methods, including cluster analysis, often overlook critical information about individual subjects' neural processes due to using fixed measurement intervals derived from averaging. We developed a multi-set consensus clustering pipeline to examine cognitive processes at the individual subject level. Initially, consensus clustering from diverse methods was applied to single-trial EEG epochs of individual subjects. Subsequently, a second level of consensus clustering was performed across the trials of each subject. A newly modified time window determination method was then employed to identify individual subjects' ERP(s) of interest. We validated our method with simulated data for ERP components N2 and P3, and real data from a visual oddball task to confirm the P3 component. Our findings revealed that estimated time windows for individual subjects provide precise ERP identification compared to fixed time windows across all subjects. Additionally, Monte Carlo simulations with synthetic single-trial data demonstrated stable scores for the N2 and P3 components, confirming the reliability of our method. The proposed method enhances the examination of brain-evoked responses at the individual subject level by considering single-trial EEG data, thereby extracting mutual information relevant to the neural process. This approach offers a significant improvement over conventional ERP analysis, which relies on the averaging mechanism and fixed measurement interval.

Keywords: Cognitive process; EEG/ERP microstates; Multi-set consensus clustering; Single-trial EEG; Standardization; Time window.


Conflict of interest statement

The authors declare no competing interests.

Figures

Fig. 1
Fig. 1
The proposed pipeline for identifying the ERP component shown in an individual subject using multi-trial consensus clustering. A) Selection of clustering methods for individual subjects based on ERP data and trial examination. Trials in the ‘critical area’ (i.e., selected based on the experimental mechanism for the expected ERP) are chosen, while trials with low or no correlation with the template map are discarded. B) Initiation of multi-set consensus clustering with the single-trial EEG epochs of the subject, followed by across-trials consensus clustering. C) Exploration for the optimal time window, examining inner similarity and spatial correlation of candidate maps. Abbreviations: Cond (condition), TW (time window), CC (consensus clustering)
Fig. 2
Fig. 2
Illustration of the topographical configuration and temporal properties of four pre-defined ERP components: N, P2, N2, and P3
Fig. 3
Fig. 3
The obtained clustering results, with colored areas representing cluster maps, using multi-set consensus clustering on the original subjects’ ERP waveforms (in Cz electrode) from two conditions. Clustering was applied in six clusters as the optimal number of clusters based on the group’s average ERP data. The colored rectangles denote the corresponding time windows of N2 (indicated in green) and P3 (indicated in red) for ‘Cond1’ and ‘Cond2’, respectively. Abbreviations: Cond1(condition 1) and Cond2 (condition 2)
Fig. 4
Fig. 4
Consensus clustering results on group-averaged ERP data and the identified P3 component derived from the group mean data in six clusters (the optimal number of clusters). The waveform is shown in the Pz electrode. The spatial property of the elicited P3 serves as the template map reference, facilitating the selection of trials and comparison of scoring results (i.e., spatial correlation scores) across individual subjects
Fig. 5
Fig. 5
Clustering results in six clusters and estimated time windows (red rectangle) for each subject’s P3 components by condition. ERP and trial waveforms are displayed at the Pz electrode site
Fig. 6
Fig. 6
Topographical representation of the ERP components isolated from simulated data (original subjects) under two conditions, highlighting the N2 component (A) and the P3 component (B). Notably, the topography of both N2 and P3 components is more pronounced in the first condition compared to the second
Fig. 7
Fig. 7
Topographical maps of P3 (within determined time windows) derived from subjects’ ERP data. A) Obtained template maps from grand mean ERP data. B) Identified P3 topographical maps from individual subjects
Fig. 8
Fig. 8
Comparison of analytical standard measurement error (formula image) and Monte Carlo SE (formula image) for N2 component scores in simulated data. A)formula image for inner similarity scores from single trials’ estimated time windows in 1000 Monte Carlo iterations. B)formula image for spatial correlation scores with pre-defined N2 from estimated time windows. C)formula image for amplitude scores at Cz electrode site from mean topography within the estimated time window. D)formula image for latency scores at the ‘start’ and ‘end’ of the estimated time window
Fig. 9
Fig. 9
Comparison of analytical standard measurement error (formula image) and Monte Carlo SE (formula image) for P3 component scores in simulated data. A) formula image for inner similarity scores from single trials’ estimated time windows in 1000 Monte Carlo iterations. B) formula image for spatial correlation scores with pre-defined P3 from estimated time windows. C) formula image for amplitude scores at Pz electrode site from mean topography within the estimated time window. D) formula image for latency scores at the ‘start’ and ‘end’ of the estimated time window

References

    1. Abu-Jamous B, Fa R, Roberts DJ, Nandi AK (2014) 4–9 May 2014). M-N scatter plots technique for evaluating varying-size clusters and setting the parameters of Bi-CoPaM and Uncles methods. 2014 IEEE International Conference on Acoustics, Speech and Signal Processing (ICASSP), 10.1109/ICASSP.2014.6854902
    1. Abu-Jamous B, Fa R, Roberts DJ, Nandi AK (2015) Jun 4). UNCLES: method for the identification of genes differentially consistently co-expressed in a specific subset of datasets. BMC Bioinformatics 16:184. 10.1186/s12859-015-0614-0 - PMC - PubMed
    1. Antonova E, Holding M, Suen HC, Sumich A, Maex R, Nehaniv C (2022) 2022/06/01/). EEG microstates: functional significance and short-term test-retest reliability. Neuroimage: Rep 2(2):100089. 10.1016/j.ynirp.2022.100089
    1. Bugli C, Lambert P (2007) Comparison between Principal Component Analysis and Independent Component Analysis in Electroencephalograms Modelling. Biom J 49(2):312–327. 10.1002/bimj.200510285 - PubMed
    1. Calhoun VD, Liu J, Adalı T (2009) 2009/03/01/). A review of group ICA for fMRI data and ICA for joint inference of imaging, genetic, and ERP data. Neuroimage, 45(1, Supplement 1), S163-S172. 10.1016/j.neuroimage.2008.10.057 - PMC - PubMed

LinkOut - more resources