. 2025 Jan 6;31(1):164-180.
doi: 10.1158/1078-0432.CCR-24-1594.

Chemotherapy Drives Tertiary Lymphoid Structures That Correlate with ICI-Responsive TCF1+CD8+ T Cells in Metastatic Ovarian Cancer

Affiliations

Chemotherapy Drives Tertiary Lymphoid Structures That Correlate with ICI-Responsive TCF1+CD8+ T Cells in Metastatic Ovarian Cancer

Tereza Lanickova et al. Clin Cancer Res. .

Abstract

Purpose: Patients with high-grade serous ovarian carcinoma (HGSOC) are virtually insensitive to immune checkpoint inhibitors (ICI) employed as standalone therapeutics, at least in part reflecting microenvironmental immunosuppression. Thus, conventional chemotherapeutics and targeted anticancer agents that not only mediate cytotoxic effects but also promote the recruitment of immune effector cells to the HGSOC microenvironment stand out as promising combinatorial partners for ICIs in this oncological indication.

Experimental design: We harnessed a variety of transcriptomic, spatial, and functional assays to characterize the differential impact of neoadjuvant paclitaxel-carboplatin on the immunological configuration of paired primary and metastatic HGSOC biopsies as compared to neoadjuvant chemotherapy (NACT)-naïve HGSOC samples from five independent patient cohorts.

Results: We found NACT-driven endoplasmic reticulum stress and calreticulin exposure in metastatic HGSOC lesions culminates with the establishment of a dense immune infiltrate including follicular T cells (TFH cells), a prerequisite for mature tertiary lymphoid structure (TLS) formation. In this context, TLS maturation was associated with an increased intratumoral density of ICI-sensitive TCF1+PD1+ CD8+ T cells over their ICI-insensitive TIM-3+PD1+ counterparts. Consistent with this notion, chemotherapy coupled with a PD1-targeting ICI provided a significant survival benefit over either therapeutic approach in syngeneic models of HGSOC bearing high (but not low) tumor mutational burden.

Conclusions: Altogether, our findings suggest that NACT promotes TLS formation and maturation in HGSOC lesions, de facto preserving an intratumoral ICI-sensitive T-cell phenotype. These observations emphasize the role of rational design, especially relative to the administration schedule, for clinical trials testing chemotherapy plus ICIs in patients with HGSOC. See related commentary by Bravo Melgar and Laoui, p. 10.


Conflict of interest statement

A. Ryska reports personal fees from Amgen, AstraZeneca, BMS, Roche, MSD, Pfizer, Eli Lilly, MerckSerono, and Bayer and personal fees and non-financial support from Gilead and Sanofi outside the submitted work. M. Kovar reports grants from Sotio and Ministry of Education, Youth and Sports of the Czech Repblic and EU (Next Generation EU) during the conduct of the study as well as grants from Sotio outside the submitted work; in addition, M. Kovar has a patent for Methods and materials for targeted expansion of immune effector cells, International Application Number PCT/US2020/039857, pending. I.A. McNeish reports personal fees from GSK, AstraZeneca, Clovis Oncology, Pharma&, OncoC4, Roche, and Theolytics outside the submitted work. A. Coosemans reports grants from Novocure and Oncoinvent AS and personal fees from Molecular Partners, Sotio a.s., and Epics Therapeutics SA outside the submitted work; in addition, A. Coosemans has a patent for WO2021130356 (PCT/EP2020/087851: Disease Detection in Liquid Biopsies) pending. S. Orsulic reports grants from National Cancer Institute and Department of Veterans Administration during the conduct of the study. L. Galluzzi reports grants from Lytix, Promontory, and Onxeo and personal fees from AstraZeneca, AbbVie, OmniSEQ, The Longevity Labs, Inzen, Luke Heller TECPR2 Foundation, Sotio, Ricerchiamo, Noxopharm, Imvax, Boehringer Ingelheim, EduCom, and AbbVie outside the submitted work. No potential conflicts of interest were disclosed by the other authors.

Figures

Figure 1.
Figure 1.
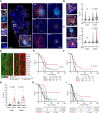
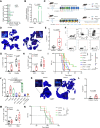
Immunomodulation by NACT in metastatic HGSOC. A, Representative images of CALR immunostaining in CALRLo and CALRHi patients. Scale bars, 10 and 100 µm. B, CALR expression levels determined by immunostaining and (C) ER stress signature level [expression level of DNA damage inducible transcript 3 (DDIT3, best known as CHOP), heat shock protein family A (Hsp70) member 5 (HSPA5, best known as BIP), and heat shock protein 90 beta family member 1 (HSP90B1)] as determined by RNA-seq in pTME and mTME HGSOC with/without NACT. Box plots: lower quartile, median, upper quartile; whiskers, minimum, maximum. Statistical significance was calculated by two-sided Mann–Whitney test. P values are indicated. D, Supervised hierarchical clustering of gene signatures related to immune populations (orange), immune functions (blue) and immune phenotype (purple) as determined by RNA-seq data from pTME and mTME HGSOC tumor samples with/without NACT. IS, immunosuppression; mDCs, myeloid dendritic cells; NK cells, natural killer cells; TLS, tertiary lymphoid structures. E, Gene expression signature associated with CD8+ T cells, B cells, cytotoxicity, mDCs, TLS, and immunosuppression as determined on RNA-seq data from pTME and mTME HGSOC with/without NACT. Box plots: lower quartile, median, upper quartile; whiskers, minimum, maximum. Statistical significance was calculated by two-sided Mann–Whitney test. P values are indicated. F, Representative image of CD20/DC-LAMP double immunostaining. Scale bars, 500 and 100 µm. G, Density of CD8+ T cells, CD20+ B cells, and DC-LAMP+ cells as determined by immunostaining in pTME and mTME HGSOC samples with/without NACT. Mean and SEM are shown. Statistical significance was calculated by two-sided Mann–Whitney test. P values are indicated. ns, not significant.
Figure 2.
Figure 2.
NACT-mediated adjuvanticity positively impacts clinically relevant TLS maturation in metastatic HGSOC. A, Representative image of immunofluorescence of CD4, CD8, CD20, CD21, CD23, DC-LAMP, and GZMB staining (immunofluorescence panel 1). Scale bars, 10, 100 and 500 µm. B and C, Distribution of early TLS (eTLS; B) and mature TLS (mTLS; C) across pTME and mTME HGSOC tumor samples with/without NACT. Statistical significance was calculated by two-sided Mann–Whitney test. P values are indicated. D, Supervised hierarchical clustering of TLS-relevant gene signature (CCL2, CCL3, CCL4, CCL5, CCL8, CCL18, CCL19, CCL21, CXCL9, CXCL10, CXCL11, and CXCL13) across pTME and mTME HGSOC tumor samples with/without NACT. E and F, Overall survival (OS) of 60 (E) and 40 chemo-naïve and treated patients with mHGSOC (F), respectively (study cohort 1 and 2) based on median stratification of total mTLS. Survival curves were estimated by the Kaplan–Meier method, and differences between groups were evaluated using log-rank test. Number of patients at risk and P values are reported. G, Number of mTLS across patients with CALRLo and CALRHi mHGSOC with/without NACT as determined by median stratification. Mean and SEM are shown. Statistical significance was calculated by two-sided Mann–Whitney test. P values are indicated. H and I, OS of 60 and 40 patients with chemo-naïve and treated mHGSOC (study cohorts 1 and 2), upon stratification based on median frequency of mTLS and expression of CALR. Survival curves were estimated by the Kaplan–Meier method, and differences between groups were evaluated using the log-rank test.
Figure 3.
Figure 3.
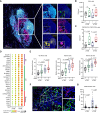
NACT-mediated adjuvanticity positively impacts the density of follicular T cells (TFH) and in situ activation of intratumoral B cells in mHGSOC. A–C, Representative image (A) and box plots showing the density of CD4+ cells (B) and CXCR5+PD1+FoxP3CD4+ TFH cells (C) in the pTME and mTME of chemo-naïve and treated HGSOC (study cohort 1 and 2). Box plots: lower quartile, median, upper quartile; whiskers, minimum, maximum. Statistical significance was calculated by the Mann–Whitney test. P values are indicated. D and E, Dot plot (D) and box plot (E) showing expression profile of gene signatures of B-cell subtypes, e.g., plasma cells (PC), germinal center (GC), and memory B cells within pTME and mTME HGSOC tumor samples with/without NACT. Box plots: lower quartile, median, upper quartile; whiskers, minimum, maximum. Statistical significance was calculated by two-sided Mann–Whitney test. P values are indicated. F and G, Representative image (F) and density of CD68+CD163+ TAMs in pTME and mTME of chemo naïve and treated HGSOC (G). Mean and SEM are shown. Statistical significance was calculated by two-sided Mann–Whitney test. P values are indicated.
Figure 4.
Figure 4.
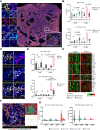
NACT positively increases the ICI-sensitive TCF1+PD1+CD8+ T-cell phenotype within metastatic HGSOC. A, Representative image of immunofluorescence of CD68, CD8, PD-L1, FoxP3, TCF1, CD57, PanCK, PD1, CD4, CD20, GZMB, and TIM-3 staining (immunofluorescence panel 2). Scale bars, 2 μm, 10 µm, and 100 µm. B, Violin plot showing the density of CD8+ and PD1+CD8+ within tumor core and tumor stroma of pTME and mTME of chemo-naïve and treated HGSOC. Statistical significance was calculated by two-sided Mann–Whitney test. P values are indicated. C and D, Representative image (C) and box plot showing the density of TCF1+PD1+CD8+ T cells and TIM-3+PD1+CD8+ and spatial distribution of TCF1+PD1+CD8+ T cells within tumor core and stroma in pTME and mTME of chemo-naïve and treated HGSOC (D). Statistical significance was calculated by two-sided Mann–Whitney test. P values are indicated. E, Supervised hierarchical clustering of gene signatures associated with different stages of T-cell differentiation: T-cell stemness (orange), T-cell effector function (blue), T-cell proliferation (green), T-cell phenotype (red) as determined by RNAseq in mTME of chemo-naïve and treated HGSOC. For further details, see Supplementary Fig. S9. F and G, Representative image of digital pathology spatial distribution and violin plot showing the number of cell contacts between PanCK+ malignant cells and TCF1+PD1+CD8+ T cells and TIM-3+PD1+CD8+ within 0 to 30 µm in pTME and mTME of chemo-naïve and treated HGSOC.
Figure 5.
Figure 5.
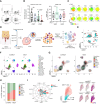
NACT-mediated progenitor TCF1+PD1+CD8+ T-cell phenotype associates with effector cytotoxic functions within metastatic HGSOC. A–C, Representative dot plot (A) and box plot (B) showing percentage of TIM-3+PD1+CD8+ T cells and GZMB+CD8+ T cells within native pTME and mTME of chemo-naïve and treated HGSOC as determined by flow cytometry. Box plots: lower quartile, median, upper quartile; whiskers, minimum, maximum. Statistical significance was calculated by the Mann–Whitney test. P values are indicated. C, Marker heatmap dot plots obtained after t-SNE and showing the relative expression of the indicated marker in the different phenotypic clusters within mTME of chemo-naïve and treated HGSOS as determined by flow cytometry. D, Design of experimental and sequencing workflow in 11 patients with HGSOC before and after NACT. scRNAseq was performed on dissociated solid tumor specimens using 10× Genomics Chromium platform. E and F, Uniform manifold approximation and projection (UMAP) plot of all cells (n = 51,476) passing the quality control, colored by type of therapy (E) and cell type (F). G and H, TILs projections (G) and predicted subtype frequencies (H) in biopsies from patients with chemo-naïve and treated HGSOC. CM, central memory; EM, effector memory; MAIT, mucosal-associated invariant T cells; PTEX, progenitor exhausted T cells; TEMRA, terminally exhausted T cells; TEX, exhausted T cells. I and J, Radar plot showing percentage of CD8+ T cells expressing respective T-cell marker (KLRB1, TCF7, CCR7, IL7R, LMNA, FGFBP2, XCL1, CD200, CRTAM, TOX, PDCD1, HAVCR2, and GNLY; I) and UMAP showing expression of PDCD1, HAVCR2 and TCF7 in CD4+ and CD8+ T-cell clusters in chemo-naïve and treated HGSOC samples (study cohort 5; J), as determined by scRNA-seq. (Panel D created with BioRender.com.)
Figure 6.
Figure 6.
The clinical relevance of combined chemotherapy and immunotherapy in mouse models of TMBLo and TMBHi ovarian cancer. A and B, Bar plots showing single-nucleotide variants positions (SNVs) (A) and the somatic mutations prevalence (mutations per megabase) (B) in ID8 (n = 3) and Brca1−/−Trp53−/−/Myc/Hras SO1 (n = 3) C57BL/6 syngeneic mouse ovarian cancer cell lines. Mean and SEM are shown. Statistical significance was calculated by multiple t test. P values are indicated. C, Experimental design for the analysis of TLS aggregates development and efficacy of combined chemotherapy and aPD1 and/or aTIM-3 therapy in TMBLo ID8 and TMBHi SO1 experimental syngeneic mouse models. D and E, Representative immunostaining for CD4, CD8, CD20, and CD21 (D) and a box plot showing density of TLS aggregates within chemo-naïve (n = 5) and treated TMBHi SO1 (n = 9) ovarian tumors (E). Scale bars, 100 µm and 2.5 mm. Box plots: lower quartile, median, upper quartile; whiskers, minimum, maximum. Statistical significance was calculated by two-sided Mann–Whitney test. P values are indicated. F–H, Representative dot plot (F) and flow cytometry analyses for percentages of CD62L+CD44+ central memory (CM) and CD62LCD44 terminally differentiated CD8+ T cells (TEMRA) (G) and TCF1+PD1+CD8+ and TIM-3+PD1+CD8+ T cells (H) in tumor samples of the TMBHi SO1 experimental model in the presence or absence of carboplatin and taxane chemotherapy (NACT). Box plots: lower quartile, median, upper quartile; whiskers, minimum, maximum. Statistical significance was calculated by two-sided Mann–Whitney test. P values are indicated. I and J, Overall survival (OS) of TMBHi SO1 experimental model (I) and flow cytometry analyses for percentage of TCF1+PD1+CD8+ T cells after NACT, aPD1, aTIM-3 and combined therapy (J). Survival curves were estimated by the Kaplan–Meier method, and differences between groups were evaluated using log-rank test. Box plots: lower quartile, median, upper quartile; whiskers, minimum, maximum. Statistical significance was calculated by two-sided Mann–Whitney test. P values are indicated. K and L, Representative immunostaining for CD4, CD8, CD20, and CD21 (K) and a box plot showing density of TLS aggregates within chemo-naïve (n = 8) and treated TMBLo ID8 (n = 8) (L) ovarian tumors. Scale bars, 100 µm and 2.5 mm. Box plots: lower quartile, median, upper quartile; whiskers, minimum, maximum. Statistical significance was calculated by two-sided Mann–Whitney test. P values are indicated. M, Flow cytometry analyses for TCF1+PD1+CD8+ and TIM-3+PD1+CD8+ T cells in tumor samples of the TMBLo ID8 experimental model in the presence or absence of carboplatin and taxane chemotherapy (NACT). Box plots: lower quartile, median, upper quartile; whiskers, minimum, maximum. Statistical significance was calculated by two-sided Mann–Whitney test. P values are indicated. N, Overall survival (OS) of TMBLo ID8 experimental model after NACT, anti-PD1, and combined therapy. Survival curves were estimated by the Kaplan–Meier method, and differences between groups were evaluated using log-rank test. P values are indicated. (Panel C created with BioRender.com.)

References

    1. Colombo N, Sessa C, du Bois A, Ledermann J, McCluggage WG, McNeish I, et al. . ESMO-ESGO consensus conference recommendations on ovarian cancer: pathology and molecular biology, early and advanced stages, borderline tumours and recurrent disease†. Ann Oncol 2019;30:672–705. - PubMed
    1. González-Martín A, Harter P, Leary A, Lorusso D, Miller RE, Pothuri B, et al. . Newly diagnosed and relapsed epithelial ovarian cancer: ESMO clinical practice guideline for diagnosis, treatment and follow-up. Ann Oncol 2023;34:833–48. - PubMed
    1. Konstantinopoulos PA, Matulonis UA. Clinical and translational advances in ovarian cancer therapy. Nat Cancer 2023;4:1239–57. - PubMed
    1. Olalekan S, Xie B, Back R, Eckart H, Basu A. Characterizing the tumor microenvironment of metastatic ovarian cancer by single-cell transcriptomics. Cell Rep 2021;35:109165. - PubMed
    1. Hensler M, Kasikova L, Fiser K, Rakova J, Skapa P, Laco J, et al. . M2-like macrophages dictate clinically relevant immunosuppression in metastatic ovarian cancer. J Immunother Cancer 2020;8:e000979. - PMC - PubMed

MeSH terms