. 2024 Sep 3;16(9):evae180.
doi: 10.1093/gbe/evae180.

Investigating Additive and Replacing Horizontal Gene Transfers Using Phylogenies and Whole Genomes

Affiliations

Investigating Additive and Replacing Horizontal Gene Transfers Using Phylogenies and Whole Genomes

Lina Kloub et al. Genome Biol Evol. .

Abstract

Horizontal gene transfer (HGT) is fundamental to microbial evolution and adaptation. When a gene is horizontally transferred, it may either add itself as a new gene to the recipient genome (possibly displacing nonhomologous genes) or replace an existing homologous gene. Currently, studies do not usually distinguish between "additive" and "replacing" HGTs, and their relative frequencies, integration mechanisms, and specific roles in microbial evolution are poorly understood. In this work, we develop a novel computational framework for large-scale classification of HGTs as either additive or replacing. Our framework leverages recently developed phylogenetic approaches for HGT detection and classifies HGTs inferred between terminal edges based on gene orderings along genomes and phylogenetic relationships between the microbial species under consideration. The resulting method, called DART, is highly customizable and scalable and can classify a large fraction of inferred HGTs with high confidence and statistical support. Our application of DART to a large dataset of thousands of gene families from 103 Aeromonas genomes provides insights into the relative frequencies, functional biases, and integration mechanisms of additive and replacing HGTs. Among other results, we find that (i) the relative frequency of additive HGT increases with increasing phylogenetic distance, (ii) replacing HGT dominates at shorter phylogenetic distances, (iii) additive and replacing HGTs have strikingly different functional profiles, (iv) homologous recombination in flanking regions of a novel gene may be a frequent integration mechanism for additive HGT, and (v) phages and mobile genetic elements likely play an important role in facilitating additive HGT.

Keywords: Aeromonas; additive transfer; genome evolution; horizontal gene transfer; prokaryotes; replacing transfer.


Figures

Fig. 1.
Fig. 1.
Overview of classification pipeline. The classification pipeline takes as input a list of terminal-edge HGTs for the genomes under consideration, gene order information for each genome, and phylogenetic relationships between the genomes. The figure depicts three different genomic regions from a hypothetical recipient genome X, along with corresponding genomic regions in the three closest phylogenetic neighbors of X. a) HGTs from some specific donor genome D (not depicted) are marked in green (shaded). Since these genes (green/shaded) acquired by X from D appear close together on the recipient genome, they may have been transferred as part of a single HMGT event. Such HGTs are therefore filtered out and not considered for classification. b) The transferred gene is shown in red on the recipient genome X and its eight immediate gene neighbors are shown in purple. Homologs of these genes are shown using the same colors (red and purple) in the three closest phylogenetic neighbors. As shown, in at least one (two in this example) of these three phylogenetic neighbors, the homolog of the transferred gene appears in the same genomic context (i.e. most of its nearest eight gene neighbors are purple). This HGT would therefore be classified as replacing. c) The transferred gene is shown in red on the recipient genome X and its eight immediate gene neighbors are shown in yellow. Homologs of these genes are shown using the same colors (red and yellow) in the three closest phylogenetic neighbors. As shown, for each of the three phylogenetic neighbors, either a homolog of the transferred gene does not exist in that genome or, if it does exists, occurs in a different genomic context (i.e. most of its closest eight gene neighbors are not yellow). This HGT would therefore be classified as additive. Note that this classification approach does not consider the donor genome.
Fig. 2.
Fig. 2.
Classification results for inter- and intra-species HGTs. The pie charts show the fractions of all inter-species a) and intra-species b) HGTs classified as additive, replacing, and ambiguous using DART with default parameter settings. The first part of each slice label is the total number of HGTs in the corresponding category and the second part is the percent area of the pie occupied by that slice. a) Inter-species HGTs and b) Intra-species HGTs.
Fig. 3.
Fig. 3.
Filtered classification results for inter- and intra-species HGTs. The pie charts show the fractions of all inter-species a) and intra-species b) HGTs classified as additive, replacing, and ambiguous after post-processing and aggressively filtering DART’s initial classification results computed using default parameter settings. The first part of each slice label is the total number of HGTs in the corresponding category and the second part is the percent area of the pie occupied by that slice. a) Inter-species HGTs and b) Intra-species HGTs.
Fig. 4.
Fig. 4.
Fraction of additive HGTs by phylogenetic distance. The plot shows the fraction of HGTs classified as additive for donor–recipient pairs separated by different phylogenetic distance ranges. Results are shown for the combined set of filtered inter- and intra-species HGTs classified as additive and replacing. The phylogenetic distance between any donor–recipient pair is the patristic distance (with branch lengths representing substitutions per site) between the two corresponding terminal taxa on the species tree.
Fig. 5.
Fig. 5.
Functional analysis of additive and replacing HGTs. The figure shows distributions of COG functional categories for (i) all genes from all genomes, (ii) all HGTs classified as additive, (iii) all HGTs classified as replacing. Only HGTs present in the filtered classification results were used, and both intra- and inter-species HGTs are included. Each letter corresponds to a COG functional category as shown in supplementary Table S1, Supplementary Material online. Some key functional categories are also shown in Table 3. COG functional categories “Z”, “Y”, “W”, and “R” are not shown since no gene in any of the Aeromonas genomes belonged to those categories. COG Functional category “S” corresponds to genes whose functions are unknown, while the category “#” corresponds to genes which could not be assigned to any COG functional category.
Fig. 6.
Fig. 6.
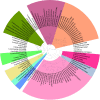
The 103-genome Aeromonas species tree (topology only) used in this work. Strains belonging to the same species are all assigned the same (nonwhite) color.

References

    1. Altschul SF, Gish W, Miller W, Myers EW, Lipman DJ. Basic local alignment search tool. J Mol Biol. 1990:215(3):403–410. 10.1016/S0022-2836(05)80360-2. - DOI - PubMed
    1. Aziz RK, Bartels D, Best AA, DeJongh M, Disz T, Edwards RA, Formsma K, Gerdes S, Glass EM, Kubal M, et al. The RAST server: rapid annotations using subsystems technology. BMC Genomics. 2008:9(1):75. 10.1186/1471-2164-9-75. - DOI - PMC - PubMed
    1. Bakke P, Carney N, DeLoache W, Gearing M, Ingvorsen K, Lotz M, McNair J, Penumetcha P, Simpson S, Voss L, et al. Evaluation of three automated genome annotations for Halorhabdus utahensis. PLoS One. 2009:4(7):e6291. 10.1371/journal.pone.0006291. - DOI - PMC - PubMed
    1. Bansal M, Alm EJ, Kellis M. Reconciliation revisited: handling multiple optima when reconciling with duplication, transfer, and loss. J Comput Biol. 2013:20(10):738–754. 10.1089/cmb.2013.0073. - DOI - PMC - PubMed
    1. Bansal MS, Kellis M, Kordi M, Kundu S. RANGER-DTL 2.0: rigorous reconstruction of evolution by duplication, transfer and loss. Bioinformatics. 2018:34(18):3214–3216. 10.1093/bioinformatics/bty314. - DOI - PMC - PubMed

LinkOut - more resources