. 2024 Aug 27;121(35):e2401058121.
doi: 10.1073/pnas.2401058121. Epub 2024 Aug 20.

Computational detection of antigen-specific B cell receptors following immunization

Affiliations

Computational detection of antigen-specific B cell receptors following immunization

Maria Francesca Abbate et al. Proc Natl Acad Sci U S A. .

Abstract

B cell receptors (BCRs) play a crucial role in recognizing and fighting foreign antigens. High-throughput sequencing enables in-depth sampling of the BCRs repertoire after immunization. However, only a minor fraction of BCRs actively participate in any given infection. To what extent can we accurately identify antigen-specific sequences directly from BCRs repertoires? We present a computational method grounded on sequence similarity, aimed at identifying statistically significant responsive BCRs. This method leverages well-known characteristics of affinity maturation and expected diversity. We validate its effectiveness using longitudinally sampled human immune repertoire data following influenza vaccination and SARS-CoV-2 infections. We show that different lineages converge to the same responding Complementarity Determining Region 3, demonstrating convergent selection within an individual. The outcomes of this method hold promise for application in vaccine development, personalized medicine, and antibody-derived therapeutics.

Keywords: COVID-19; adaptive immune system; antigen specificity; influenza vaccine; repertoire sequencing.


Conflict of interest statement

Competing interests statement:The authors declare no competing interest.

Figures

Fig. 1.
Fig. 1.
Identifying responding antibodies from repertoires. (A) B cell repertoires exploit a diverse set of antigen receptors (antibodies) with different antigen specificities. Upon an immune challenge, antigen-specific B cells proliferate and mutate. The question addressed here is how to identify these responding clones from repertoire data. (B) We exploit bulk BCRs immune repertoire sequencing data (48) that covers the V, D, and J segments of the BCRs heavy chain to detect influenza–responding B cells without knowing the epitope, using the repertoire sampled at a single timepoint. Five healthy humans were vaccinated in late spring of 2012 with the 2011 to 2012 trivalent seasonal flu vaccine. Blood samples were collected before (days −5, −3, and 0) and after (1, 4, 7, 9, and 11) vaccine administration.
Fig. 2.
Fig. 2.
Similarity network analysis of antibody clonotypes. (A) During affinity maturation, distinct naive B cells proliferate and mutate upon recognition of the antigens, giving rise to distinct cell lineages (Left). At the sequence level (Right), we construct a graph where each node is an IgH nucleotide sequence, and edges connect sequences that differ by at most one amino acid in their CDR3. This may lead to distinct lineages being merged into the same functional cluster (e.g. the pink cluster). The idea of STAR is to identify sequences with high connectivity in the graph (highlighted), which indicates either convergent selection or belonging to a large lineage, or both. (B) Distribution of the CDR3 amino acid sequence count for all subjects (background lines) and their average (thick lines), at days 0 and 7. The two distributions are similar. (C) The distribution of the number of amino acid neighbors shows a marked difference between days 0 and 7 (same color convention as B). (D) The distribution of neighbors at day 0 is well described by a computational model of random repertoire generation (56) (see main text).
Fig. 3.
Fig. 3.
Results and validation. (A and B) Number of putative responding sequences identified by (A) fast-STAR and (B) full-STAR for each day and each subject. We observe very few hits on the days before vaccination and a large peak on day 7. (C and D) Frequency–time traces of the top-scoring sequences identified on day 7 for each subject found by (C) fast-STAR (with largest number of neighbors) and (D) full-STAR (with lowest P-value). Note that the best-scoring clonotype is the same for the two methods for all subjects except subject 5. (E and F) Sum of the frequencies of all responding clonotypes according to (E) fast-STAR and (F) full-STAR.
Fig. 4.
Fig. 4.
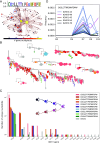
Convergent antibody response toward a conserved IgH CDR3 motif. (A) Graph structure of fast-STAR hits found in subject 1. Each node is an amino acid IgH CDR3 sequence. Node size is proportional to the number of distinct IgH nucleotide sequences with that CDR3, and color indicates the number of distinct V genes used. An edge is drawn between two CDR3 if they differ by one amino acid. The blue circle indicates the four amino acid CDR3s identified in the experimental testing as responding. Top: sequence logo of the sequences of the cluster. Height corresponds to the entropy of the amino acid choice at each site, and relative letter size to amino acid frequencies. (B) Reconstructed lineage trees of the main cluster of fast-STAR hits in subject 1. Branch length represents numbers of mutations, and node sizes frequencies of individual nucleotide sequences. The root is the unmutated naive sequence reconstructed from genomic templates. Each color represents a distinct amino acid CDR3 sequence (legend in C). (C) Number of distinct nucleotide sequences with the same amino acid CDR3, grouped by V gene usage. Each CDR3 sequence can be formed using distinct V genes, and within each V gene group, up to hundreds of nucleotide variants. (D) Frequency–time course of the most abundant nucleotide sequences associated with the amino acid CDR3 sequence CKSLLTTIPEKWFDPW. Sequences with different V genes are shown in different colors. Each sequence corresponds to a distinct B cell clone that expanded independently at day 7.
Fig. 5.
Fig. 5.
COVID19 specific sequences. (A) Number of hits obtained with fast-STAR per patient. (B) Number of hits obtained with full-STAR per patient. (C) Percentage of hits obtained with full-STAR in the entire dataset for each patient versus the percentage of hits obtained with full-STAR in the subsample of the dataset with SARS-CoV-2 specific sequences taken from the COVID19 antibody database, with significance. The nonsignificant patients are labeled with ns (P>0.05), one star corresponds to a P value P0.05, two stars P0.01, three stars P0.001 and four stars P0.0001.

References

    1. Fink K., Can we improve vaccine efficacy by targeting T and B cell repertoire convergence? Front. Immunol. 10, 110 (2019). - PMC - PubMed
    1. Wang C., et al. , B-cell repertoire responses to varicella-zoster vaccination in human identical twins. Proc. Natl. Acad. Sci. U.S.A. 112, 500–505 (2015). - PMC - PubMed
    1. Galson J. D., et al. , B-cell repertoire dynamics after sequential hepatitis B vaccination and evidence for cross-reactive B-cell activation. Genome Med. 8, 1–13 (2016). - PMC - PubMed
    1. Wang K., et al. , Memory B cell repertoire from triple vaccinees against diverse SARS-CoV-2 variants. Nature 603, 919–925 (2022). - PMC - PubMed
    1. Kreer C., Gruell H., Mora T., Walczak A. M., Klein F., Exploiting B cell receptor analyses to inform on HIV-1 vaccination strategies. Vaccines 8, 13 (2020). - PMC - PubMed

MeSH terms

Substances

LinkOut - more resources