. 2024 Aug 27;121(35):e2402491121.
doi: 10.1073/pnas.2402491121. Epub 2024 Aug 20.

MICU1 and MICU2 control mitochondrial calcium signaling in the mammalian heart

Affiliations

MICU1 and MICU2 control mitochondrial calcium signaling in the mammalian heart

Prottoy Hasan et al. Proc Natl Acad Sci U S A. .

Abstract

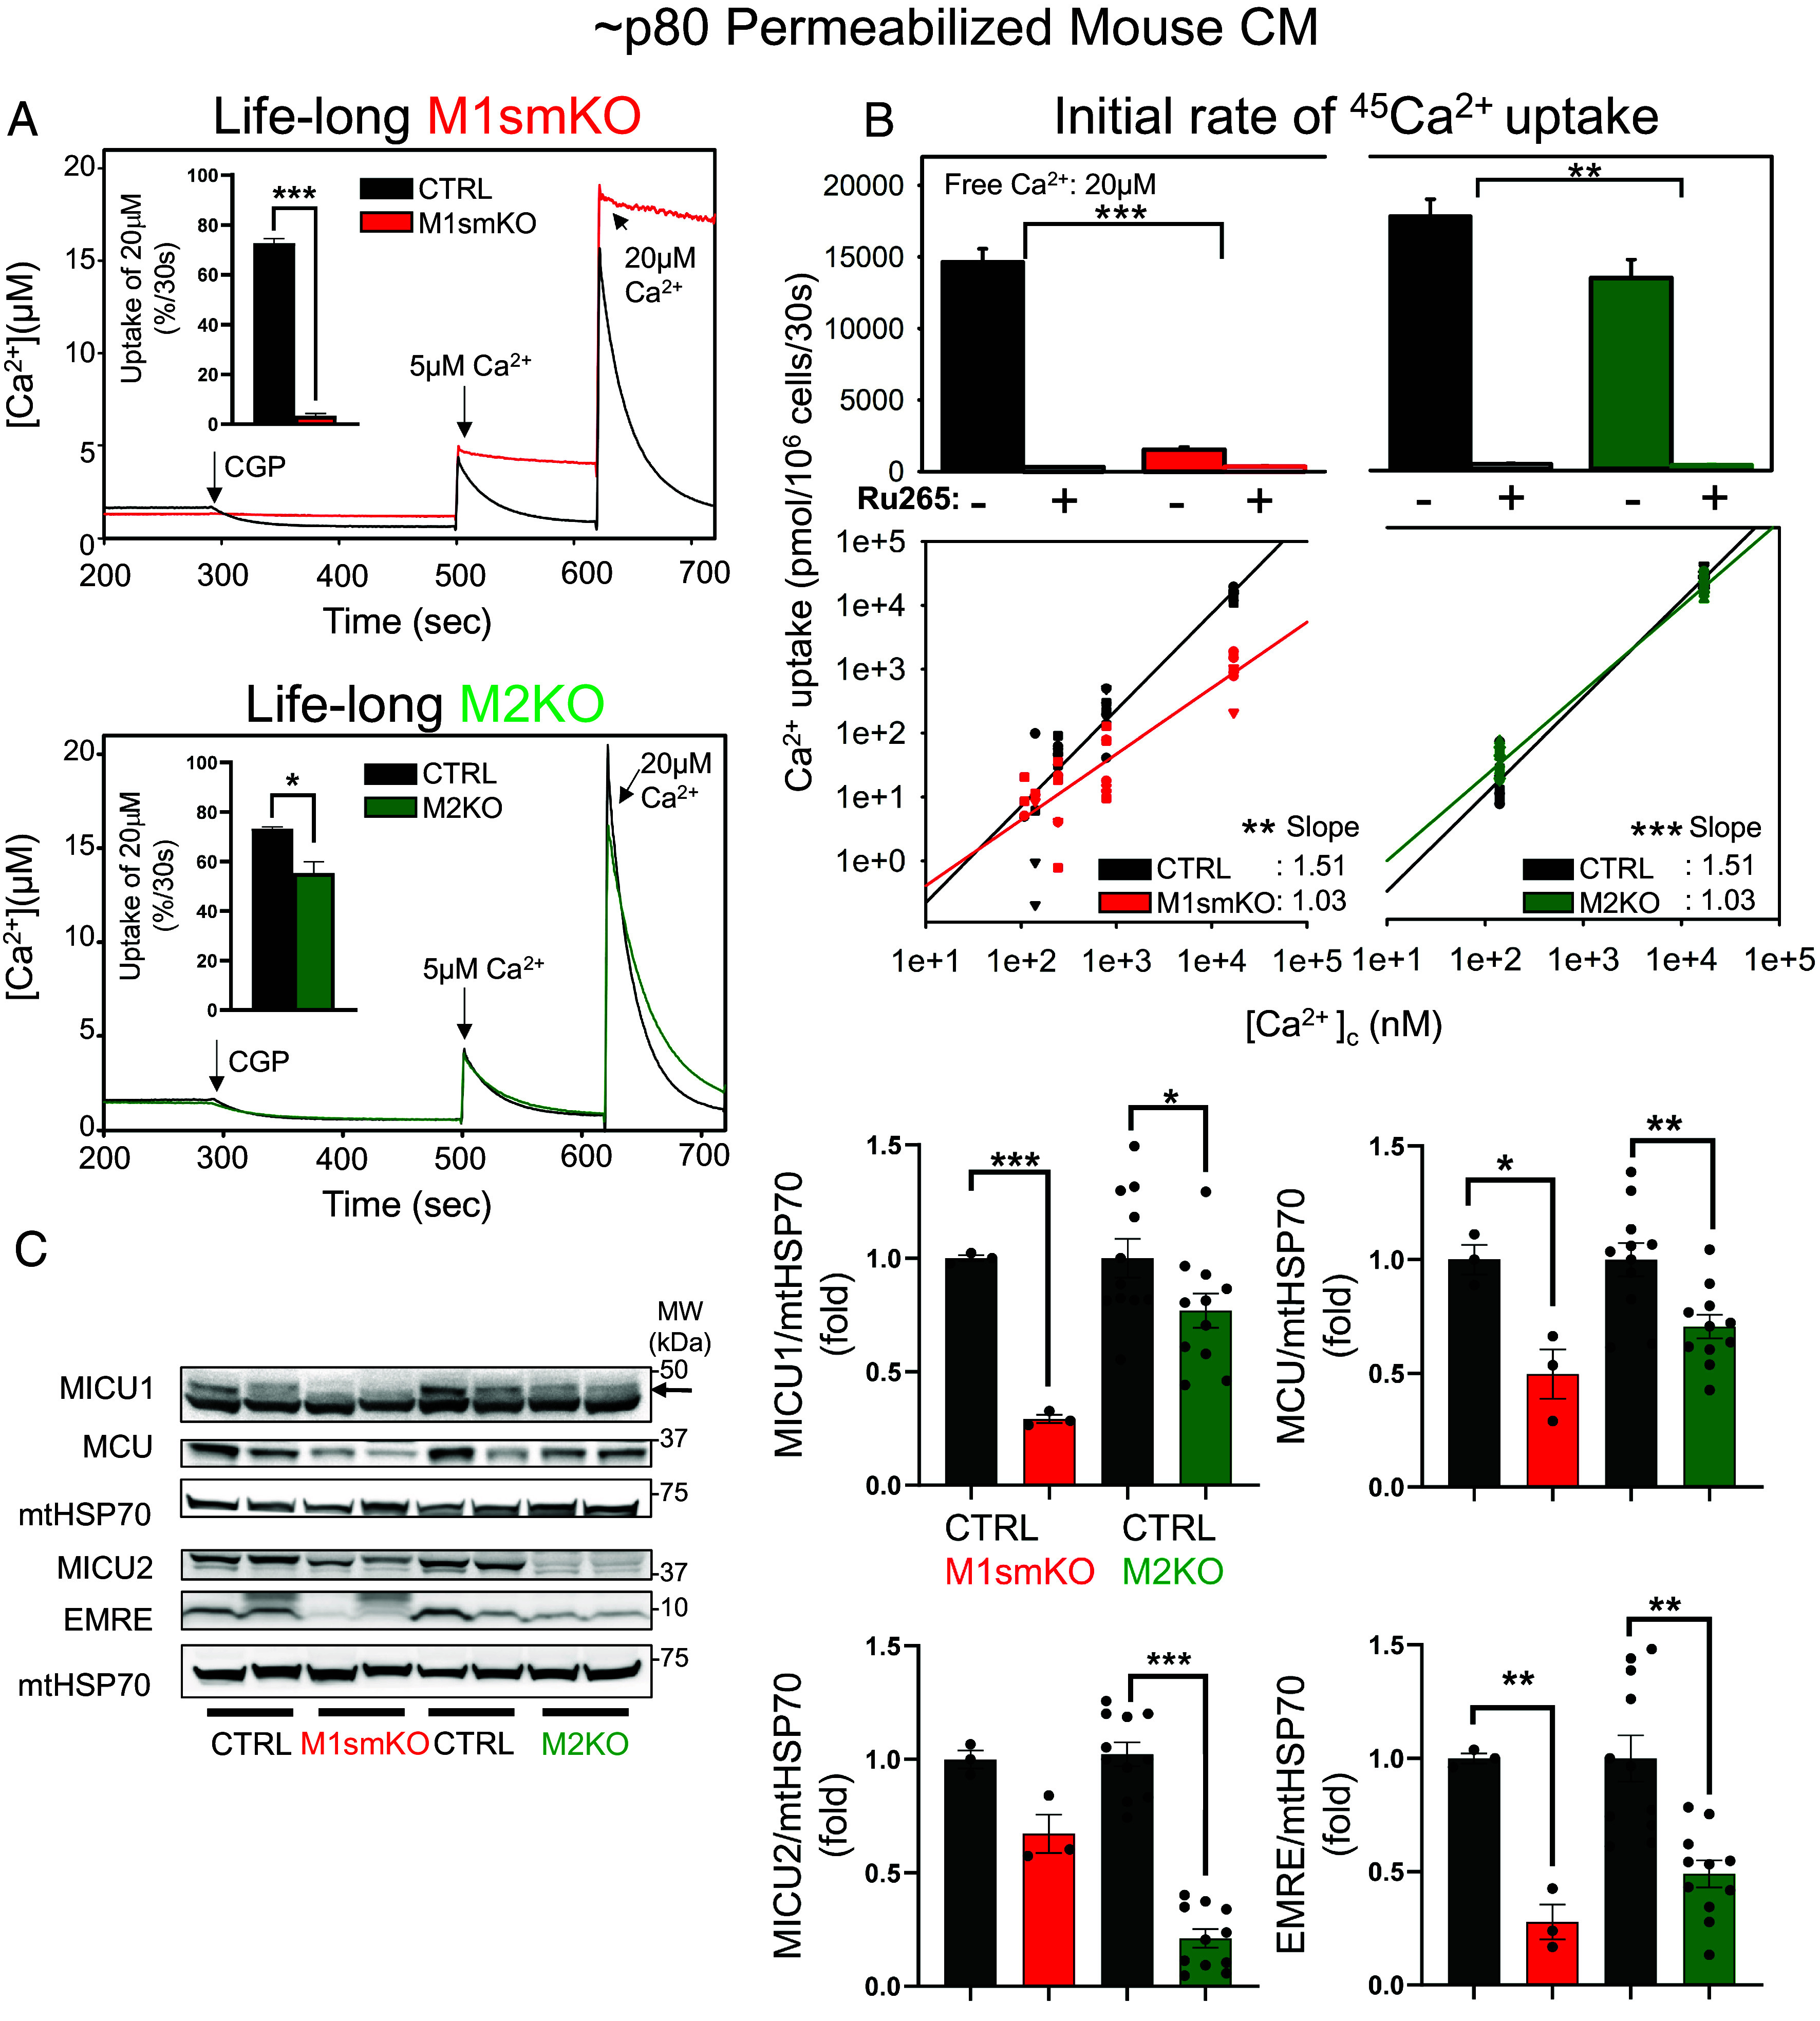
Activating Ca2+-sensitive enzymes of oxidative metabolism while preventing calcium overload that leads to mitochondrial and cellular injury requires dynamic control of mitochondrial Ca2+ uptake. This is ensured by the mitochondrial calcium uptake (MICU)1/2 proteins that gate the pore of the mitochondrial calcium uniporter (mtCU). MICU1 is relatively sparse in the heart, and recent studies claimed the mammalian heart lacks MICU1 gating of mtCU. However, genetic models have not been tested. We find that MICU1 is present in a complex with MCU in nonfailing human hearts. Furthermore, using murine genetic models and pharmacology, we show that MICU1 and MICU2 control cardiac mitochondrial Ca2+ influx, and that MICU1 deletion alters cardiomyocyte mitochondrial calcium signaling and energy metabolism. MICU1 loss causes substantial compensatory changes in the mtCU composition and abundance, increased turnover of essential MCU regulator (EMRE) early on and, later, of MCU, that limit mitochondrial Ca2+ uptake and allow cell survival. Thus, both the primary consequences of MICU1 loss and the ensuing robust compensation highlight MICU1's relevance in the beating heart.

Keywords: MICU1; MICU2; calcium; cardiomyocyte; mitochondrial calcium uniporter gating.


Conflict of interest statement

Competing interests statement:The authors declare no competing interest.

Figures

Fig. 1.
Fig. 1.
MICU1 is present and forms a complex with MCU in the human heart left ventricle. (A and B) Scatter plots of relative MCU and MICU1 (A) and MCU and MICU2 (B) protein levels in 32 normal human tissue types (indicated by individual circles) from a published quantitative mass spectrometry analysis (43). Values were normalized by the estimated mitochondrial content of each tissue (Methods). Linear regression fits and Pearson correlation coefficients are indicated and exclude brain tissues for MICU2. (C) Western blot analysis of MICU1, MICU2, MCU, and EMRE in mitochondria isolated from left ventricles of 12 different nonfailing human hearts. Heart mitochondria isolated from wild type (CTRL) and M1smKO mice were used as positive and negative controls. (D and E) Immunodetection of MICU1 and MCU in mitochondria isolated from human left ventricle analyzed by electrophoresis under native conditions (BN-PAGE: 1D) and again after transfer to denaturing conditions (2D). Red and blue arrows/boxes indicate the MICU1 and MCU immunoreactive bands/spots, respectively, under 1D and 2D conditions. Wild type (CTRL) and MICU1KO (M1KO) human embryonic kidney cell lysates were used as positive and negative controls.
Fig. 2.
Fig. 2.
Lifelong loss of MICU1 and MICU2 in the mouse CM results in impaired mitochondrial Ca2+ handling and altered mtCU abundance and composition. (A) Fluorometric assessment of mitochondrial Ca2+ clearance upon addition of CGP37157 (CGP, 10 μM) followed by 5 μM and 20 μM CaCl2 in permeabilized CM isolated from M1smKO (red) and M2KO (green) (representative traces). The Inset shows the maximum clearance attained upon 20 μM CaCl2 (mean ± SEM, n = 3). (B) Initial 45Ca2+ uptake (30 s) at 20 μM [Ca2+]c in the absence and presence of Ru265 in permeabilized CM (Upper). Initial 45Ca2+ uptake rates at various [Ca2+]c are shown after subtraction of the Ru265-insensitive uptake in a double logarithmic plot (mean ± SEM, n = 4 to 5). A generalized linear model was fit and the slopes are listed (Lower). (C, Left) Immunoblotting of MICU1, MCU, MICU2, EMRE, and mtHSP70 (loading control) in isolated M1smKO and M2KO CM. (C, Right) immunoblot quantification. Bar graphs show mean ± SEM for 3 to 11 CM preparations.
Fig. 3.
Fig. 3.
Acute loss of MICU1 and MICU2 in CM alters mitochondrial calcium handling and cause only EMRE or no compensation in mtCU composition. (A) Schematic representation of acute CM knock-out of Micu1 (M1iKO, red) and Micu2 (M2iKO, green) generated by tamoxifen induction in the Mer-Cre-Mer system, mean ± SEM. (B) Abundance of each mtCU component in CM isolated from male and female M1iKO and male M2iKO mice, respectively (n = 7 each). Initial 45Ca2+ uptake rates (after subtraction of the Ru265-insensitive uptake) at [Ca2+]c of 20 μM and 100 nM (n = 5 for male and n = 6 for female for M1iKO and n = 9 for male M2iKO). In each western blot, CTRL, M1-or M2KO, and CTRLc from the same cohort were ran together, and each of these conditions was normalized to the average of CTRL and CTRLc. (C) Ru265-sensitive 45Ca uptake at 100 nM divided by that at 20 µM is shown as a measure of gatekeeping for each genotype (n = 5 for male and n = 6 for female for M1iKO and n = 9 for male M2iKO). (D) Initial 45Ca2+ uptake rates at various [Ca2+]c are shown after subtraction of the Ru265-insensitive uptake in a double logarithmic plot (mean ± SEM, n = 5 for male and n = 6 for female for M1iKO and n = 9 for male M2iKO). A generalized linear model was fit and the slopes are listed (Lower).
Fig. 4.
Fig. 4.
MICUs control the [Ca2+]m rise in intact ~e15 CM during [Ca2+]c signals induced by KCl depolarization and electrical pacing. (A) Mean [Ca2+]c ([Ca2+]cyto) signals in M1KO (red) and control (CTRL, Micu1fl/fl/Micu1fl/KO, black) ~e15 intact CM measured by fura-2 AM and induced by increasing extracellular KCl concentration to 50 mM. n(CTRL) = 29, n(M1KO) = 11, individual runs corresponding to individual embryonic hearts. (B) The same as (A) for M2KO (green) and control (CTRL, Micu2fl/fl, black). n(CTRL) = 15, n(M2KO) = 16, individual runs corresponding to individual embryonic hearts. (C) Quantification of area under the curve (AUC) for [Ca2+]cyto in A and B. Dark gray (Micu1fl/fl/Micu1fl/KO), red (M1KO), light gray (Micu2fl/fl), green (M2KO). Mean ± SD. (D) Same as C for (E) and (F). Statistical analysis between M1KO or M2KO and corresponding CTRL by the Mann–Whitney rank sum test, *P < 0.05. (E) Mean [Ca2+]m ([Ca2+]mito) measured by mtRCamP simultaneously with (A). (F) Same as E for (B). (G) AUC for [Ca2+]m ([Ca2+]mito) in E and F plotted against AUC for [Ca2+]cyto in A and B. (H) Mean [Ca2+]c ([Ca2+]cyto) signals in M1KO (red trace) and CTRL (Micu1fl/fl/Micu1fl/KO, black trace) measured by fura-2 AM and induced by electrical pacing at 0.25 Hz at 20 V/cm. n(CTRL) = 29, n(M1KO) = 15. (I) Same as H at 1 Hz. (J) Same as H at 4 Hz. (K) Mean [Ca2+]m ([Ca2+]mito) measured by mtRCamP simultaneously with (I). (L) Same as K for (I). (M) Same as K for (J). (N) Quantification of AUC for [Ca2+]c ([Ca2+]cyto) in HJ. Dark gray (CTRL), red (M1KO). Mean ± SD. (O) Same as N for (KM). Statistical analysis by two-way repeated measures ANOVA with the Holm–Sidak post hoc test, *P < 0.05.
Fig. 5.
Fig. 5.
MICU1 dependence of Krebs cycle activity and cell vulnerability and death. (A and B) Total-PDH and p-PDH abundance in ~e15 CTRL and M1KO CM (representative immunoblots, four preparations for each genotype and bar charts). (C) Mean time course of ΔΨm in CTRL (Micu1fl/fl/Micu1fl/KO, black) and M1KO (red) ~e15 upon prolonged challenge with 50 mM KCl in the presence of H2O2 (200 µM H2O2) and elevated extracellular [Ca2+] (10 mM). TMRE fluorescence is normalized to the baseline after subtraction of the post-FCCP (Carbonyl cyanide-p-trifluoromethoxyphenylhydrazone) fluorescence (10 µM) + oligomycin (5 μg/mL). n = 6 (measurement days). (D) Quantification of ΔΨm for (C) at ~8 min after the treatment. Dark gray (CTRL); red (M1KO). Statistical analysis by Student’s t test. (E) Mean [Ca2+]c signals in MI1KO (red trace) and control (CTRL, Micu1fl/fl/Micu1fl/KO, black trace) ~e15 CM measured by fura-2 AM simultaneously with (A). (F) Cell survival upon MICU1 loss without and with compensation for the EMRE decrease, by transfection with pcDNA and EMRE, respectively.

References

    1. Rizzuto R., De Stefani D., Raffaello A., Mammucari C., Mitochondria as sensors and regulators of calcium signalling. Nat. Rev. Mol. Cell Biol. 13, 566–578 (2012). - PubMed
    1. McCormack J. G., Halestrap A. P., Denton R. M., Role of calcium ions in regulation of mammalian intramitochondrial metabolism. Physiol. Rev. 70, 391–425 (1990). - PubMed
    1. Boyman L., Greiser M., Lederer W. J., Calcium influx through the mitochondrial calcium uniporter holocomplex, MCU(cx). J. Mol. Cell Cardiol. 151, 145–154 (2021). - PMC - PubMed
    1. Pan X., et al. , The physiological role of mitochondrial calcium revealed by mice lacking the mitochondrial calcium uniporter. Nat. Cell Biol. 15, 1464–1472 (2013). - PMC - PubMed
    1. Luongo T. S., et al. , The mitochondrial calcium uniporter matches energetic supply with cardiac workload during stress and modulates permeability transition. Cell Rep. 12, 23–34 (2015). - PMC - PubMed

MeSH terms

LinkOut - more resources