. 2025 Jan;58(1):e13737.
doi: 10.1111/cpr.13737. Epub 2024 Aug 20.

Small molecule valproic acid enhances ventral patterning of human neural tube organoids by regulating Wnt and Shh signalling

Affiliations

Small molecule valproic acid enhances ventral patterning of human neural tube organoids by regulating Wnt and Shh signalling

Yuanyuan Zheng et al. Cell Prolif. 2025 Jan.

Abstract

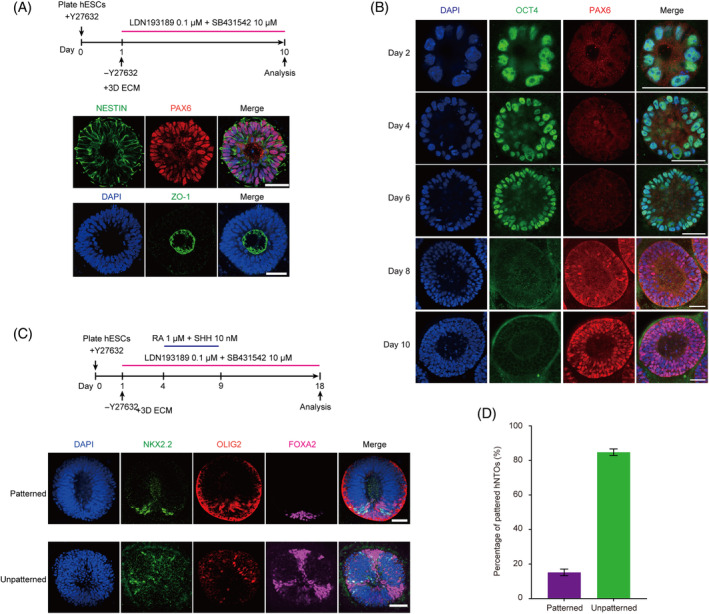
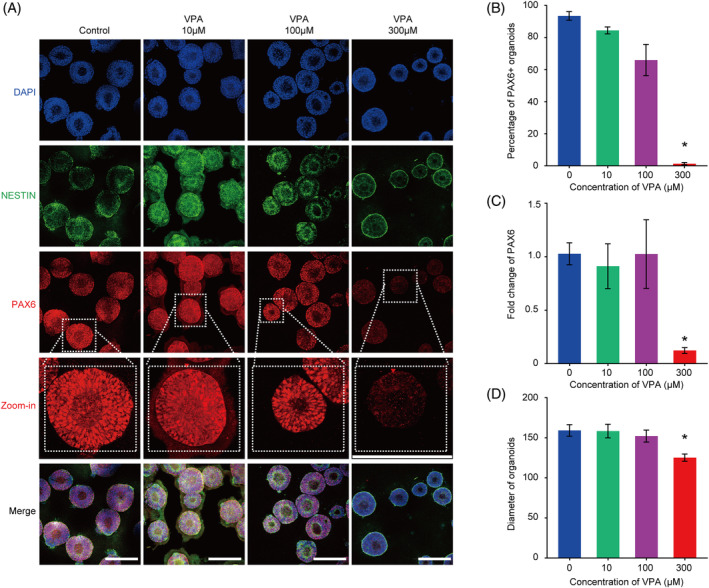
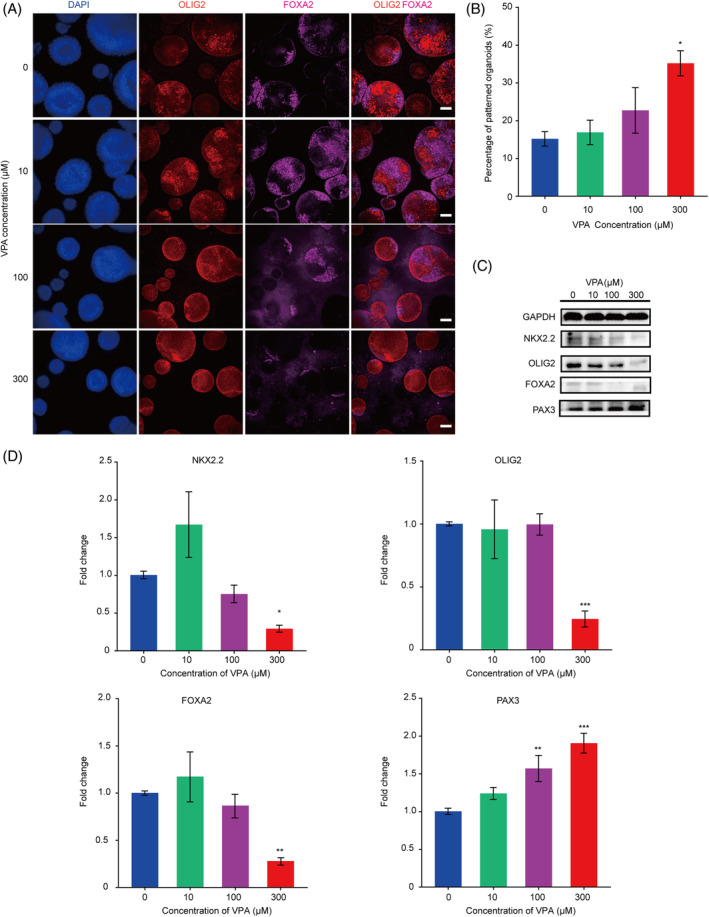
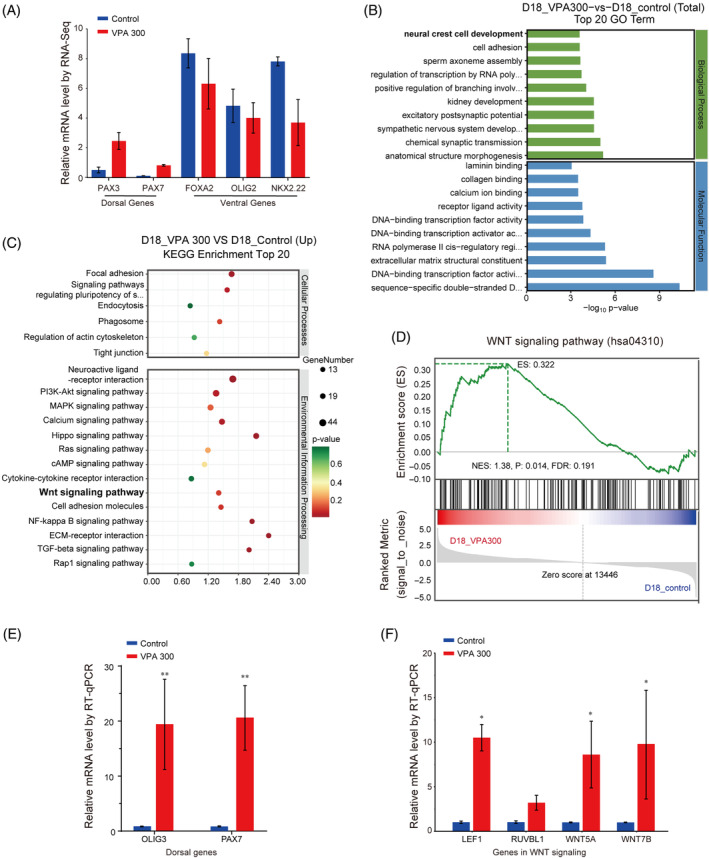
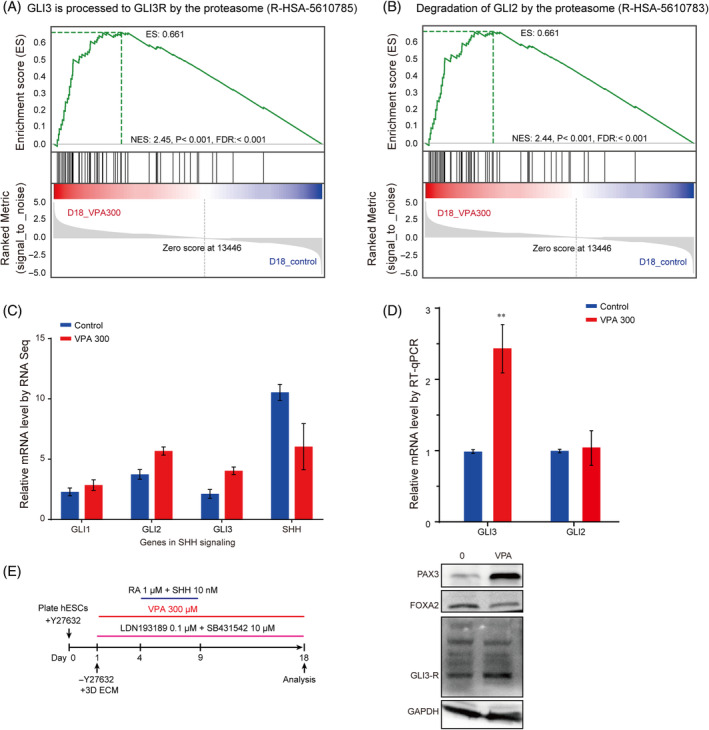
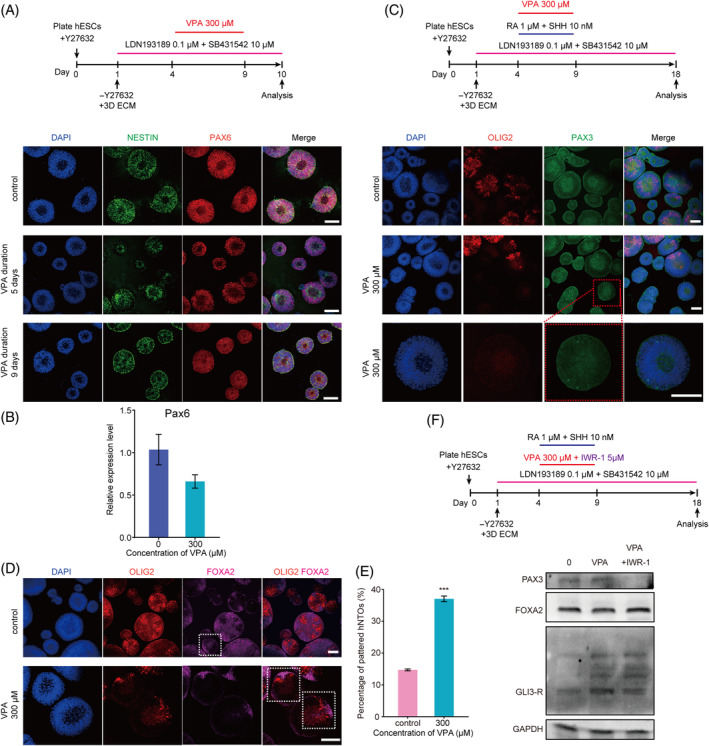
Valproic acid (VPA), a clinically approved small molecule, has been reported to activate Wnt signalling that is critical for dorsal-ventral (DV) patterning of neural tube. However, little is known about the impact of VPA on DV patterning process. Here, we show that even though VPA has a negative impact on the early formation of human neural tube organoids (hNTOs), it significantly enhances the efficiency of ventrally patterned hNTOs, when VPA is added during the entire differentiation process. RNA sequencing and RT-qPCR analysis demonstrates VPA activates endogenous Wnt signalling in hNTOs. Surprisingly, transcriptome analysis also identifies upregulation of genes for degradation of GLI2 and GLI3 proteins, whose truncated fragment are transcriptional repressors of Shh signalling. The Western-blot analysis confirms the increase of GLI3R proteins after VPA treatment. Thus, VPA might enhance ventral patterning of hNTOs through both activating Wnt, which can antagonise Shh signalling by inducing GLI3 expression, and/or inhibiting Shh signalling by inducing GLI protein degradation. We further obtain results to show that VPA still increases patterning efficiency of hNTOs with a weak influence on their early formation when the initiation time of VPA is delayed and its duration is reduced. Taken together, this study demonstrates that VPA enhances the generation of more reproducible hNTOs with ventral patterning, opening the avenues for the applications of hNTOs in developmental biology and regenerative medicine.


Conflict of interest statement

The authors declare that they have no competing interests.

Figures

FIGURE 1
FIGURE 1
The generation of dorsal–ventral (DV) patterned neural tube organoid. (A) Representative confocal micrographs of organoids at Day 10 exhibiting multicellular pseudostratified neuroepithelial tissue with lumen. DAPI‐counterstained nuclei. (B) Confocal micrographs showing the exit of pluripotency and neural conversion of hESCs in organoids. DAPI counterstained nuclei. (C) Representative confocal micrographs showing ventral patterned organoids obtained at day 18 stained for FOXA2, OLIG2, and NKX2.2 as indicated. DAPI counterstained nuclei. (D) Histogram graph showing percentages of 2 types organoids at days 18. A total of 200–400 cysts were counted from n = 4 independent experiments at day 18. Error bars are SEM. Scale bars, 50 μm (A, B and C).
FIGURE 2
FIGURE 2
Valproic acid (VPA) treatment inhibited the formation of primary hNTOs. (A) Representative image of 0, 10, 100, and 300 μM VPA‐treated primary hNTOs for PAX6 (red) and NESTIN (green) at day 10. The zoomed‐in images showing a magnified view of the area highlighted by the white square. Scale bars, 100 μm. (B) Quantification of the ratios of PAX6+ organoids at day 10 (n > 200 organoids each experiment). (C) RT‐qPCR analysis displaying relative mRNA expression of marker gene PAX6 of 0, 10, 100, and 300 μM VPA‐treated organoids. Experiments were performed in three biological replicates. (D) Primary hNTOs treated with 300 μM VPA showing a decreased size. Data bars in B, C and D represent mean ± SEM. *p ≤ 0.05.
FIGURE 3
FIGURE 3
Valproic acid (VPA) treatment enhanced the ventral patterning efficiency of hNTOs. (A) Representative image of 0, 10, 100, and 300 μM VPA‐treated hNTOs for OLIG2 (red) and FOXA2 (magenta) at day 18. Scale bars, 50 μm. (B) Quantification of the percentages of OLIG2 + FOXA2+ patterned organoids at day 18 (300 organoids were counted for each condition in one experiment). n = 3 independent experiments. Data bars represent mean ± SEM. *p ≤ 0.05. (C) Sample images of Western‐blot analysis of ventral marker NKX2.2, OLIG2, FOXA2 and dorsal marker PAX3 protein levels in organoids treated by different concentration VPA. (D) RT‐qPCR analysis displaying relative mRNA expression of genes NKX2.2, OLIG2, FOXA2 and PAX3 of 0, 10, 100, and 300 μM VPA‐treated organoids. Experiments were performed in three biological replicates. *p ≤ 0.05, **p ≤ 0.01, ***p ≤ 0.001.
FIGURE 4
FIGURE 4
Wnt signalling was upregulated in VPA‐treated hNTOs compared with control hNTOs. (A) The graph shows RNA‐seq results (normalised FPKM) of dorsal and ventral genes. The normalised FPKM of dorsal genes were increased, whereas the mRNA expression of ventral genes was decreased in VPA‐treated hNTOs. (B) The bar graph shows the top 10 significant items in the biological process and molecular function fractions based on the p values in the GO analysis. (C) KEGG enrichment analysis of up‐regulated DEGs revealed upregulated DEGs were mainly associated with Wnt, TGF‐β signalling, PI3K‐Akt signalling, Hippo signalling neuroactive ligand–receptor interaction, ECM–receptor interaction pathways in VPA‐treated hNTOs. (D) Gene set enrichment plot depicting the elevated positive regulation of the Wnt signalling pathway in VPA‐treated hNTOs. (E) The graph shows RT‐qPCR confirmation results for dorsal genes PAX7 and OLIG3 induced by Wnt signalling. (F) The graph shows RT‐qPCR confirmation results for selected genes enriched in Wnt signalling. The mRNA expression of LEF1, RUVBL1, WNT5A and WNT7B was increased in VPA‐treated hNTOs using RNA samples for RNA‐seq under independent triplicates per sample. Data bars in (E and F) represent mean ± SEM from three independent experiments. *p ≤ 0.05, **p < 0.01.
FIGURE 5
FIGURE 5
Degradation of GLI protein was induced by VPA in hNTOs. (A) GSEA of the pathway termed “GLI3 is processed to GLI3R by the proteasome” in VPA‐treated hNTOs compared with control, showing global upregulation of key genes involved in GLI3 processed to GLI3R. (B) GSEA of the pathway termed ‘Degradation of GLI2 by the proteasome’ in VPA‐treated hNTOs compared with control, showing global upregulation of key genes involved in degradation of GLI2. (C) The RNA‐seq data identified upregulation of Shh signalling pathway transcription factors GLI1, GLI2, GLI3 mRNAs and downregulation of SHH mRNAs. (D) RT‐qPCR data showing the downregulation of GLI3, whereas GLI2 expression was not affected. **p < 0.01. (E) Sample images of Western‐blot analysis showing the expression levels of Gli3‐R protein, ventral marker FOXA2 and dorsal marker PAX3 protein in organoids treated by 300 μM VPA for 18 days.
FIGURE 6
FIGURE 6
Decrease duration of valproic acid (VPA) enhances ventral patterning of hNTOs. (A) Representative image of primary hNTOs for PAX6 (red) and NESTIN (green) at day 10 when the duration time of VPA is reduced to 5 days. (B) RT‐qPCR data showing the downregulation of PAX6, but not significant. (C) Representative micrographs showing organoids obtained at day 18 stained for PAX3 and OLIG2 after the duration time of VPA was reduced to 5 days. The zoomed‐in images showing a magnified view of the area highlighted by the red square. (D) Representative confocal micrographs showing ventral patterned organoids obtained at day 18 stained for OLIG2 and FOXA2 after the duration time of VPA was reduced to 5 days. (E) Histogram graph showing percentages of ventral patterned organoids at days 18 after the duration time of VPA was reduced to 5 days. Data bars represent mean ± SEM. *p ≤ 0.05. (F) Sample images of Western‐blot analysis showing the expression levels of GLI3‐R protein, ventral marker FOXA2 and dorsal marker PAX3 protein in organoids treated by 300 μM VPA or 300 μM VPA + 5 μM IWR‐1 for 5 days. Scale bars, 50 μm (A, C and D). DAPI counterstained nuclei.

Similar articles

References

    1. Sullivan‐Brown J, Goldstein B. Neural tube closure: the curious case of shrinking junctions. Curr Biol. 2012;22:R574‐R576. doi:10.1016/j.cub.2012.06.048 - DOI - PubMed
    1. Nikolopoulou E, Galea GL, Rolo A, Greene ND, Copp AJ. Neural tube closure: cellular, molecular and biomechanical mechanisms. Development. 2017;144:552‐566. doi:10.1242/dev.145904 - DOI - PMC - PubMed
    1. Le Dreau G, Marti E. Dorsal‐ventral patterning of the neural tube: a tale of three signals. Dev Neurobiol. 2012;72:1471‐1481. doi:10.1002/dneu.22015 - DOI - PubMed
    1. Liem KF Jr, Tremml G, Roelink H, Jessell TM. Dorsal differentiation of neural plate cells induced by BMP‐mediated signals from epidermal ectoderm. Cell. 1995;82:969‐979. doi:10.1016/0092-8674(95)90276-7 - DOI - PubMed
    1. Chizhikov VV, Millen KJ. Roof plate‐dependent patterning of the vertebrate dorsal central nervous system. Dev Biol. 2005;277:287‐295. doi:10.1016/j.ydbio.2004.10.011 - DOI - PubMed

MeSH terms

LinkOut - more resources