. 2024 Nov 14;83(12):1707-1721.
doi: 10.1136/ard-2024-226067.

Positive feedback loop PU.1-IL9 in Th9 promotes rheumatoid arthritis development

Affiliations

Positive feedback loop PU.1-IL9 in Th9 promotes rheumatoid arthritis development

Jiajie Tu et al. Ann Rheum Dis. .

Abstract

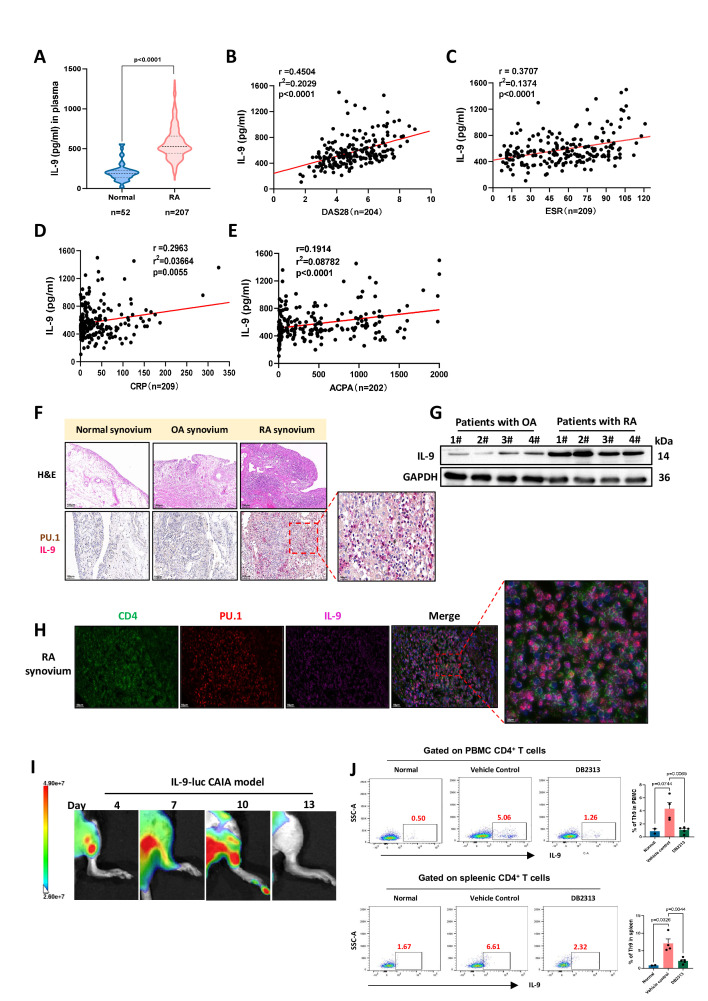
Objectives: T helper 9 (Th9) cells are recognised for their characteristic expression of the transcription factor PU.1 and production of interleukin-9 (IL-9), which has been implicated in various autoimmune diseases. However, its precise relationship with rheumatoid arthritis (RA) pathogenesis needs to be further clarified.

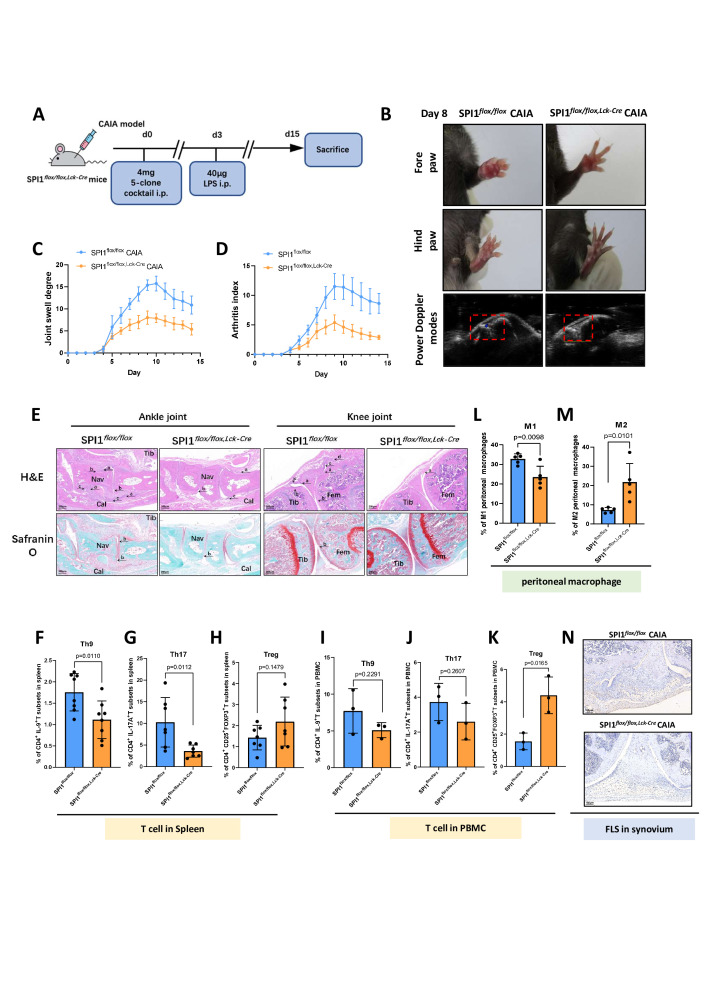
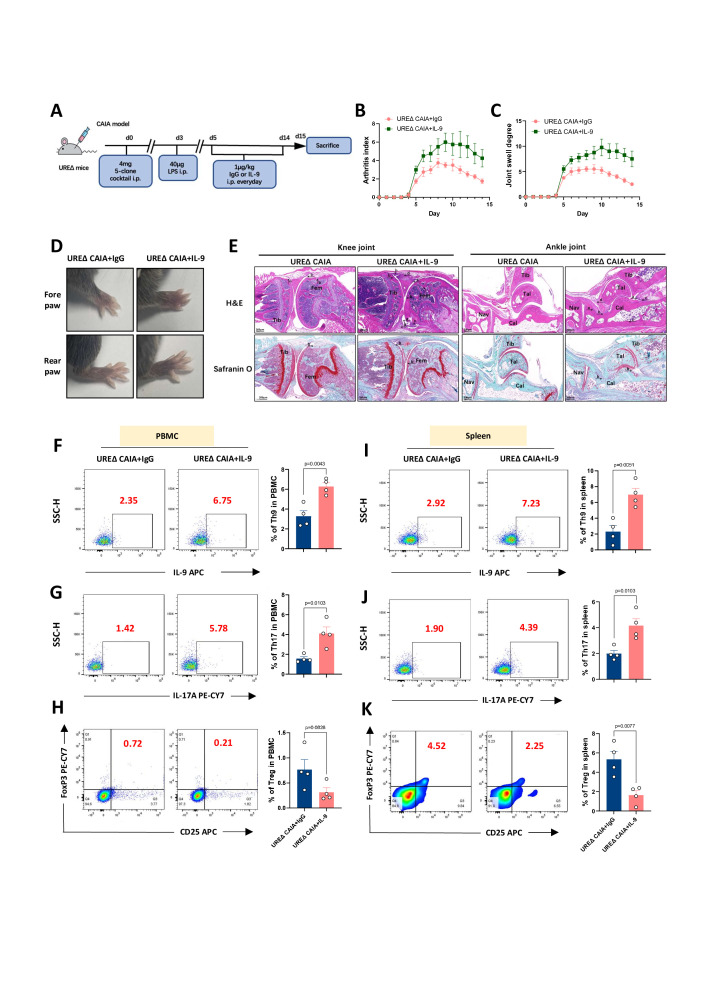
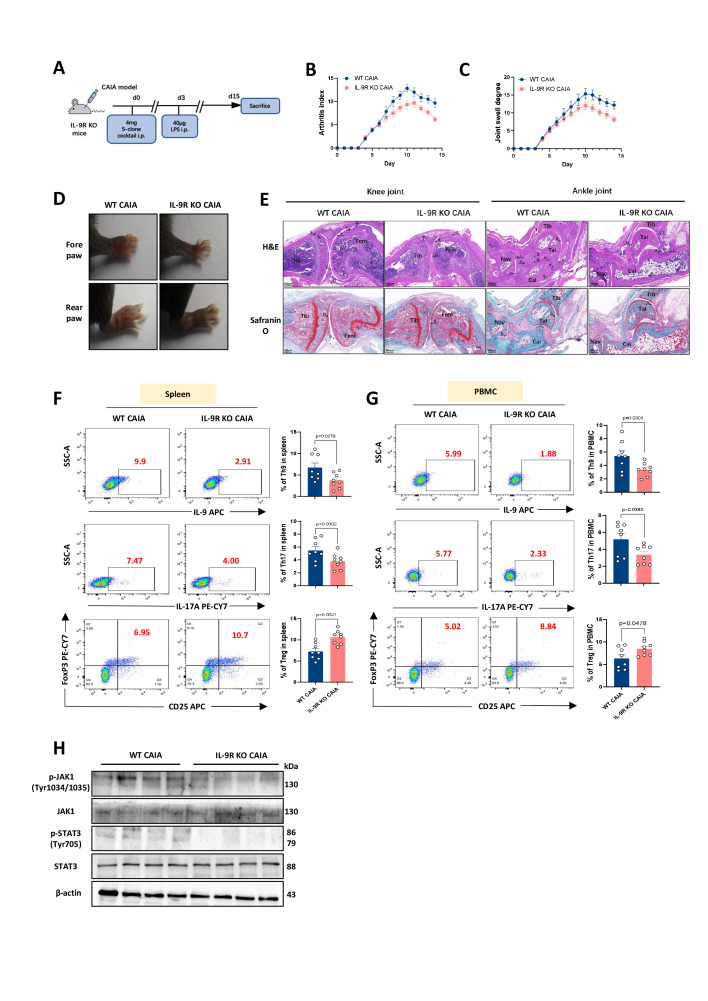
Methods: The expression levels of PU.1 and IL-9 in patients with RA were determined by ELISA, western blotting (WB) and immunohistochemical staining. PU.1-T cell-conditional knockout (KO) mice, IL-9 KO and IL-9R KO mice were used to establish collagen antibody-induced arthritis (CAIA), respectively. The inhibitor of PU.1 and IL-9 blocking antibody was used in collagen-induced arthritis (CIA). In an in vitro study, the effects of IL-9 were investigated using siRNAs and IL-9 recombinant proteins. Finally, the underlying mechanisms were further investigated by luciferase reporter analysis, WB and Chip-qPCR.

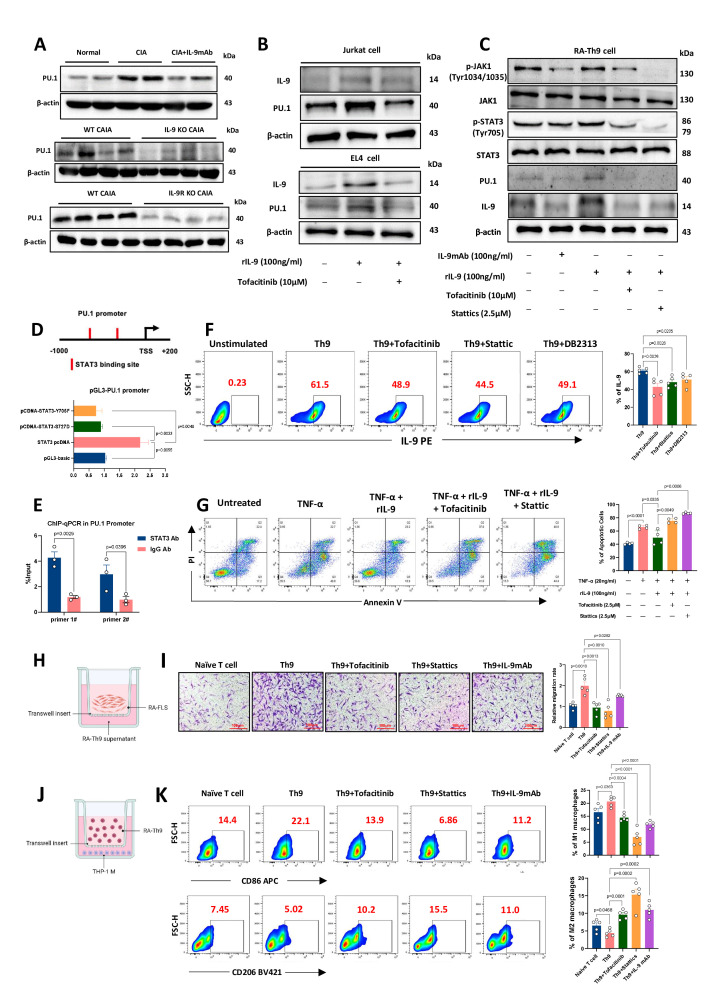
Results: The upregulation of IL-9 expression in patients with RA exhibited a positive correlation with clinical markers. Using CAIA and CIA model, we demonstrated that interventions targeting PU.1 and IL-9 substantially mitigated the inflammatory phenotype. Furthermore, in vitro assays provided the proinflammatory role of IL-9, particularly in the hyperactivation of macrophages and fibroblast-like synoviocytes. Mechanistically, we uncovered that PU.1 and IL-9 form a positive feedback loop in RA: (1) PU.1 directly binds to the IL-9 promoter, activating its transcription and (2) Th9-derived IL-9 induces PU.1 via the IL-9R-JAK1/STAT3 pathway.

Conclusions: These results support that the PU.1-IL-9 axis forms a positive loop in Th9 dysregulation of RA. Targeting this signalling axis presents a potential target approach for treating RA.

Keywords: Arthritis, Rheumatoid; Cytokines; T-Lymphocytes.


Conflict of interest statement

Competing interests: None declared.

Figures

Figure 1
Figure 1. The relationship of PU.1 and IL-9 in patients with RA and arthritic mice. (A) IL-9 expression was analysed in peripheral blood from the normal control group and patients with RA (n=52 and 207, respectively). (B–E) Pearson correlation test examined IL-9 correlation with DAS28, ESR, CRP and ACPA (n=204, 209, 209 and 202, respectively). (F) Co-localisation of IL-9 and PU.1 in the synovium was compared among normal controls, patients with OA and RA (n=3). (G) IL-9 protein expression in RA and OA synovium was compared (n=4). (H) Co-localisation of PU.1, IL-9 and CD4 in the joint synovium of patients with RA (n=3). (I) Bioluminescence imaging demonstrates IL-9 signal in joint was positively correlated with progress of CAIA (n=4). (J) DB2313 effect on the proportions of Th9 in the spleen and PBMCs of collagen-induced arthritis (CIA) mice assessed by flow cytometry (n=4–5). ACAP, anticitrullinated protein antibodies; CAIA, collagen antibody-induced arthritis; CRP, C reactive protein; DAS28, Disease Activity Score 28; ESR, erythrocyte sedimentation rate; OA, osteoarthritis; PBMCs, peripheral blood mononuclear cells; RA, rheumatoid arthritis.
Figure 2
Figure 2. Effects of PU.1 on Th9 of SPI1: LCK-cre mice-established CAIA model. (A) A CAIA model was constructed using PU.1 LCK-cre conditional knockout mice (SPI1flox/flox,Lck-Cre). (B) PU.1 KO effect in T cells on joint swelling of CAIA model (n=8). (C, D) PU.1 KO effect in T cells on joint swelling number and arthritis index of CAIA model. (E) H&E and Safranin O staining were used to evaluate PU.1 KO effect in T cells on joint pathology of the CAIA model (n=3). (F–K) Flow cytometry analysis shows PU.1 KO effect in T cells on Th9, Th17 and Treg in spleen and PBMC of CAIA model (n=3–8). (L, M) Flow cytometry analysis demonstrates PU.1 KO effect in T cells on peritoneal macrophage polarisation of CAIA model (n=5). (N) IHC shows PU.1 KO effect in T cells on FLS (FAP-α+) of CAIA model (n=3). CAIA, collagen antibody-induced arthritis; FLS, fibroblast-like synoviocytes; IHC, immunohistochemical; KO, knockout; LPS, lipopolysaccharide; PBMC, peripheral blood mononuclear cell.
Figure 3
Figure 3. Effects of PU.1-IL9 axis on Th9, macrophage and RA-FLS in vitro. (A) Illustration depicting the in vitro differentiation process of CD4+ naive T cells from patients with RA into Th9 cells. (B) Effect of siRNA-mediated PU.1 knockdown on Th9 differentiation (n=5). (C) Luciferase reporter assay demonstrates direct binding of PU.1 to IL-9 promoter region (n=4). (D) CHIP-qPCR verifies the binding of PU.1 protein to the IL-9 promoter region (n=3). (E) Experimental design diagram of the effect of PU.1-IL9 axis on RA-FLS in vitro. (F) Transwell assay to verify the effect of PU.1-IL9 axis on the migration of RA-FLS in vitro (n=5). (G) CCK-8 method to verify PU.1-IL9 axis effect on proliferation of RA-FLS in vitro (n=3). (H) RT-qPCR was employed to assess the expression levels of MMPs in RA-FLS (n=3). (I) Experimental design diagram of PU.1-IL9 axis effect on macrophages in vitro. (J) Flow cytometry analysis shows PU.1-IL9 axis effect on macrophage polarisation in vitro (n=4–5). (K) RT-qPCR was employed to assess the expression levels of proinflammatory factors in macrophages (n=3). FLS, fibroblast-like synoviocytes; PBMC, peripheral blood mononuclear cell; RA, rheumatoid arthritis.
Figure 4
Figure 4. Effects of PU.1 on Th9 of UREΔ mice-established CAIA model. (A) CAIA model was established using PU.1 knockdown mice (UREΔ mice). (B, C) Arthritis index and the count of joint swellings in the CAIA model established in UREΔ mice with exogenous IL -9 supplementation (n=4). (D) Images illustrating joint swelling in the UREΔ mice-established CAIA model with exogenous IL-9 supplementation. (E) H&E and Safranin O staining performed to evaluate joint pathology in the CAIA model established in UREΔ mice with exogenous IL-9 supplementation (n=3). (F–K) Flow cytometry was used to determine the proportions of Th9, Th17 and Treg cells in the spleen and PBMC of UREΔ mice in the CAIA model with exogenous IL-9 supplement (n=4). CAIA, collagen antibody-induced arthritis; PBMC, peripheral blood mononuclear cell.
Figure 5
Figure 5. IL-9 deficiency and IL-9 neutralising monoclonal antibody ameliorate arthritis progression. (A) CAIA model is contrasted by IL-9 knockout mice (IL-9 KO mice). (B) Joint swelling images of IL-9 KO mice-established CAIA model. (C) Arthritis index and the count of joint swellings were measured in the IL-9 KO mice-established CAIA model (n=4). (D) H&E and Safranin O staining were performed to evaluate the joint pathology in the IL-9 KO mice-established CAIA model (n=3). (E, F) Flow cytometry used to detect the proportions of Th9, Th17 and Treg cells in the spleen and PBMC of IL-9 KO mice-established CAIA model (n=4). (G) Evaluate the efficacy of IL-9 neutralising mAb treatment in CIA mice. (H) Examine the relieving effect of IL-9 blockade on joint swelling in CIA mice (n=3). (I) IL-9 blockade effect on the number of joint swellings and arthritis index in CIA mice. (J) Evaluate the effect of IL-9 blockade on joint pathology in CIA mice using H&E,Safranin O and TRAP staining (n=3). (K) Examine the effect of IL-9 blockade on joint bone injury in CIA mice using microCT (n=3). (L) Examine the effect of IL-9 blockade on Th9, Th17 and Treg subpopulations in CIA mice using flow cytometry (n=3). CAIA, collagen antibody-induced arthritis; CIA, collagen-induced arthritis; KO, knockout.
Figure 6
Figure 6. IL-9R KO alleviates CAIA arthritis progression. (A) CAIA model is constructed using IL-9 receptor knockout mice (IL-9R KO). (B, C) IL-9R KO effect on number of arthritis index and joint swelling in CAIA mice. (D) IL-9R KO relieving effect on joint swelling in CAIA mice (n=8). (E) Evaluate the effect of IL-9R KO on knee and ankle joint pathology of the CAIA model using H&E and Safranin O staining (n=3). (F, G) Using flow cytometry to analyse changes in Th9, Th17 and Treg in PBMC and spleen of the CAIA model constructed using IL-9R KO mice (n=8). (H) Western blot of JAK1/STAT1 in spleen from control and IL-9 KO mice-established CAIA models (n=4). CAIA, collagen antibody-induced arthritis; KO, knockout; PBMC, peripheral blood mononuclear cell.
Figure 7
Figure 7. IL-9 promotes PU.1 expression in Th9 cells via JAK1/STAT3 pathway. (A) Western blot analysis was performed to detect PU.1 expression in the spleen of CIA mice treated with IL-9 blocking antibody (n=6), CAIA model mice with IL-9 KO (n=4) and CAIA model mice with IL-9R KO (n=4), respectively. (B) Western blot analysis was performed to detect PU.1 expression in Jurkat and EL4 cells treated with recombinant IL-9 and the JAK inhibitor tofacitinib (n=3). (C) Western blot analysis was performed to detect the IL-9 effect on the JAK1/STAT3 pathway in RA-Th9 cells (n=3). (D, E) Luciferase reporter assay and CHIP-qPCR were used to validate how STAT3 activates PU.1 transcription by directly binding to the promoter region of PU.1 (n=3). (F) Flow cytometry was used to detect the JAK inhibitor tofacitinib effect, STAT3 inhibitor statics and PU.1 inhibitor DB2313 on the release of IL-9 from Th9 cells (n=5). (G) Flow cytometry was used to detect IL-9 and statin effect on TNF-α-induced apoptosis in Th9 cells (n=4). (H) FLS is cultured with supernatant from RA-Th9. (I) Assess the effects of tofacitinib, stattics and IL-9mAb on the cell migration of RA-FLS after treatment with the supernatant from RA-Th9 cells. (J) macrophages are co-cultured with RA-Th9. (K) Effects of tofacitinib, stattics and IL-9mAb on macrophage polarisation after co-culturing with RA-Th9 (n=5). CAIA, collagen antibody-induced arthritis; CIA, collagen-induced arthritis; FLS, fibroblast-like synoviocytes.

Similar articles

Cited by

References

    1. Finckh A, Gilbert B, Hodkinson B, et al. Global epidemiology of rheumatoid arthritis. Nat Rev Rheumatol. 2022;18:591–602. doi: 10.1038/s41584-022-00827-y. - DOI - PubMed
    1. Gravallese EM, Firestein GS. Rheumatoid arthritis - common origins, divergent mechanisms. N Engl J Med. 2023;388:529–42. doi: 10.1056/NEJMra2103726. - DOI - PubMed
    1. Di Matteo A, Bathon JM, Emery P. Rheumatoid arthritis. Lancet. 2023;402:01525–8. doi: 10.1016/S0140-6736(23)01525-8. - DOI - PubMed
    1. Bullock J, Rizvi SAA, Saleh AM, et al. Rheumatoid arthritis: a brief overview of the treatment. Med Princ Pract. 2018;27:501–7. doi: 10.1159/000493390. - DOI - PMC - PubMed
    1. Tu J, Huang W, Zhang W, et al. Two main cellular components in rheumatoid arthritis: communication between T cells and fibroblast-like synoviocytes in the joint synovium. Front Immunol. 2022;13:922111. doi: 10.3389/fimmu.2022.922111. - DOI - PMC - PubMed

MeSH terms