. 2024 Aug 21;15(1):7141.
doi: 10.1038/s41467-024-51337-2.

CAR T-cell-mediated delivery of bispecific innate immune cell engagers for neuroblastoma

Affiliations

CAR T-cell-mediated delivery of bispecific innate immune cell engagers for neuroblastoma

Guillem Pascual-Pasto et al. Nat Commun. .

Abstract

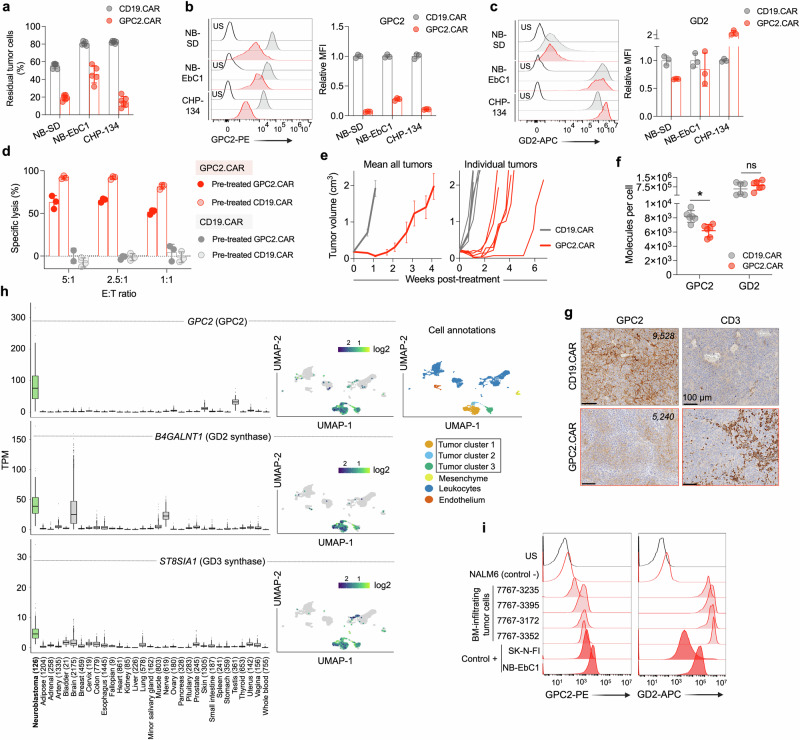
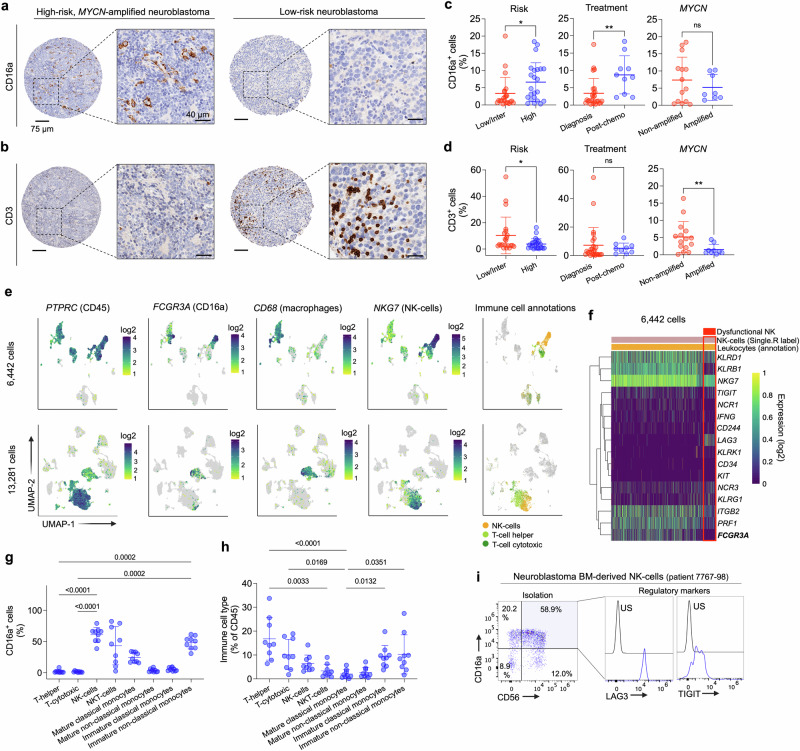
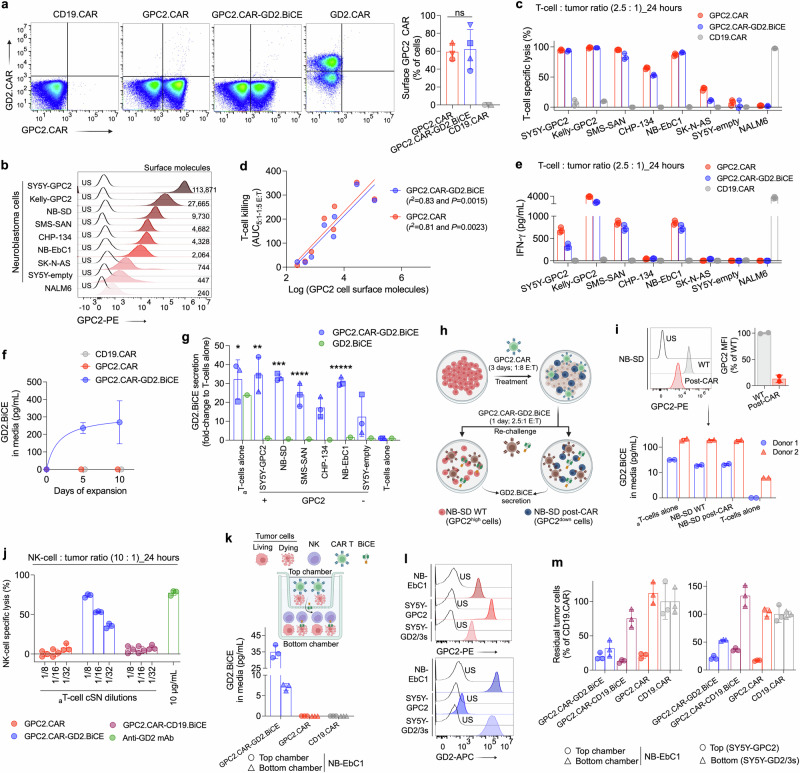
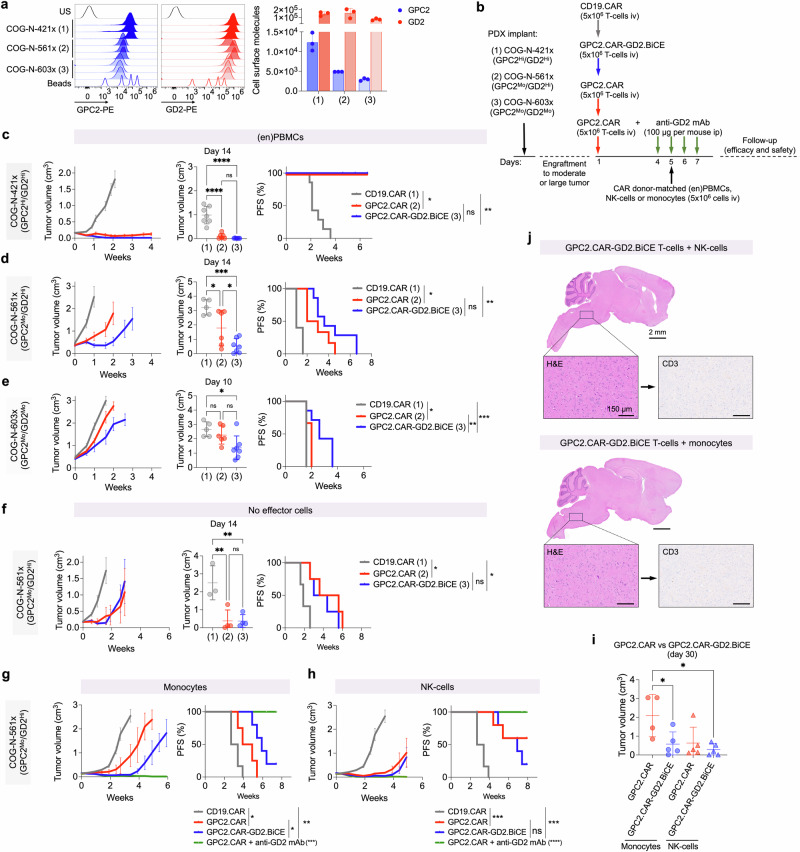
Novel chimeric antigen receptor (CAR) T-cell approaches are needed to improve therapeutic efficacy in solid tumors. High-risk neuroblastoma is an aggressive pediatric solid tumor that expresses cell-surface GPC2 and GD2 with a tumor microenvironment infiltrated by CD16a-expressing innate immune cells. Here we engineer T-cells to express a GPC2-directed CAR and simultaneously secrete a bispecific innate immune cell engager (BiCE) targeting both GD2 and CD16a. In vitro, GPC2.CAR-GD2.BiCE T-cells induce GPC2-dependent cytotoxicity and secrete GD2.BiCE that promotes GD2-dependent activation of antitumor innate immunity. In vivo, GPC2.CAR-GD2.BiCE T-cells locally deliver GD2.BiCE and increase intratumor retention of NK-cells. In mice bearing neuroblastoma patient-derived xenografts and reconstituted with human CD16a-expressing immune cells, GD2.BiCEs enhance GPC2.CAR antitumor efficacy. A CAR.BiCE strategy should be considered for tumor histologies where antigen escape limits CAR efficacy, especially for solid tumors like neuroblastoma that are infiltrated by innate immune cells.


Conflict of interest statement

G.P.-P. and K.R.B. report having a pending patent directly related to this work entitled Dual targeting of pediatric malignancies through CAR T cells secreting Bispecific Innate Immune Cell Engagers (BICEs) (International Patent Application No. PCT/US2022/080935). M.Y., D.S.D., W.L. and K.R.B. hold patents for the discovery and development of other immunotherapies for cancer, including patents related to GPC2 and CD16a-directed immunotherapies. M.Y. is a co-founder of Hula Therapeutics. K.R.B. receives royalties and research funding from Tmunity/Kite Pharma and ConjugateBio for research on GPC2-directed immunotherapies. K.R.B. is on the ConjugateBio Scientific Advisory Board. K.M.B. has received research funding from Syndax. The remaining authors declare no competing interests.

Figures

Fig. 1
Fig. 1. GPC2.CAR-treated tumor cells downregulate GPC2 but maintain expression of GD2.
a Quantification of residual neuroblastoma cells after GPC2 or CD19 CAR T-cell co-incubation for 4 days [effector:tumor (E:T) ratio of 1:2.5]. Means and SDs are shown (n = 6 technical replicates). b (left) Flow cytometry histograms of GPC2 expression on neuroblastoma cells after GPC2 or CD19 CAR T-cell co-incubation in (a). (right) Fold-change GPC2 cell surface expression on GPC2.CAR vs. CD19.CAR-treated cells. Means and SDs are shown (n = 3 technical replicates). c (left) Flow cytometry histograms of GD2 expression on neuroblastoma cells after GPC2 or CD19 CAR T-cell co-incubation in (a). (right) Fold-change GD2 expression on GPC2.CAR vs. CD19.CAR-treated cells. Means and SDs are shown (n = 3 technical replicates). d CAR T-cell (CD19.CAR or GPC2.CAR) re-exposure assay after 24 hours of co-incubation with CHP-134 cells that were previously exposed to GPC2 or CD19.CAR T cells for 4 days at a 1:2.5 E:T ratio as shown in (a). Means and SDs are shown (n = 3 technical replicates). e (left) Serial tumor volumes of NB-EbC1 xenografts treated with CAR T-cells (CD19.CAR, n = 6 and GPC2.CAR, n = 8). Means and SEM are shown. (right) Individual volumes of tumors used to quantify GPC2 and GD2 expression by flow cytometry in (f). f Quantification of GPC2 and GD2 cell surface molecules from tumors in (e). *P = 0.004 (Mann Whitney t-test; two-tailed). Means and SDs are shown (n = 6). g GPC2 and CD3 immunohistochemistry (IHC) from a representative tumor from both control CD19.CAR and GPC2.CAR-treated mice in (e). Scale bars are indicated. Cell surface molecules determined by flow cytometry of the same tumors are indicated. h (left panels) Plots displaying GPC2, B4GALNT1 and ST8SIA1 expression in high-risk neuroblastoma patient tumors (n = 126) compared to normal tissue RNA sequencing data (n = 16,233 samples across 31 unique normal tissues, n = 9–2175 samples per tissue). N for each tissue is indicated. Box plots extend from first to third-quartile, horizontal line is the median and error bars represent the 1.5 interquartile range from the first-and third-quartile. (right panels) Single-cell RNA-seq plots showing single-cell expression of GPC2, B4GALNT1 and ST8SIA1 (6442 cells). A UMAP defining the main cell identities is shown. i GPC2 and GD2 flow histograms from bone marrow-infiltrating neuroblastoma cells (n = 4). NALM6 cells were used as a negative control, and NB-EbC1 and SK-N-FI cells were used as positive controls. Gating strategies are shown in Supplementary Fig. 1e. US unstained, MFI mean fluorescence intensity. Represented data has been validated with at least 2 independent experiments. Source data are provided as a Source Data file.
Fig. 2
Fig. 2. High-risk neuroblastoma tumors harbor a substantial infiltration of CD16a-expressing innate immune cells.
a CD16a IHC of representative high-risk (MYCN amplified; left) and low-risk (right) neuroblastoma tumors, respectively. Scales bars are indicated. b CD3 IHC of the same tumors shown in (a). Scales bars are indicated. c Percentage of CD16a+ cells in tumors stratified by International Neuroblastoma Risk Group (INRG) (low/intermediate; n = 22 vs. high; n = 23), previous chemotherapy treatment [diagnosis; n = 25 vs. post-chemo (only high-risk); n = 10] and MYCN amplification (non-amplified; n = 14 vs. amplified; n = 8) included in the TMA. *P = 0.038 and **P = 0.004 (Unpaired t-test; two-tailed). Means and SDs are shown. d Percentage of CD3+ cells in tumors stratified by INRG (low/intermediate; n = 22 vs. high; n = 24), previous chemotherapy treatment [diagnosis; n = 26 vs. post-chemo (only high-risk); n = 9] and MYCN amplification (non-amplified; n = 15 vs. amplified; n = 9) included in the TMA. *P = 0.034 and **P = 0.027 (Unpaired t-test; two-tailed). MS neuroblastomas were excluded from the analyses in (c and d). Means and SDs are shown. e Expression of PTPRC (encoding CD45), FCGR3A (encoding CD16a), CD68 (defining macrophages) and NKG7 (defining NK-cells) in 2 neuroblastoma single cell datasets (6442 and 13,281 cells, respectively). SingleR analysis was also used to label different cell types [NK-cells and T-cells (helper and cytotoxic); right]. f Heatmap showing single-cell expression profiles (n = 16 NK-related genes) in the subset of NK-cells identified in dataset in (e) (top). Red box indicates the subpopulation of NK-cells with potential dysfunctional properties. FCGR3A is highlighted in bold. g Percentage of CD16a-positive cells in immune cell subsets present in neuroblastoma-infiltrated bone marrows. P values are shown in graph (One-way ANOVA plus Dunn’s multiple comparison test). Means and SDs are shown (n = 9). h Immune cell types present in neuroblastoma-infiltrated bone marrows. Percentage of total CD45 cells is indicated. P values are shown in graph (One-way ANOVA plus Dunn’s multiple comparison test). Means and SDs are shown (n = 9). Gating strategies are shown in Supplementary Fig. 2. i (left) Dot plots showing co-expression of CD56 and CD16a on NK-cells isolated from a neuroblastoma-infiltrating patient BM specimen. (right) Flow cytometry histograms showing TIGIT and LAG3 levels on BM-derived NK-cells. For further clinical information see Supplementary Table 2. US unstained, inter intermediate, chemo chemotherapy. Source data are provided as a Source Data file.
Fig. 3
Fig. 3. Development and characterization of bicistronic CAR vectors secreting bispecific innate immune cell engagers (BiCE).
a Graphical illustration of T-cell GPC2.CAR expression and GD2.BiCE secretion. b Schematic representation of transgenes for two BiCE-secreting GPC2.CAR constructs targeting GD2 and CD19 (GPC2.CAR-GD2.BiCE and GPC2.CAR-CD19.BiCE, respectively), as well as single GPC2.CAR, CD19.CAR and GD2.BiCE constructs. c Detection of GD2 BiCE by western blot (His-tag) in cSN from HEK293T cells transfected with GPC2.CAR-GD2.BiCE vector. d Binding assays detecting secondary His-tag expression on tumor cells incubated with cSN from HEK293T cells transfected with different constructs as indicated. e Correlation between GD2 BiCE binding and GD2 cell surface expression in NB cell lines. Spearman correlation (two-tailed). f Illustration (left) and histograms (right) of binding assay evaluating human recombinant CD16a protein binding to tumor cells incubated with different CAR construct cSNs. g Illustration (left) and histograms (right) of binding assay evaluating 1A7 binding to human primary NK-cells or T-cells incubated with different CAR construct cSNs. 1, control medium; 2, GPC2.CAR; 3, GPC2.CAR-CD19.BiCE; and 4, GPC2.CAR-GD2.BiCE in (d, f, and g). h NK-cell-mediated specific lysis of NB-EbC1 cells in the presence of cSNs (5 ng/mL of His-tagged BiCE), or dinutuximab (10 µg/mL) as a positive control. *P = 0.0009 and **P = 0.0028 (One-way ANOVA plus Tukey’s multiple comparison test). Means and SDs are shown (n = 3 independent donors). i Co-expression of CD107a and CD69 by flow cytometry in NK-cells from the cytotoxicity experiment in (h). *P = 0.0003 (One-way ANOVA plus Tukey’s multiple comparison test). Means and SDs are shown (n = 3 independent donors). j IFN-γ levels measured by ELISA in NK-cell supernatants from the cytotoxicity experiment in (h). *P = 0.0028 (One-way ANOVA plus Tukey’s multiple comparison test). Means and SDs are shown (n = 3 independent donors). k Polyfunctionality pie charts indicating the percentage of single NK-cells secreting 1 or more cytokine when cultured alone or in the presence of NB-EbC1 cells together with GD2 BiCE, CD19 BiCE or dinutuximab as in (h). l NK92 WT vs. NK92-CD16a cell cytotoxicity against NB-EbC1 cells co-incubated with different cSNs or dinutuximab (10 µg/mL) as a positive control after 24 hours at a 10:1 E:T ratio. Means and SDs are shown (n = 3 technical replicates). m (left) Percentage of CD107a+ NK-cells isolated from either neuroblastoma-infiltrating BM aspirates or peripheral blood of healthy donors after 24 hours of co-incubation with NB-EbC1 cells and cSNs (from GPC2.CAR-GD2.BiCE or GPC2.CAR-CD19.BiCE; 5 ng/mL). *P = 0.0139 and **P < 0.0001 (Paired, two-way ANOVA plus Šídák’s multiple comparisons test). (right) Quantification of residual tumor cells (CD45-/GD2+) in the same samples. A total of 4 BMs were utilized and shown with different symbols. The degree of opacity indicates the E:T ratio utilized for each BM sample (10:1, 5:1 and 2.5:1; lower to higher opacity). The same E:T ratios were utilized for healthy donor blood NK-cells to facilitate comparison between groups. n (left) Representative contour plots of phagocytosis assay with GFP-labeled NB-EbC1 cells exposed to different cSNs or dinutuximab (10 µg/mL) together with macrophages. Macrophages alone are shown to define GFP+/CD11b+ cells. (right) Quantification of NB-EbC1 phagocytosis. Means and SDs are shown (n = 3 technical replicates). TM transmembrane, neg negative, cSN concentrated supernatant, BM bone marrow, HD healthy donor. Represented data has been validated with at least 2 independent experiments. Figure 3a, f and g created with BioRender.com, and released under a Creative Commons Attribution-NonCommercial-NoDerivs 4.0 International license. Source data are provided as a Source Data file.
Fig. 4
Fig. 4. CAR.BiCE-transduced T-cells induce GPC2 CAR-mediated cytotoxicity and secrete GD2 BiCE to activate bystander innate immunity in vitro.
a (left) Cell surface expression of GPC2 CAR on primary human T-cells transduced with single CAR and bicistronic vectors at the end of T-cell expansion. (Right) Percent of CAR-positive cells for each vector (n = 4 donors for CAR.BiCE; n = 3 donors for single CARs). Means and SDs are shown. b Flow cytometry histograms showing GPC2 expression in luciferase-tagged tumor cell lines (n = 8 neuroblastoma and n = 1 leukemia as a negative control). Mean cell surface molecules are indicated. c CAR T-cell cytotoxicity assay for 7 neuroblastoma cell lines (ordered from high to low GPC2 expression) and negative control NALM6 (leukemia) cells. The cytotoxicity of a second T-cell donor is shown in Supplementary Fig. 4c. Means and SDs are shown (n = 3 technical replicates). d Correlation between GPC2.CAR and GPC2.CAR-GD2.BiCE T-cell cytotoxicity (measured as AUC of all tested E:T ratios; AUC5:1-1:5) vs. GPC2 expression on neuroblastoma cell lines. Spearman correlation (two-tailed). e IFN-γ release in culture supernatants of killing assays described in c. Means and SDs are shown (n = 3 technical replicates). f GD2.BiCE secretion in supernatants of human primary T-cells transduced with indicated CARs during T-cell expansion of 3 different donors represented as mean ± SD. g Fold-change GD2.BiCE secretion measured by ELISA of GPC2.CAR-GD2.BiCE and GD2.BiCE T-cells compared to T-cells alone. CAR.BiCE or BiCE T-cells co-incubated with αCD3/αCD28 beads plus cytokines [activated (a)T-cells alone] or GPC2-expressing neuroblastoma cells (n = 6; ordered from high to low GPC2 expression). *P = 0.0003, **P = 0.0001, ***P = 0.0002, ****P = 0.004 and *****P = 0.0004 (Two-way ANOVA plus Dunnett’s multiple comparison test compared to T-cells alone). Means and SDs are shown (n = 3 independent donors). h Graphical diagram showing GPC2.CAR treatment and subsequent re-challenge with GPC2.CAR-GD2.BiCE T-cells. i (upper panel) GPC2 expression in wild-type (WT) and GPC2.CAR-treated NB-SD cells (left) and % change in GPC2 MFI post-CAR treatment (right). Means and SDs are shown (n = 2). (lower panel) GD2.BiCE secretion in WT and GPC2.CAR pre-treated NB-SD cells after re-exposure to GPC2.CAR-GD2.BiCE T-cells. Two different donors of CAR.BiCE T-cells were used and means and SDs of technical replicates are shown (n = 2). aT-cell alone, activated T-cells alone with αCD28/αCD3 beads and IL-7/IL-15 cytokines. j NK-cell-mediated specific lysis of NB-EbC1 cells incubated with different dilutions of CAR.BiCE T-cell cSNs and human primary NK-cells. Dinutuximab was used as positive control. Means and SDs are shown (n = 3 technical replicates). k (upper graph) Graphical scheme of the Transwell assay. (lower graph) GD2.BiCE quantification in supernatants from top and bottom Transwell chambers. Means and SDs are shown (n = 3 technical replicates). l Flow cytometry histograms showing GPC2 and GD2 expression in the tumor cell lines utilized for the Transwell assays in (k). m Quantification of residual tumor cells in top (circles) and bottom chambers (triangles) using indicated CARs in top and NK-cells in the bottom chambers. Left graph shows NB-EbC1 (GPC2+/GD2+) in top and bottom chambers as target cells. Right graph shows SY5Y-GPC2 in the top (GPC2+/GD2low) and SY5Y-GD2/GD3 synthase in the bottom (GPC2low/GD2+) as target cells. Means and SDs are shown (n = 3 technical replicates). MFI mean fluorescence intensity, NS not significant, US unstained, AUC area under the curve, down downregulated. Represented data has been validated with at least 2 independent experiments. Figure 4h and k created with BioRender.com, released under a Creative Commons Attribution-NonCommercial-NoDerivs 4.0 International license. Source data are provided as a Source Data file.
Fig. 5
Fig. 5. CAR.BiCE T-cells locally release GD2.BiCE and enhance accumulation of NK-cells in the tumor bed.
a Schematic in vivo protocol for the biodistribution/pharmacokinetic study of GD2.BiCE compared to the GD2 antibody dinutuximab in mice. b GD2.BiCE levels (pg per mg of total tissue protein) in tumors and mouse normal tissues after CAR.BiCE T-cell infusion (n = 13; except brainstem n = 12). Means and SDs are shown. ****P < 0.0001 (One-way ANOVA plus Dunnett’s multiple comparison test). c GD2 mAb levels (ng per mg of total tissue protein) in the same tissues as b, harvested at day 1 (circles), 2 (squares) and 3 (triangles) after the last dose of dinutuximab (tumor n = 9; spleen=10; lung, heart, cortex n = 11; remaining organs n = 12). Means and SDs are shown. *P = 0.016 and **P = 0.025, #P = 0.0001, ##P < 0.0001 and ###P = 0.0040. (*; tumor vs. normal, #; normal vs. tumor) (One-way ANOVA plus Dunnett’s multiple comparison test). d Quantification of human CD3-positive cells in IHC-stained samples from the biodistribution study in (a). Means and SEMs are shown (n = 3). Circles, squares and triangles indicate 5, 6 and 7 day timepoints, respectively, after GPC2.CAR-GD2.BiCE T-cell infusion in (b and d). e CD3 IHC from tissues from a representative case from biodistribution assay of GPC2.CAR-GD2.BiCE T-cell-treated mice in (a). Scale bars are indicated. f Schematic in vivo protocol for the pharmacodynamics NK92 cell tumor accumulation study. g Serial IVIS imaging of mice bearing neuroblastoma PDXs after intratumoral NK92-CD16a-luc injection and intravenous infusion of GPC2.CAR-GD2.BiCE (n = 5) or GPC2.CAR-CD19.BiCE T-cells (n = 4). h (left) Serial quantification of NK92 cell retention in GPC2.CAR-GD2.BiCE and GPC2.CAR-CD19.BiCE-treated animals from g. Mean, SEM and substrate inhibition model curves are shown. (right) AUC3-96h quantification from previous curves. Mean and SD are shown. *P = 0.015 (Mann–Whitney t-test). PDX patient-derived xenograft, ip intraperitoneal, iv intravenous, it intratumor, AUC area under the curve, luc luciferase, h hours. Source data are provided as a Source Data file.
Fig. 6
Fig. 6. GD2.BiCEs enhance GPC2.CAR efficacy in human neuroblastoma PDX mouse models reconstituted with human innate immune cells.
a Flow cytometry histograms showing GPC2 and GD2 expression (left) and cell surface molecules (right) on neuroblastoma COG-N-421x (1), COG-N-561x (2) and COG-N-603x (3) PDX models. Means and SDs are shown (n = 3). b Schematic representation for the in vivo protocol used for efficacy studies in (ch). (en)PBMCs, CD16a-enriched PBMCs. c COG-N-421x average tumor growth curves (left), tumor volume at day 14 (middle; ****P < 0.0001; One-way ANOVA plus Tukey’s multiple comparison test), and progression-free survival (PFS; right; *P = 0.0003 and **P = 0.0001; log-rank test). N = 7, 6 and 7 for CD19.CAR, GPC2.CAR and GPC2.CAR-GD2.BiCE, respectively, in the presence of (en)PBMCs as effector cells. Means and SEMs are shown. d COG-N-561x average tumor growth curves (left), tumor volume at day 14 (middle; *P = 0.04 and ***P = 0.0002; One-way ANOVA plus Tukey’s multiple comparison test) and PFS (right; *P = 0.0011 and **P = 0.0005; log-rank test). N = 5, 6 and 7 for CD19.CAR, GPC2.CAR and GPC2.CAR-GD2.BiCE, respectively, in the presence of (en)PBMCs as effector cells. Means and SEMs are shown. e COG-N-603x average tumor growth curves (left), tumor volume at day 10 (middle; *P = 0.0156; One-way ANOVA plus Tukey’s multiple comparison test) and PFS (right; *P = 0.029, **P = 0.021 and ***P = 0.0051; log-rank test). N = 5, 6 and 7 for CD19.CAR, GPC2.CAR and GPC2.CAR-GD2.BiCE, respectively, in the presence of enriched PBMCs as effector cells. Means and SEMs are shown. f COG-N-561x average tumor growth curves (left), tumor volume at day 14 (middle; **P = 0.006; One-way ANOVA plus Tukey’s multiple comparison test) and PFS (right; *P = 0.0288; log-rank test). N = 3, 4 and 4 for CD19.CAR, GPC2.CAR and GPC2.CAR-GD2.BiCE, respectively, without the infusion of immune effector cells. Means and SEMs are shown. g COG-N-561x average tumor growth curves (left) and PFS [right; *P < 0.05, **P = 0.0009 and ***P < 0.0001 (GPC2.CAR + GD2 mAb vs. all groups); log-rank test]. N = 6, 5, 6 and 5 for CD19.CAR, GPC2.CAR, GPC2.CAR-GD2.BiCE and GPC2.CAR + GD2 mAb, respectively, with monocytes as immune effector cells. Means and SEMs are shown. h COG-N-561x average tumor growth curves (left) and PFS [right; ***P = 0.0009 and ****P < 0.0001 (GPC2.CAR + GD2 mAb vs. all groups); log-rank test]. N = 6, 6, 6 and 6 for CD19.CAR, GPC2.CAR, GPC2.CAR-GD2.BiCE and GPC2.CAR + GD2 mAb, respectively, with NK-cells as immune effector cells. Means and SEMs are shown. i Tumor volumes comparing treatment groups in (g and h) at day 30 post CAR T-cell infusion. (*P < 0.05; one-way ANOVA plus Tukey’s multiple comparison test; mean ± SEM; n = 4 GPC2.CAR+ monocytes; n = 5 all other groups). j Brain histology (H&E) and T-cell infiltration (CD3 IHC) of the brains of mice bearing subcutaneous COG-N-561x PDX models treated with systemic GPC2.CAR-GD2.BiCE T-cells and either NK-cells (top) or monocytes (bottom) as effector cells. Scale bars are indicated. Brainstem regions are shown in higher magnification. Representative image of one independent mouse per group. US unstained, HI high, MO moderate, iv intravenous, ip intraperitoneal. Source data are provided as a Source Data file.

References

    1. June, C. H. & Sadelain, M. Chimeric antigen receptor therapy. N. Engl. J. Med379, 64–73 (2018). - PMC - PubMed
    1. Maude, S. L. et al. Tisagenlecleucel in children and young adults with b-cell lymphoblastic leukemia. N. Engl. J. Med378, 439–448 (2018). - PMC - PubMed
    1. Hou, A. J., Chen, L. C. & Chen, Y. Y. Navigating CAR-T cells through the solid-tumour microenvironment. Nat. Rev. Drug Discov.20, 531–550 (2021). - PubMed
    1. Majzner, R. G. et al. Tuning the antigen density requirement for CAR T-cell activity. Cancer Discov.10, 702–723 (2020). - PMC - PubMed
    1. Hirabayashi, K. et al. Dual targeting car-t cells with optimal costimulation and metabolic fitness enhance antitumor activity and prevent escape in solid tumors. Nat. Cancer2, 904–918 (2021). - PMC - PubMed

MeSH terms

LinkOut - more resources