. 2024 Aug 20;15(1):7123.
doi: 10.1038/s41467-024-51371-0.

High-resolution epidemiological landscape from ~290,000 SARS-CoV-2 genomes from Denmark

Collaborators, Affiliations

High-resolution epidemiological landscape from ~290,000 SARS-CoV-2 genomes from Denmark

Mark P Khurana et al. Nat Commun. .

Abstract

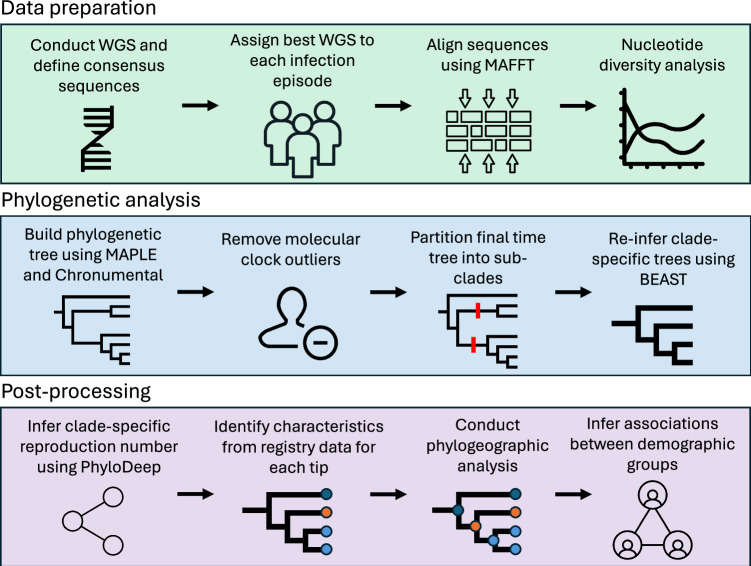
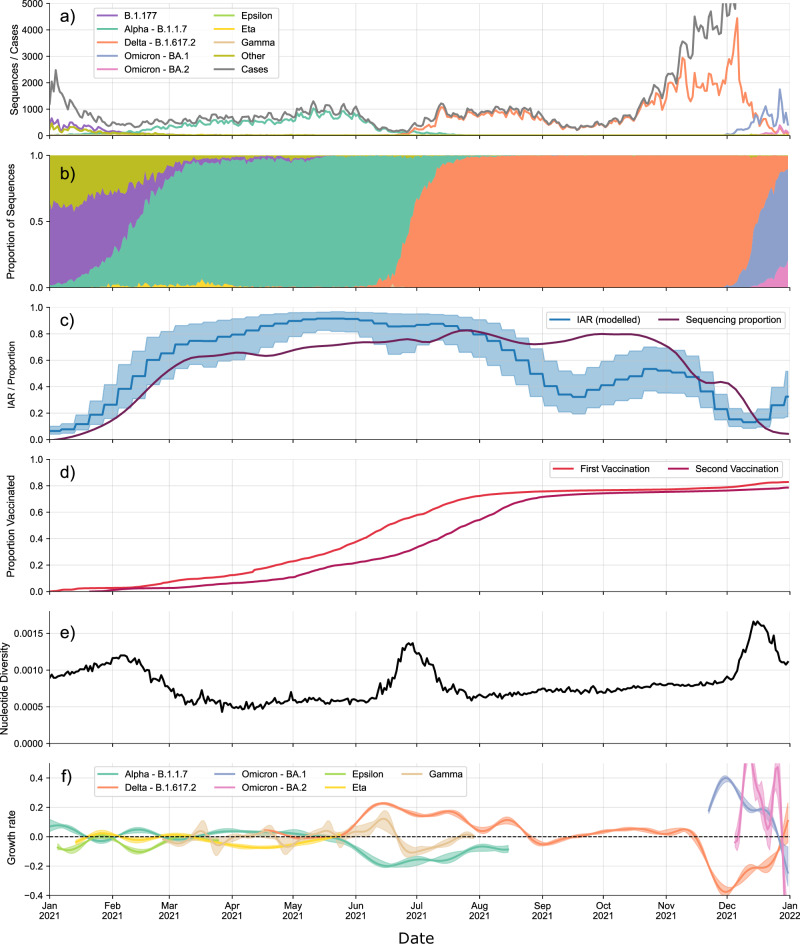
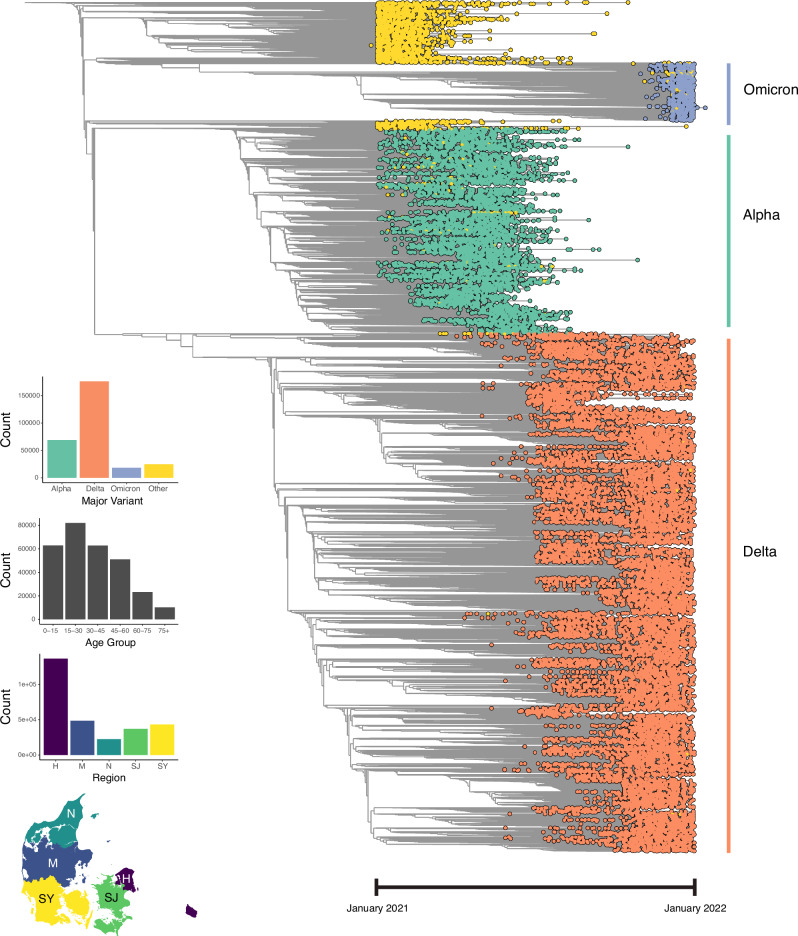
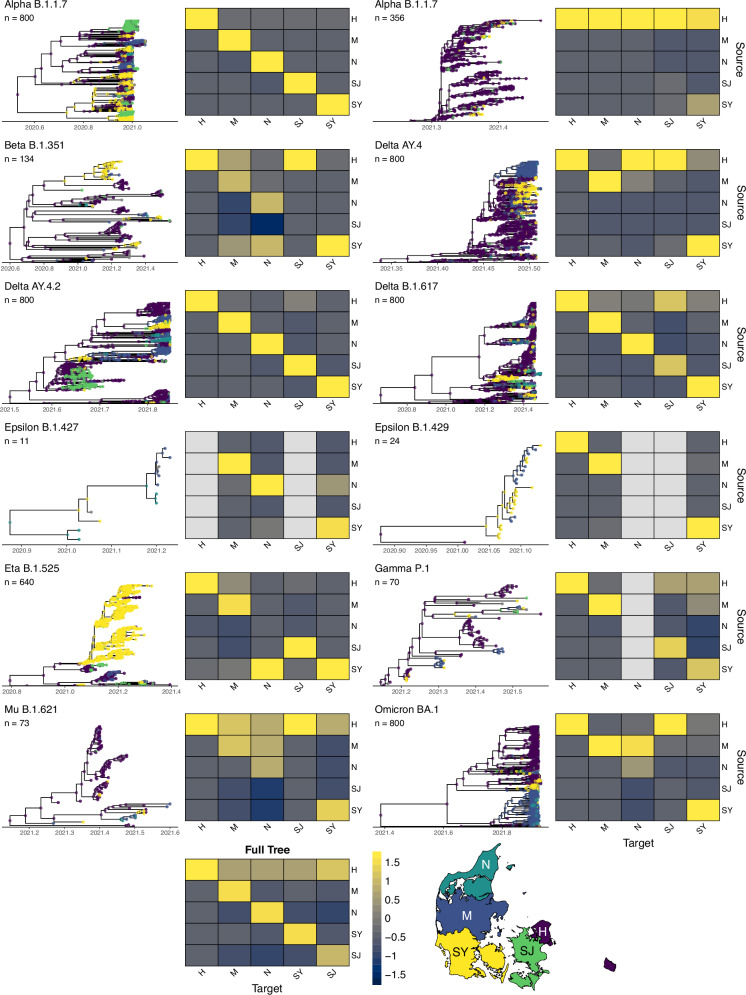
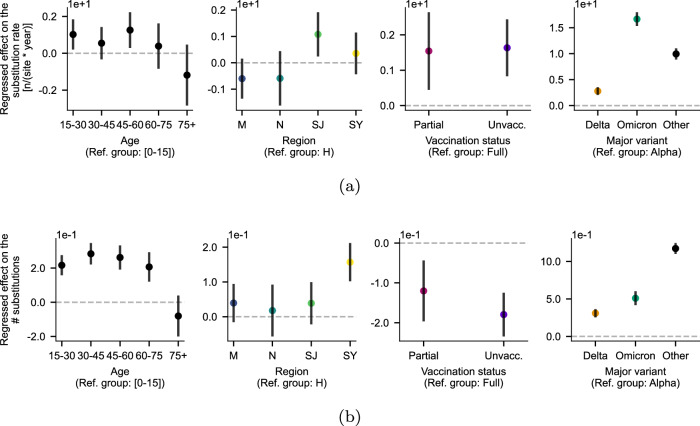
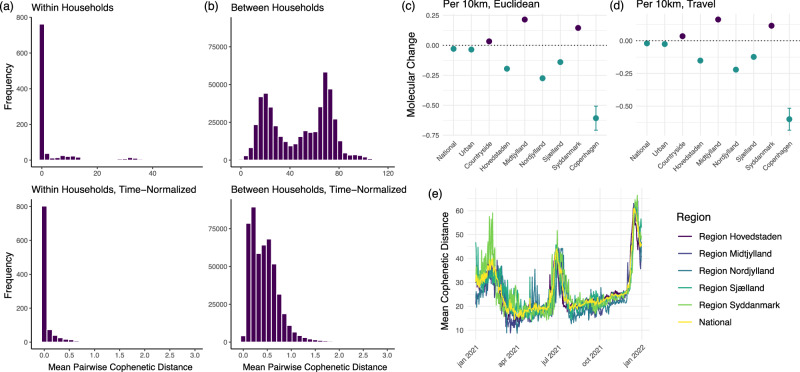
Vast amounts of pathogen genomic, demographic and spatial data are transforming our understanding of SARS-CoV-2 emergence and spread. We examined the drivers of molecular evolution and spread of 291,791 SARS-CoV-2 genomes from Denmark in 2021. With a sequencing rate consistently exceeding 60%, and up to 80% of PCR-positive samples between March and November, the viral genome set is broadly whole-epidemic representative. We identify a consistent rise in viral diversity over time, with notable spikes upon the importation of novel variants (e.g., Delta and Omicron). By linking genomic data with rich individual-level demographic data from national registers, we find that individuals aged < 15 and > 75 years had a lower contribution to molecular change (i.e., branch lengths) compared to other age groups, but similar molecular evolutionary rates, suggesting a lower likelihood of introducing novel variants. Similarly, we find greater molecular change among vaccinated individuals, suggestive of immune evasion. We also observe evidence of transmission in rural areas to follow predictable diffusion processes. Conversely, urban areas are expectedly more complex due to their high mobility, emphasising the role of population structure in driving virus spread. Our analyses highlight the added value of integrating genomic data with detailed demographic and spatial information, particularly in the absence of structured infection surveys.


Conflict of interest statement

The authors declare no competing interests.

Figures

Fig. 1
Fig. 1. Workflow used for the analysis of the full SARS-CoV-2 dataset, composed of three main stages: data preparation, phylogenetic analysis and post-processing.
Data preparation included sequencing, identifying consensus sequences, aligning sequences to the reference sequence, masking sites and analysing nucleotide diversity. Phylogenetic analysis included building a preliminary phylogenetic tree, removing molecular clock outliers, partitioning the tree into sub-clades and re-inferring trees using a Bayesian approach for each sub-clade. Post-processing included inferring the effective reproduction number Re value for each clade, linking tips to registries and conducting phylogeographic analysis.
Fig. 2
Fig. 2. Population-level trends in the epidemiological and sequencing data.
a Number of sequences collected each day by date of testing, separated by lineage, together with the number of confirmed cases published each day by Statens Serum Institut (SSI). b Proportion of sequences collected each day belonging to each major variant. c Infection Ascertainment Rate (IAR) obtained via back-calculation from hospitalisation and mortality data and the proportion of PCR-positive tests taken each day for which we have a WGS. Error bands denote 95% confidence interval. d Proportion of the Danish population that have received a first and second vaccine dose over time. e Nucleotide Diversity calculated for all sequences for each day. f Daily relative growth rate calculated for each major lineage. Error bands denote 98% confidence interval.
Fig. 3
Fig. 3. Full-sample phylogenetic time tree (n = 291,791), visualised with Taxonium.
Tip colours represent major variant assignments using pangolin, with yellow tips representing 'others'. Bar plots depict tip distributions across major variants, age groups, and Danish regions. The map delineates the boundaries of Denmark’s five main regions: H (Hovedstaden), M (Midtjylland), N (Nordjylland), SJ (Sjælland) and SY (Syddanmark). In the first quarter of 2021, the population (in millions) in each region according to Statistics Denmark (https://statbank.dk) was: 1.86 (H), 1.33 (M), 0.59 (N), 0.84 (SJ), and 1.22 (SY).
Fig. 4
Fig. 4. Clades (n = 12) with tips and nodes coloured by region.
The selected clades are a subset of those shown in Table 1, with several unique clades of the same variant identified during the partitioning of the full tree. Nodes are coloured by their most likely value based on results from ancestral state reconstruction. Heat maps denote the number of directed transitions between regions, z-scored by column such that each column sum = 0. A transition is defined as a node from a given region (source) leading to a subsequent node or tip in the same or different region (target). Map outlines the boundaries of Denmark’s five main regions, with colours corresponding to nodes in the trees: H (Hovedstaden), M (Midtjylland), N (Nordjylland), SJ (Sjælland) and SY (Syddanmark).
Fig. 5
Fig. 5. Analysis of substitution rate variability.
Regression coefficients of a model incorporating all four factors to estimate (a) substitution rate using ordinary least squares (OLS) (without interaction between factors) and (b) the number of substitutions using zero-inflated negative binomial regression (without interaction between factors). Groups where the confidence interval does not cross zero (dashed line) indicates significant difference from the reference group. Data are presented as mean ± 95% confidence intervals; n = 289,072 with full metadata for all covariates.
Fig. 6
Fig. 6. Relationship between geographic and genomic distances alongside mean cophenetic distances within and between households, and mean cophenetic distance over time by region.
a Distribution of mean pairwise cophenetic distances between individuals within the same household (n = 1000 households), normalised to time (i.e. distance divided by time in days between individuals testing positive). b Distribution of mean pairwise cophenetic distances between individuals in different households (n = 1000 households), normalised to time. c Molecular change (i.e. number of nucleotide changes) per 10 km increase in Euclidean distance across various geographic models (national, residential zone, regional, city) (National: n = 20,000 individuals; Urban: n = 18,111; Countryside: n = 1817; Hovedstaden: n = 1000; Midtjylland: n = 1000; Nordjylland: n = 1000; Sjælland: n = 1000; Syddanmark: n = 1000; Copenhagen: n = 3416). Error bars denote 95% confidence intervals. d Molecular change per 10 km increase in car travel distance using OpenStreetMap across different geographic models (national, residential zone, regional, city) (National: n = 20,000 individuals; Urban: n = 18,111; Countryside: n = 1817; Hovedstaden: n = 1000; Midtjylland: n = 1000; Nordjylland: n = 1000; Sjælland: n = 1000; Syddanmark: n = 1000; Copenhagen: n = 3416). Error bars denote 95% confidence intervals. e Mean pairwise cophenetic distance over time, stratified by region (n = 10,000 individuals per region, n = 20,000 for the national subset).

References

    1. Grenfell, B. T. et al. Unifying the epidemiological and evolutionary dynamics of pathogens. Science303, 327–332 (2004). 10.1126/science.1090727 - DOI - PubMed
    1. Attwood, S. W., Hill, S. C., Aanensen, D. M., Connor, T. R. & Pybus, O. G. Phylogenetic and phylodynamic approaches to understanding and combating the early SARS-CoV-2 pandemic. Nat. Rev. Genet.23, 547–562 (2022). 10.1038/s41576-022-00483-8 - DOI - PMC - PubMed
    1. Lu, R. et al. Genomic characterisation and epidemiology of 2019 novel coronavirus: implications for virus origins and receptor binding. Lancet395, 565–574 (2020). 10.1016/S0140-6736(20)30251-8 - DOI - PMC - PubMed
    1. Matteson, N. L. et al. Genomic surveillance reveals dynamic shifts in the connectivity of COVID-19 epidemics. Cell186, 5690–5704.e20 (2023). 10.1016/j.cell.2023.11.024 - DOI - PMC - PubMed
    1. Coppée, R. et al. Phylodynamics of SARS-CoV-2 in France, Europe, and the world in 2020. eLife12, e82538 (2023). 10.7554/eLife.82538 - DOI - PMC - PubMed

Supplementary concepts