. 2024 Aug 20;15(1):7132.
doi: 10.1038/s41467-024-51488-2.

Mdm2 requires Sprouty4 to regulate focal adhesion formation and metastasis independent of p53

Affiliations

Mdm2 requires Sprouty4 to regulate focal adhesion formation and metastasis independent of p53

Rafaela Muniz de Queiroz et al. Nat Commun. .

Abstract

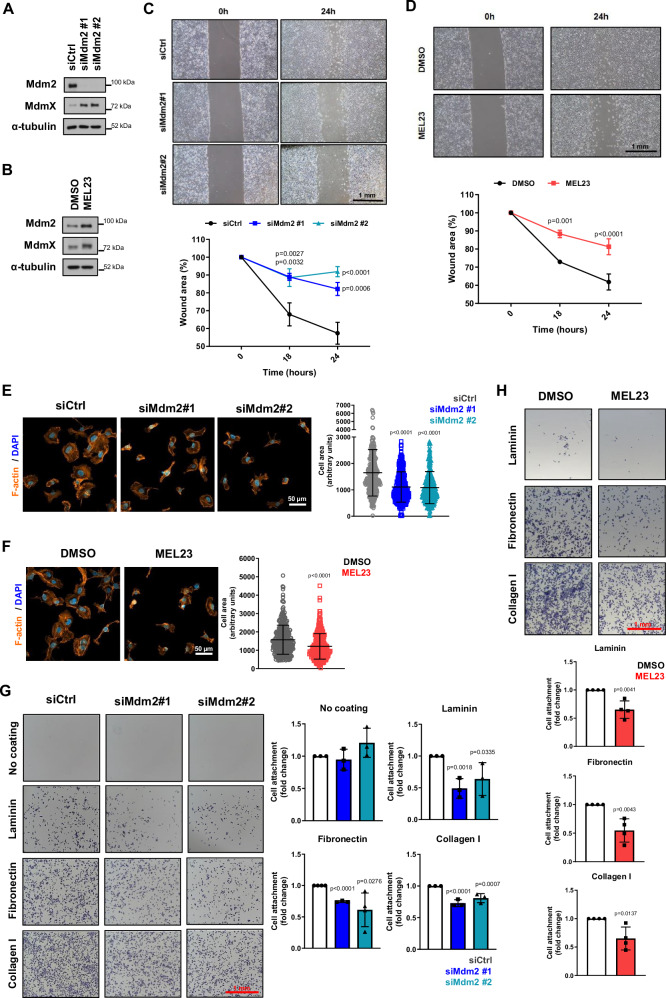
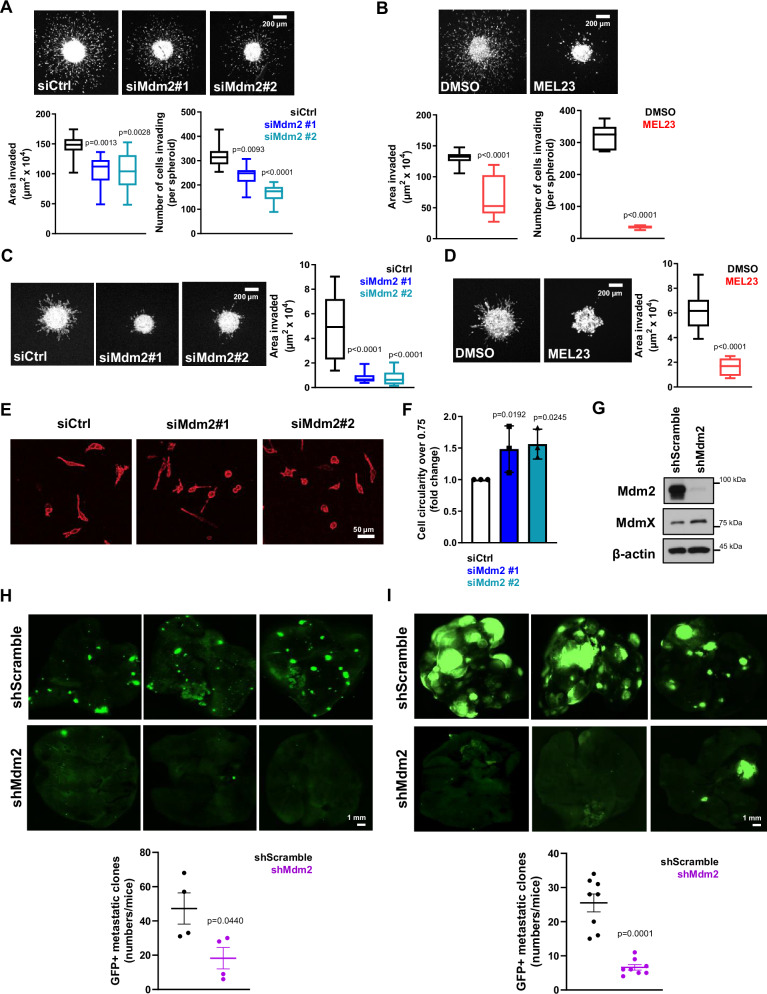
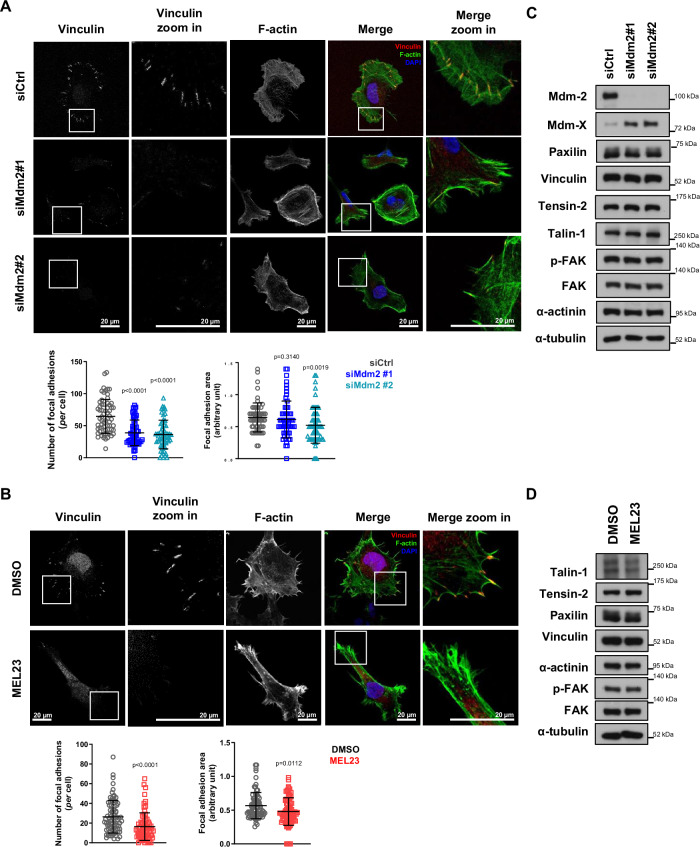
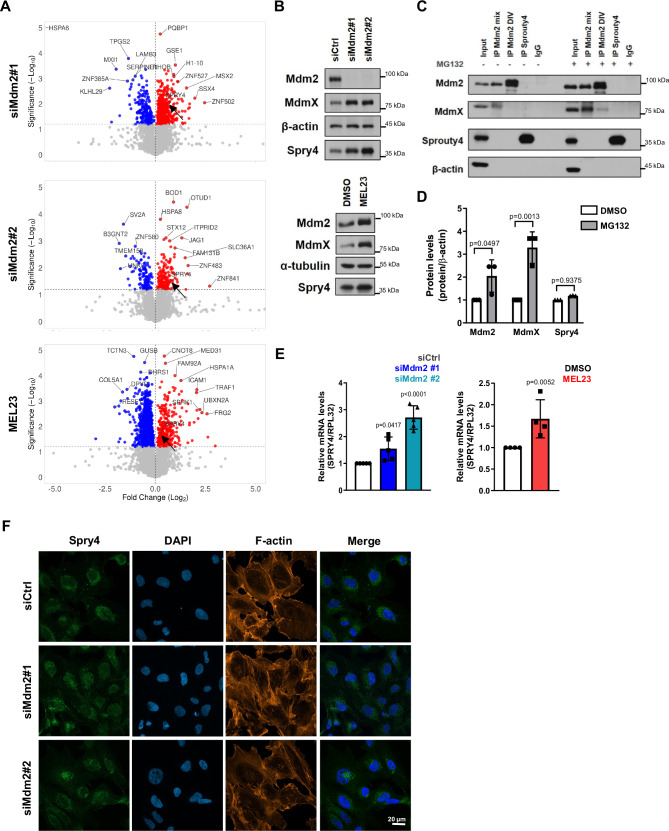
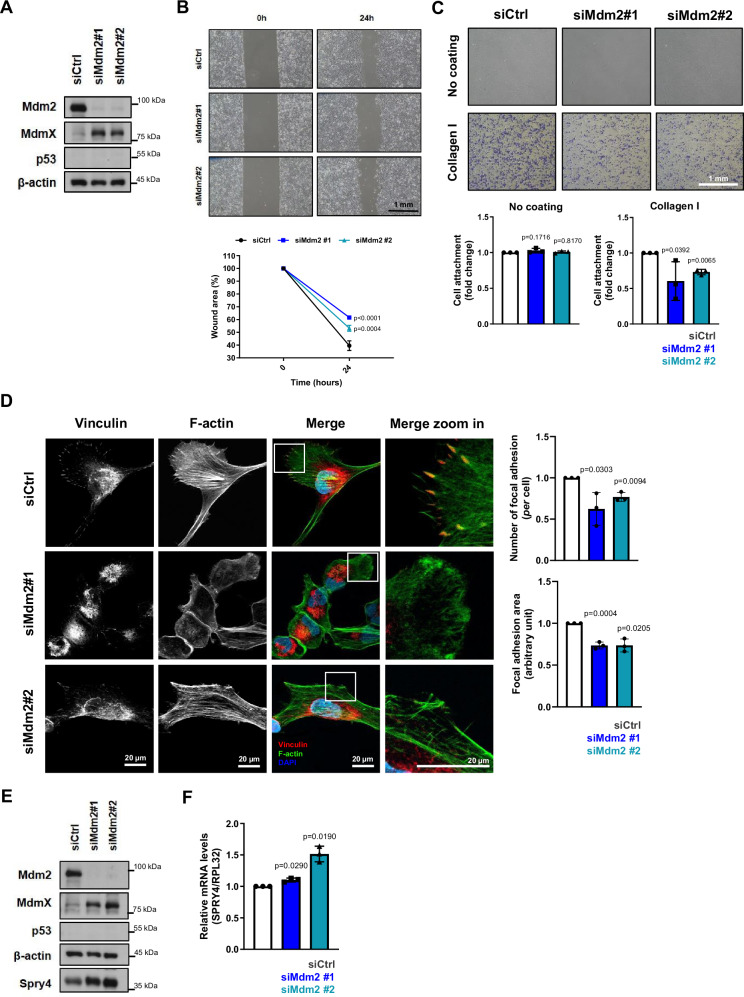
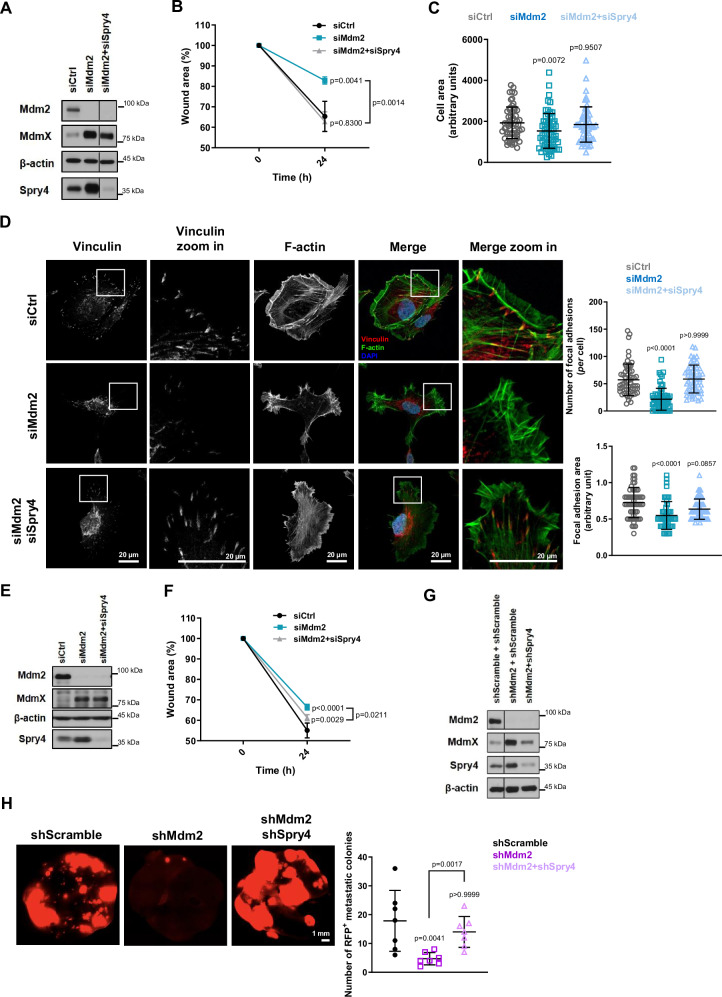
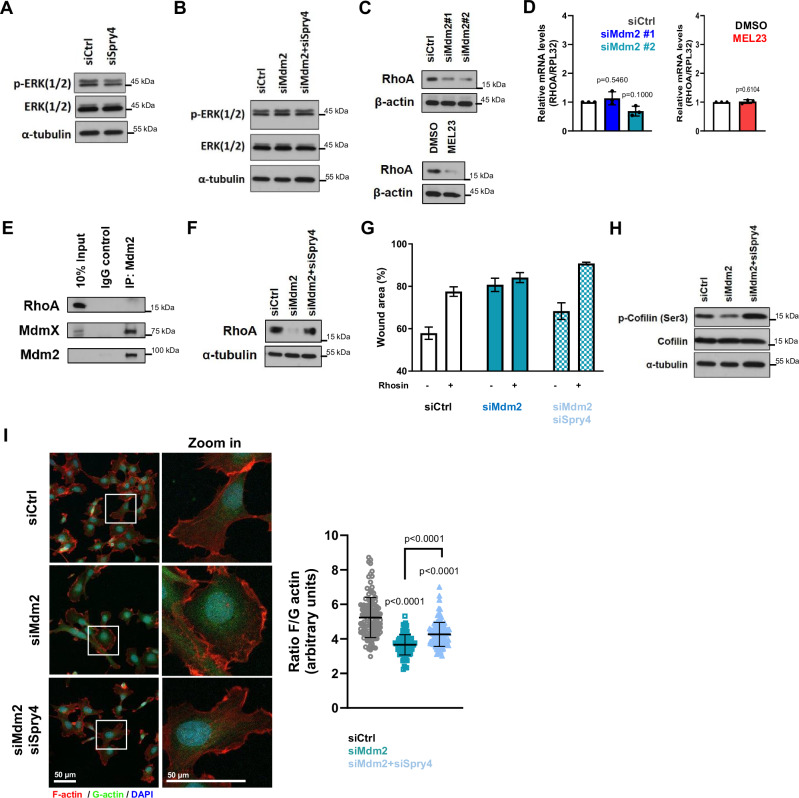
Although the E3 ligase Mdm2 and its homologue and binding partner MdmX are the major regulators of the p53 tumor suppressor protein, it is now evident that Mdm2 and MdmX have multiple functions that do not involve p53. As one example, it is known that Mdm2 can regulate cell migration, although mechanistic insight into this function is still lacking. Here we show in cells lacking p53 expression that knockdown of Mdm2 or MdmX, as well as pharmacological inhibition of the Mdm2/MdmX complex, not only reduces cell migration and invasion, but also impairs cell spreading and focal adhesion formation. In addition, Mdm2 knockdown decreases metastasis in vivo. Interestingly, Mdm2 downregulates the expression of Sprouty4, which is required for the Mdm2 mediated effects on cell migration, focal adhesion formation and metastasis. Further, our findings indicate that Mdm2 dampening of Sprouty4 is a prerequisite for maintaining RhoA levels in the cancer cells that we have studied. Taken together we describe a molecular mechanism whereby the Mdm2/MdmX complex through Sprouty4 regulates cellular processes leading to increase metastatic capability independently of p53.


Conflict of interest statement

The authors declare no competing interests.

Figures

Fig. 1
Fig. 1. Loss of Mdm2 or functional impairment of the Mdm2/MdmX complex decreases migration, impairs cell spreading and cell attachment to ECM in a p53-independent manner.
HT1080 p53KO cells were transfected with siRNAs against Mdm2 and siCtrl or treated with the Mdm2 inhibitor, MEL23. A, B Protein levels of Mdm2 and MdmX after (A) transfection using siRNAs (n = 6 samples) as indicated or (B) treatment with MEL23 (7 µM) for 24 h (n = 4 samples). α-tubulin was used as a loading control. C, D Cell migration assay. Representative images (top) and quantification (bottom) of wound scratch migration assay with cells (C) silenced for Mdm2 or (D) treated with MEL23 for 24 h, n = 3 groups. E, F Representative images of the morphology of cells attached to collagen-coated coverslips and quantification of cell area after (E) silencing of Mdm2 or (F) treatment with MEL23 for 24 h, n = 3 groups. Cells stained for actin (orange) and DNA via DAPI (blue). The cell area was quantified and plotted. Graphs show all three independent experimental replicates combined, for each independent experimental replicate a minimum of 100 cells were quantified summing a total of at least 300 cells/condition. G, H Quantification and representative micrographs showing attachment to different ECM components of cells (G) silenced for Mdm2, n = 3 samples or (H) treated with MEL23 for 24 h, n = 4 samples. The graphs shown represent the mean ± SD of independent experimental replicates. More details about the statistical tests used can be found in the Source Data file.
Fig. 2
Fig. 2. Loss of Mdm2 function decreases individual and collective invasion in 3D and metastatic burden in vivo.
A, B Tumor spheroid invasion in collagen matrix after (A) transfection of HT1080 p53KO cells with siRNAs against Mdm2 or (B) treatment with MEL23. Representative images above and quantification below of the area invaded and the number of cells invading 24 h after implantation. C, D Tumor spheroid invasion in the collagen-BME matrix after (C) transfection of HT1080 p53KO cells with siRNAs against Mdm2 or (D) treatment with MEL23. Representative images and quantification of the area invaded 24 h after implantation. Graphs show three pooled independent experimental replicates, the total number of spheroids in each condition is: siCtrl = 10, siMdm2#1 = 15, siMdm2#2 = 12 in panel (A); DMSO = 25, MEL23 = 24 in panel (B); siCtrl = 12, siMdm2#1 = 14, siMdm2#2 = 15 in panel (C), and DMSO = 8, MEL23 = 9 in panel (D). E Representative images of cell morphology of HT1080 p53KO cells transfected with siRNAs against Mdm2 or siCtrl in collagen matrix, 6 h after implantation. F Quantification of more circular cells (circularity of 0.75 or higher) in each condition shown in (E), n = 3 groups. The graph represents the average fold change of more circular morphology in Mdm2 silenced cells compared to control in three independent experimental replicates. More details about the quantification can be found in the method’s session. GI HT1080 p53KO cells stably expressing shRNA scramble (shScramble) or a pool of Mdm2 shRNAs (shMdm2) were used to analyze metastatic burden using mouse models. G Protein levels of Mdm2 and MdmX in HT1080 shScramble and shMdm2 stable cell lines. β-actin was used as a loading control. H, I Representative images above and quantification below of metastatic foci in the lungs after implantation of shScramble or shMdm2 cells using (H) orthotropic model, n = 4 mice/group or (I) tail-vein model, n = 8 mice/group. In all box and whisker plots the boxes extend from 25 to 75 percentiles and whiskers show min and max values, The line in the center of each box represents the median. Graphs shown in panels (F, H, I) represent the mean ± SD of independent experimental replicates. More details about the statistical tests used can be found in the Source Data file.
Fig. 3
Fig. 3. Loss of Mdm2 or functional impairment of Mdm2/MdmX complex decreases FA formation in a p53-independent manner.
HT1080 p53KO cells were (A) silenced for Mdm2 using siRNAs or (B) treated with 7 µM MEL23 for 24 h. A, B Immunofluorescence showing FA foci by vinculin staining (red), cell surface was outlined by phalloidin staining (green), and nuclei (blue) detected by DAPI staining of DNA. Representative images are shown above, with quantification of FA parameters below. The graphs shown represent the mean ± SD of three independent experimental replicates. For each independent experimental replicate all parameters were quantified in at least 20 events/condition for a total of at least 60 events/condition. C, D Protein levels of FA-related proteins in HT1080 p53KO cells (C) silenced for Mdm2 or (D) treated with MEL23 for 24 h. α-tubulin was used as a loading control, n = 3 samples. More details about the statistical tests used can be found in the Source Data file.
Fig. 4
Fig. 4. The Mdm2/MdmX complex regulates the expression and subcellular localization of Sprouty4.
HT1080 p53KO cells were transfected with siRNAs against Mdm2 or siCtrl for 24 h; or treated with 7 µM MEL23 or DMSO (vehicle) for 24 h. A Volcano plots show all proteins identified by mass spectrometry. Colored dots represent significantly differentially expressed proteins that were downregulated (blue dots) and upregulated (red dots) in each condition shown at the left of the plot. Gray dots represent non-significant changes. MEL23-treated cells were compared to DMSO-treated cells. Cells transfected with siMdm2#1 or #2 were compared to siCtrl-transfected cells, n = 3 samples. Black arrows point to the location of Spry4 in each Volcano plot. B Spry4 expression in HT1080 p53KO cells in response to Mdm2 knockdown or treatment with MEL23 for 24 h by immunoblotting. β-actin and α-tubulin were used as loading control for immunoblot, n = 6 samples. C Co-immunoprecipitation of Mdm2 and Spry4 in the presence or absence of MG132. β-actin was used as a loading control. Mdm2 was pulled down by using either a mix of antibodies against Mdm2 (4B11, 3G5, and 2A9) that recognize different domains within the protein, this condition was called “mix”, or by using a single monoclonal antibody D1V2Z, this condition was called “DIV”, n = 3 samples. D Quantification of Spry4, Mdm2, and MdmX protein levels after treatment with MG132 (or vehicle, DMSO) for 4 h, n = 3 samples. E Spry4 mRNA levels in response to Mdm2 knockdown (n = 5 samples) or treatment with MEL23 for 24 h (n = 4 samples). RPL32 was used as housekeeping. F Localization of Spry4 in HT1080 p53KO cells in response to Mdm2 knockdown. Immunofluorescence showed Spry4 staining (green), the cell surface was outlined by phalloidin staining (orange), and nuclei (blue) were detected by DAPI staining of DNA, n = 3 groups. Graphs shown in (D, E) represent the mean ± SD of independent experimental replicates. More details about the statistical tests used can be found in the Source Data file.
Fig. 5
Fig. 5. Mdm2 knockdown decreases cell migration, attachment to the ECM, and FA formation while induces expression of Sprouty4 in naturally p53 null lung adenocarcinoma cell line.
H1299 cells were transfected with siRNAs against Mdm2 and siCtrl. A Protein levels of Mdm2, MdmX, and p53 after. β-actin was used as a loading control, n = 4 samples. B Cell migration assay. Representative images (top) and quantification (bottom) of wound scratch migration assay, n = 3 groups. C Quantification and representative micrographs showing attachment to ECM component, collagen I, n = 3 samples. D Immunofluorescence showing FA foci by vinculin staining (red), cell surface was outlined by phalloidin staining (green), and nuclei (blue) detected by DAPI staining of DNA, n = 3 groups. Representative images are shown on the left, and the quantification of FA parameters is shown on the right. E Protein levels of Spry4 as well as Mdm2, MdmX, and p53 after Mdm2 silencing using siRNAs. β-actin was used as a loading control, n = 4 samples. F mRNA levels of Spry4 after Mdm2 silencing using siRNAs, n = 3 samples. RPL32 was used as housekeeping. Graphs shown represent the mean ± SD of independent experimental replicates. More details about the statistical tests used can be found in the Source Data file.
Fig. 6
Fig. 6. Knockdown of Sprouty4 rescues changes in cell migration, FA formation, and metastasis resulting from loss of Mdm2.
AD HT1080 p53KO cells were transfected with siRNA against Mdm2 alone or both siRNA against Mdm2 and a pool of Spry4 siRNAs. A Protein levels of Mdm2, MdmX, and Spry4 after transfection with indicated siRNAs, n = 3 samples. β-actin was used as a loading control. B Quantification of wound scratch migration assay in cells treated with the indicated siRNAs as in Fig. 1C, n = 3 samples. C Quantification of cell area after attachment to collagen-coated coverslips as in Fig. 1E, n = 3 samples. D Immunofluorescence showing FA foci by vinculin staining (red), cell surface was outlined by phalloidin staining (green), and nuclei (blue) as detected by DAPI staining, n = 3 groups. Representative images are shown on the left, and the quantification of FA parameters is shown on the right. In (C, D) the graphs shown represent mean ± SD of independent experimental replicates and in each replicate all parameters were quantified in at least 20 events/condition for total of at least 60 events/condition. E, F H1299 cells were transfected with siRNA against Mdm2 alone or both siRNA against Mdm2 and a pool of Spry4 siRNAs. E Protein levels of Mdm2, MdmX, and Spry4 after transfection with indicated siRNAs. β-actin was used as a loading control, n = 3 samples. F Quantification of wound scratch migration assay comparing migration into wound scratches in cells treated with the indicated siRNAs as in Fig. 1C, n = 3 samples. G, H HT1080 p53KO cell lines were established stably expressing a pool of shRNAs against Mdm2 alone or Mdm2 and Spry4 together. G Protein levels of Mdm2, MdmX, and Spry4 in stable cell lines. β-actin was used as a loading control, n = 3 samples. H Analysis of metastatic burden in vivo using tail-vein injection model as in Fig. 2H, I. Representative images above and quantification below of metastatic foci in the lungs after 8 weeks of injection, n = 7 mice/group. The graphs shown represent the mean ± SD of independent experimental replicates. More details about the statistical tests used can be found in the Source Data file.
Fig. 7
Fig. 7. Sprouty4 acts through a non-canonical pathway, by regulating RhoA levels, to induce the effects of Mdm2 knockdown in cell migration.
A, B Effect of Spry4 modulation in the phosphorylation of ERKs in HT1080 p53KO cells. Protein levels of phospho-ERK and total ERK levels (A) after Spry4 silencing using a pool of siRNAs and (B) in response to silencing of Mdm2 alone or Mdm2 and Spry4 together. C, D RhoA modulation in HT1080 p53KO cells transfected with siRNAs against Mdm2 or treated with MEL23. C Protein levels and (D) mRNA levels of RhoA after transfection with indicated siRNAs (n = 3 samples) or treatment with MEL23 (n = 3 samples) for 24 h. β-actin was used as a loading control for immunoblots. RPL32 was used as a housekeeping control for qPCR. E Immunoprecipitation of Mdm2 in the presence of MG132. Lysates were probed for the presence of RhoA, and MdmX was used as a positive control. Mdm2 was pulled down by using a mix of antibodies against Mdm2 that recognize different domains within the protein. F RhoA protein levels in HT1080 p53KO cells transfected with siRNAs against Mdm2 alone or against Mdm2 and Spry4. α-tubulin was used as a loading control. G Quantification of wound scratch migration assay comparing cells transfected with siRNAs against Mdm2 alone or against Mdm2 and a pool of Spry4 siRNAs in the presence or absence of the RhoA inhibitor Rhosin (50 µM) for 24 h. The graph represents mean ± SD, n = 3 technical replicates. The graph for the other two independent experimental replicates can be found in the supplementary material. H Immunoblot of levels of total and phospho-cofilin-1(Ser3) in HT1080 p53KO cells silenced for Mdm2 alone or with double KD of Mdm2 and Spry4. I Immunofluorescence showing F- (red) and G-actin (green) staining. Nuclei (blue) as detected by DAPI staining, n = 3 groups. Representative images (left) and quantification of F/G ratio (right). Graph represents mean ± SD of independent experimental replicates, in each replicate the F/G-actin ratio was quantified in at least 30 events/condition for a total of at least 90 events/condition. More details about the statistical tests used can be found in the Source Data file.

References

    1. Fakharzadeh, S. S., Trusko, S. P. & George, D. L. Tumorigenic potential associated with enhanced expression of a gene that is amplified in a mouse tumor cell line. EMBO J.10, 1565–1569 (1991). 10.1002/j.1460-2075.1991.tb07676.x - DOI - PMC - PubMed
    1. Karni-Schmidt, O., Lokshin, M. & Prives, C. The roles of MDM2 and MDMX in cancer. Annu. Rev. Pathol.11, 617–644 (2016). 10.1146/annurev-pathol-012414-040349 - DOI - PMC - PubMed
    1. Iwakuma, T. & Lozano, G. MDM2, an introduction. Mol. Cancer Res.1, 993–1000 (2003). - PubMed
    1. Manfredi, J. J. The Mdm2-p53 relationship evolves: Mdm2 swings both ways as an oncogene and a tumor suppressor. Genes Dev.24, 1580–1589 (2010). 10.1101/gad.1941710 - DOI - PMC - PubMed
    1. Tackmann, N. R. & Zhang, Y. Mouse modelling of the MDM2/MDMX-p53 signalling axis. J. Mol. Cell Biol.9, 34–44 (2017). 10.1093/jmcb/mjx006 - DOI - PMC - PubMed

MeSH terms

LinkOut - more resources