. 2024 Aug 21;15(1):7144.
doi: 10.1038/s41467-024-51542-z.

FOXO-regulated OSER1 reduces oxidative stress and extends lifespan in multiple species

Affiliations

FOXO-regulated OSER1 reduces oxidative stress and extends lifespan in multiple species

Jiangbo Song et al. Nat Commun. .

Abstract

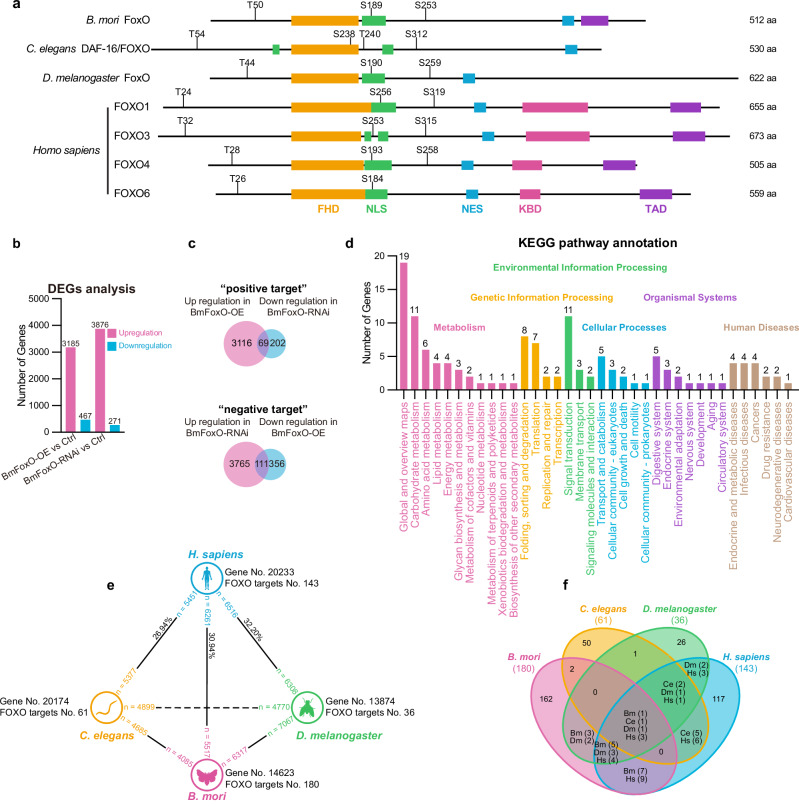
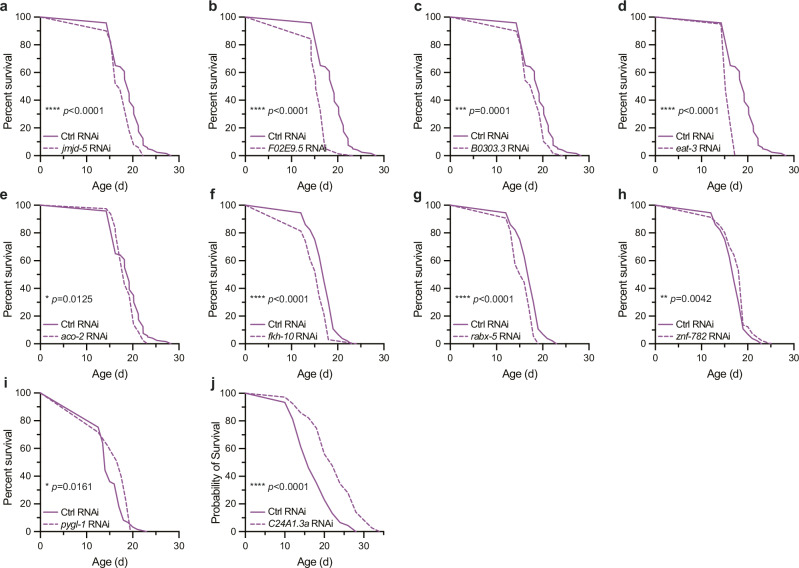
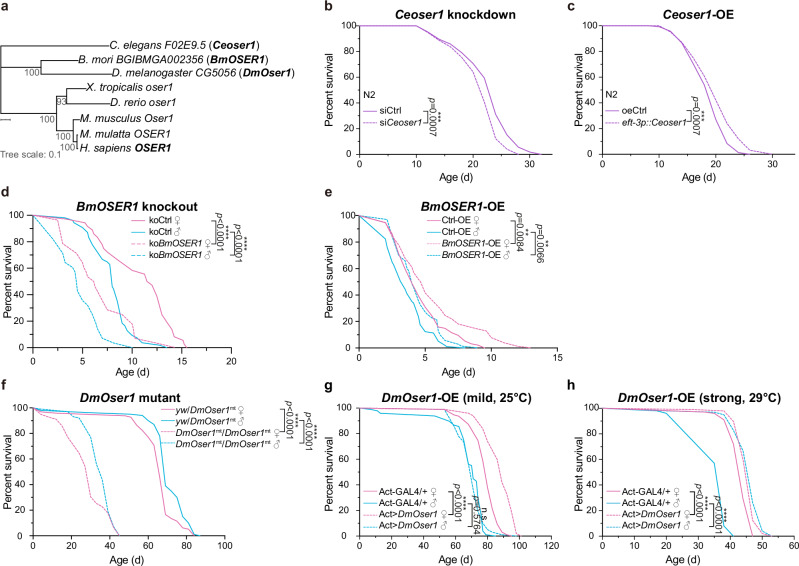
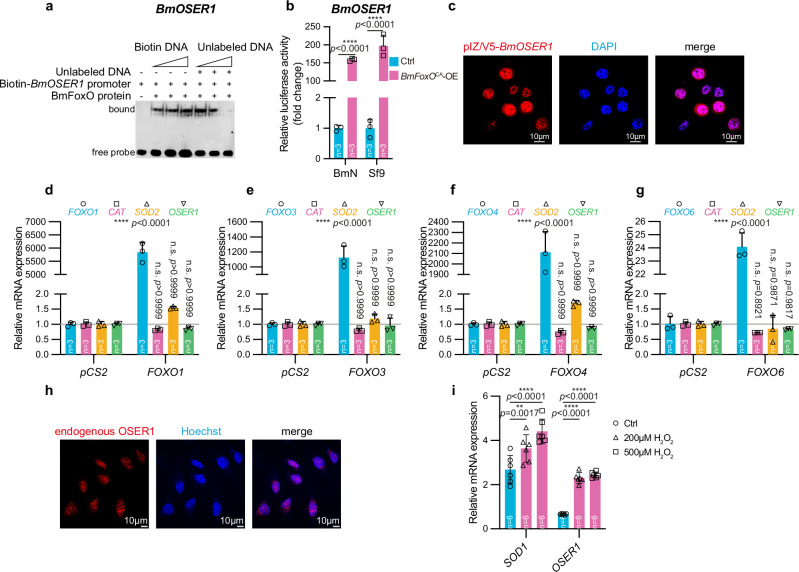
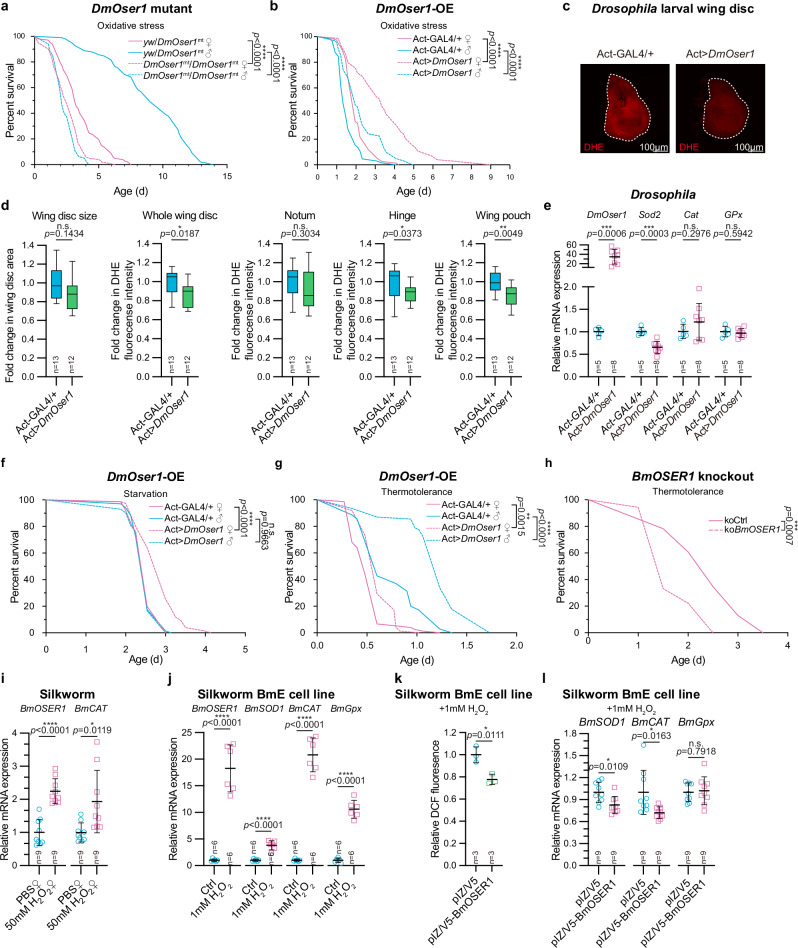
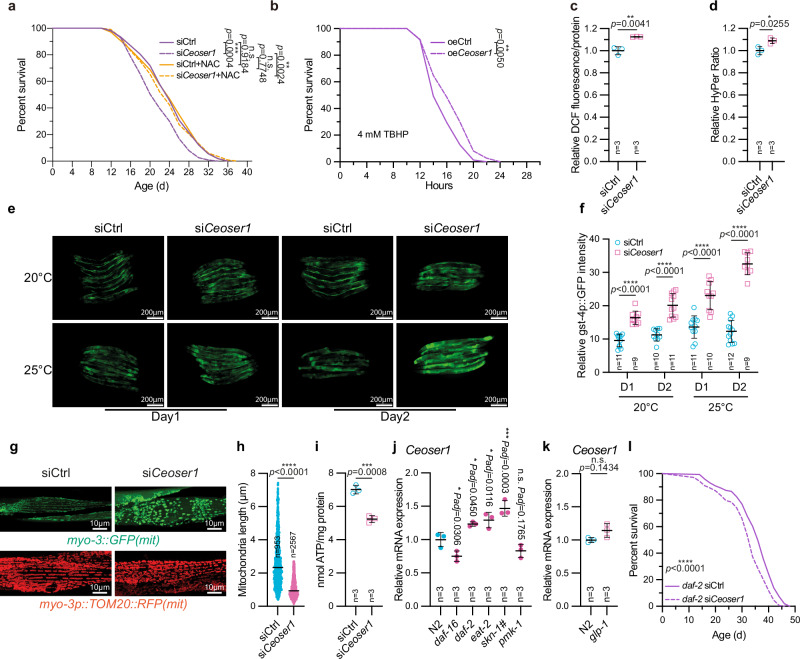
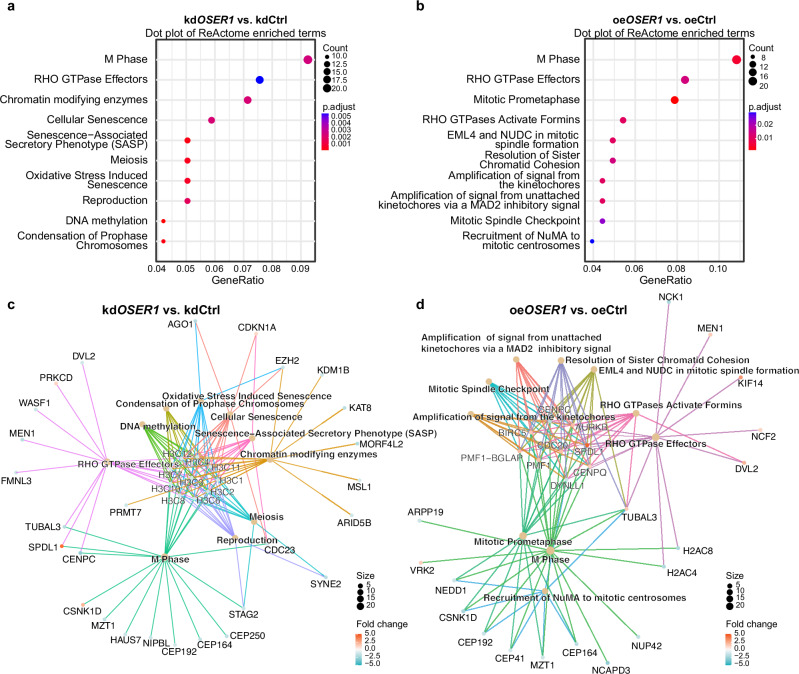
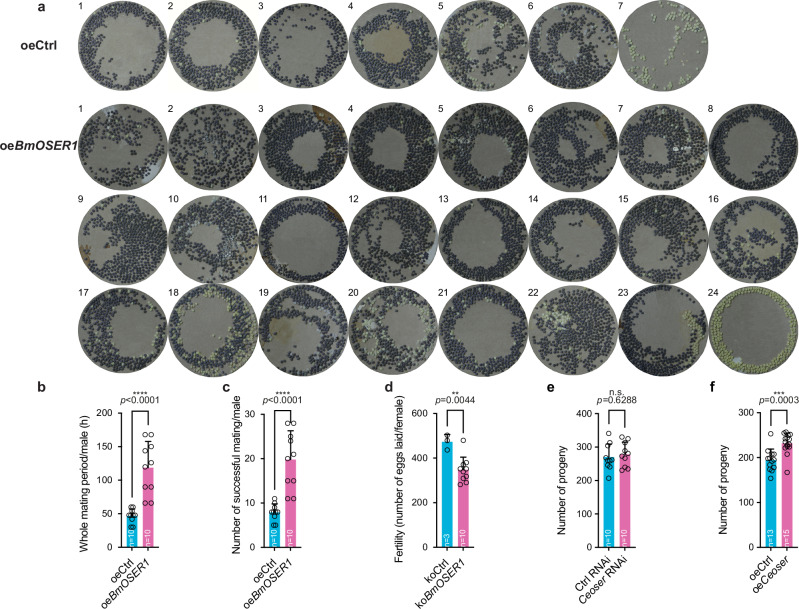
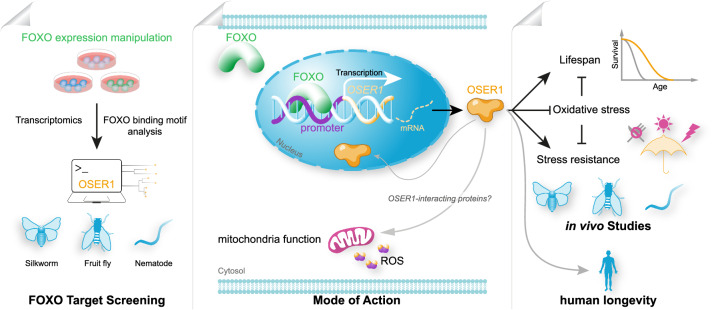
FOXO transcription factors modulate aging-related pathways and influence longevity in multiple species, but the transcriptional targets that mediate these effects remain largely unknown. Here, we identify an evolutionarily conserved FOXO target gene, Oxidative stress-responsive serine-rich protein 1 (OSER1), whose overexpression extends lifespan in silkworms, nematodes, and flies, while its depletion correspondingly shortens lifespan. In flies, overexpression of OSER1 increases resistance to oxidative stress, starvation, and heat shock, while OSER1-depleted flies are more vulnerable to these stressors. In silkworms, hydrogen peroxide both induces and is scavenged by OSER1 in vitro and in vivo. Knockdown of OSER1 in Caenorhabditis elegans leads to increased ROS production and shorter lifespan, mitochondrial fragmentation, decreased ATP production, and altered transcription of mitochondrial genes. Human proteomic analysis suggests that OSER1 plays roles in oxidative stress response, cellular senescence, and reproduction, which is consistent with the data and suggests that OSER1 could play a role in fertility in silkworms and nematodes. Human studies demonstrate that polymorphic variants in OSER1 are associated with human longevity. In summary, OSER1 is an evolutionarily conserved FOXO-regulated protein that improves resistance to oxidative stress, maintains mitochondrial functional integrity, and increases lifespan in multiple species. Additional studies will clarify the role of OSER1 as a critical effector of healthy aging.


Conflict of interest statement

The authors declare no competing interests.

Figures

Fig. 1
Fig. 1. Identification of transcriptional targets of BmFoxO.
a The secondary structure of FoxO proteins among B. mori, C. elegans, D. melanogaster, and Homo sapiens. Members in the FoxO family share a highly conserved forkhead DNA-binding domain (FHD), one or two nuclear localization signal(s) (NLS), a nuclear export signal (NES), and a transactivation domain (TAD). The KIX-binding domain (KBD) is only found in human FOXOs in this comparison. The presence of the FHD, KBD, and TAD was predicted using the NCBI Conserved Domains Database (NCBI CDD). The identification of NLS and NES was carried out with NLStradamus and LocNES, respectively. C. elegans and D. melanogaster FoxO do not have a functional TAD. The positions of Akt phosphorylation sites indicated were analyzed using NetPhos 3.1 Server. b BmN-SWU1 cells were selected for stable overexpression of BmFoxOCA (constitutively active) or siRNA targeting BmFoxO. Total RNA was isolated for transcriptomic analysis, and differentially-expressed genes (DEGs) were identified. c Genes with up-regulated mRNA levels in BmFoxO overexpression and down-regulated in the BmFoxO knockdown conditions were denoted as “positive targets”; the opposite pattern was designated as “negative targets”. d KEGG analyses of DEGs showing the DEGs involvement in metabolism, genetic/environmental information processing, human diseases, organismal systems, and cellular processes. e Bioinformatic analysis of orthologous genes among silkworm, nematode, Drosophila, and humans. f Venn diagram of FOXO transcriptional direct targets in the indicated species. All data are available in Supplementary Data 1, 2, and 3.
Fig. 2
Fig. 2. The survival analysis of 10 siRNA-mediated gene knockdowns in C. elegans.
ag C. elegans knockdowns that show shortened lifespan (jmjd-5, n = 50; F02E9.5, n = 76; B0303.3, n = 59; eat-3, n = 119; aco-2, n = 79; fkh-10, n = 97; rabx-5, n = 54). hj C. elegans knockdowns that show extended lifespan (znf-782, n = 81; pygl-1, n = 53; C24A1.3a, n = 107). Controls for i, n = 61, for j, n = 107. The knockdowns of a-e were performed simultaneously to compare better the lifespan changes, so the same control (n = 120) was used and presented in the figure. Panels fh also share the same controls (n = 130). Survival curves were plotted and analyzed by Log-rank (Mantel-Cox) test using GraphPad Prism 9. *p < 0.05, **p < 0.01, ***p < 0.001, ****p < 0.0001. Lifespan experiments were performed at least three times independently with similar observations. Source data are provided as a Source Data file.
Fig. 3
Fig. 3. The effect of OSER1 overexpression or knockdown on lifespan in nematodes, silkworms, and fruit flies.
a Phylogeny of OSER1 in C. elegans, B. mori, D. melanogaster, Xenopus tropicalis, Danio rerio, Mus musculus, Macaca mulatta, and Homo sapiens. The phylogenetic tree was generated with MEGA version 11.0.11. The scale bar 0.1 represents the number of substitutions per site. The lifespan of nematodes with Ceoser1 knockdown (b: siCtrl, n = 109; siCeoser1, n = 101) or overexpression (c: oeCtrl, n = 143; siCeoser1, n = 101). The lifespan of B. mori with BmOSER1 knockout (d: koCtrl ♀, n = 36; koCtrl ♂, n = 54; koBmOSER1 ♀, n = 28) or overexpression (e: Ctrl-OE ♀, n = 94; Ctrl-OE ♂, n = 97; BmOSER1-OE ♀, n = 77; BmOSER1-OE ♂, n = 70). The lifespan of heterozygotes control (yw/DmOser1) and DmOser1 mutant flies (f: yw/DmOser1 ♀, n = 96; yw/DmOser1mt ♂, n = 100; DmOser1mt/DmOser1mt ♀, n = 79; DmOser1mt/DmOser1mt ♂, n = 100) or flies with mild (25 °C, g) (Act-GAL4/+ ♀, n = 95; Act-GAL4/+ ♂, n = 98; Act>DmOser1 ♀, n = 100; Act>DmOser1 ♂, n = 99) or strong overexpression of DmOser1 (29 °C, h) (Act-GAL4/+ ♀, n = 100; Act-GAL4/+ ♂, n = 100; Act>DmOser1 ♀, n = 97; Act>DmOser1 ♂, n = 99). Survival curves were plotted and analyzed by Log-rank (Mantel-Cox) test using GraphPad Prism 9. n.s not significant. **p < 0.01, ***p < 0.001, ****p < 0.0001. Lifespan experiments were performed at least three times independently with similar observations. Source data are provided as a Source Data file.
Fig. 4
Fig. 4. Regulation of OSER1 by FOXO in silkworms and humans.
a EMSA using biotin-labeled BmOSER1 promoter fragment and BmFoxO protein, as described in supplementary methods. b Dual-luciferase reporter gene assay quantifies transactivation of the luciferase reporter gene with co-expression of BmFoxOCA, as described in methods. Data are presented as mean with SD and statistically tested by Two-way ANOVA. c Immunofluorescence analysis of BmOSER1 subcellular localization in BmN-SWU1 cells. Red, pIZ/V5-BmOSER1-DsRed2. Blue, DAPI for nucleus stain. Magenta, the merge of BmOSER1 and DAPI. Objective lens magnification, 100X. Scale bar, 10 μm. dg The mRNA expression levels of Catalase (CAT), SOD2, and OSER1 were detected by RT-qPCR with transfection of human FOXO1 (d), FOXO3 (e), FOXO4 (f), and FOXO6 (g) overexpression plasmids in U2OS cells. The relative mRNA expression was normalized to empty vector (pCS2) transfection control. Data are presented as mean with SD of three biological replicates and statistically tested by Two-way ANOVA. h Immunofluorescence staining showed that endogenous OSER1 localizes in the cell nucleus of U2OS cells. Red: OSER1, Blue, Hoechst. Scale bar, 10 μm. The images were taken by confocal laser scanning microscope LSM710 (Zesis) under 63X objective. i Relative SOD1 and OSER1 mRNA expression in U2OS cells treated with 0, 200, or 500 μM hydrogen peroxide (H2O2) for 12 h, respectively. Data are presented as mean with SD and statistically tested by Two-way ANOVA. n.s., not significant; **p < 0.01, ***p < 0.001, ****p < 0.0001. All data points derive from independent cell line lysates. Source data are provided as a Source Data file.
Fig. 5
Fig. 5. Impact of OSER1 on oxidative stress in Drosophila and silkworms.
Survival of DmOser1 mutant (a) or overexpression (OE) flies (b) fed with the standard diet with 20 mM paraquat. The number of flies in the lifespan experiment: (a) yw/DmOser1 ♀ (heterozygous control), n = 102; yw/DmOser1mt ♂, n = 98; DmOser1mt/DmOser1mt ♀ (homozygous mutant), n = 100; DmOser1mt/DmOser1mt ♂, n = 99; (b) Act-GAL4/+ ♀ (heterozygous control), n = 74; Act-GAL4/+ ♂, n = 65; Act>DmOser1 ♀ (homozygous overexpression), n = 74; Act>DmOser1 ♂, n = 62. c Control and DmOser1 overexpression fly larvae imaginal wing discs were stained with DHE (ROS indicator). d Quantification of wing disc size and DHE fluorescence intensity in the whole and different regions of wing imaginal discs. Unpaired t test, Two-tailed. Whiskers: minima and maxima, Center: median, Bounds of box: 25% and 75% percentile. e Transcripts of DmOser, Sod2, Cat, and GPx were quantified by qPCR in Drosophila larval whole wing discs. n = 6 for each group. Unpaired t test, Two-tailed. f Survival of flies overexpressing DmOser1 under conditions of starvation. Act-GAL4/+ ♀, n = 75; Act-GAL4/+ ♂, n = 68; Act>DmOser1 ♀, n = 75; Act>DmOser1 ♂, n = 72. g Survival of DmOser1 overexpressing flies under heat shock (37 °C). Act-GAL4/+ ♀, n = 75; Act-GAL4/+ ♂, n = 35; Act>DmOser1 ♀, n = 75; Act>DmOser1 ♂, n = 62. h Survival of BmOSER1 knockout silkworm larvae under heat shock (37 °C) (mixed sexes). koCtrl, n = 23; koBmOSER1, n = 18. i Expression of BmOSER1 and BmCAT mRNA in adult silkworms treated with 50 mM H2O2. Unpaired t test, Two-tailed. j Expression of BmOSER1, BmSOD1, BmCAT, and BmGpx mRNA in BmE cells after treatment with 1 mM H2O2. n = 6 for each group. Unpaired t test, Two-tailed. k Staining of silkworm embryonic BmE cells with DCF (dichlorofluorescein) with or without BmOSER1 overexpression. Unpaired t test, Two-tailed. l Expression of BmSOD1, BmCAT, and BmGpx mRNA after 1 mM H2O2 treatment in the presence or absence of BmOSER1 overexpression. Scatter plots are presented as mean with SD, and differences between control and treatment groups were analyzed by Unpaired t-test, Two-tailed. Survival curves were analyzed using Log-rank (Mantel-Cox) test. n.s., not significant; *p < 0.05, **p < 0.01, ***p < 0.001, ****p < 0.0001. All data points derive from independent cell line lysates, Drosophila imaginal wing discs, Drosophila, and silkworms. Lifespan experiments were performed at least three times independently with similar observations. Source data are provided as a Source Data file.
Fig. 6
Fig. 6. OSER1 regulation of lifespan, oxidative stress, and mitochondria in nematodes.
a Survival of control and Ceoser1 knockdown C. elegans in the presence or absence of 5 mM NAC (N-acetylcysteine). siCtrl, n = 107; siCeoser1, n = 113; siCtrl+NAC, n = 106; siCeoser1+NAC, n = 113. b Survival of control and Ceoser1 overexpressing C. elegans stimulated by 4 mM TBHP (tert-Butyl hydroperoxide). oeCtrl, n = 74; oeCeoser1, n = 77. c Quantification of 2’, 7’-dichlorofluorescin diacetate (DCF-DA) fluorescence intensity. Data are presented as mean with SD and analyzed by Unpaired t-test, Two-tailed. d Quantification of the HyPer fluorescence intensity. Data are presented as mean with SD and analyzed by Unpaired t-test, Two-tailed. Ceoser1 control or knockdown nematodes were imaged for ROS indicator gst-4p::gfp at 20 °C or 25 °C on day 1 or day 2 of adulthood (e) and quantified in (f). Data are presented as mean with SD and analyzed by two-way ANOVA. g Representative confocal image of mitochondrial morphology in control and Ceoser1 knockdown nematode strains with GFP and RFP tagged mitochondria. h Quantification of mitochondria length from (g). Data are presented as mean with SD and analyzed by Unpaired t-test, Two-tailed. i ATP levels in control and Ceoser1 knockdown nematodes. Data are presented as mean with SD and analyzed by Unpaired t-test, Two-tailed. Relative expression of Ceoser1 mRNA in various longevity mutant backgrounds, including daf-16, daf-2, eat-2, pmk-1, and an skn-1 gain‐of‐function mutant (#) cultured at 20 °C (j), and Ceoser1 mRNA expressions of glp-1 mutant cultured at 25 °C (k). Data in scatter plots are presented as mean with SD and statistically tested by One-way ANOVA (j) and Unpaired t-test, Two-tailed (k). l Survival of daf-2 mutants with normal or low levels of Ceoser1 expression. All survival curves were plotted and analyzed by Log-rank (Mantel-Cox) test using GraphPad Prism 9. daf-2 siCtrl, n = 315; daf-2 siCeoser1, n = 350. n.s., not significant; *p < 0.05, **p < 0.01, ***p < 0.001, ****p < 0.0001. All data points derive from independent nematodes. Lifespan experiments were performed at least three times independently with similar observations. Source data are provided as a Source Data file.
Fig. 7
Fig. 7. OSER1 interaction network by proteomics analyses.
a, b KEGG enrichment in U2OS cells with OSER1 knockdown (kd) (a) or overexpression (oe) (b). The cnetplot of OSER1 knockdown (c) and overexpression cells (d), based on data summarized in (a) and (b), respectively. kdCtrl, the lentivirus control U2OS cell line. kdOSER1, the lentivirus-targeted knockdown of OSER1 U2OS cell line. oeCtrl, the U2OS cells transiently transfected with the control plasmid. oeOSER1, the U2OS cells transiently overexpressed with OSER1. All data are available in Supplementary Data 6 and 7.
Fig. 8
Fig. 8. Effects of BmOSER1 and Ceoser1 on reproduction.
a Representative images of eggs laid by wildtype (oeCtrl) and BmOSER1 overexpression (oeBmOSER1) silkworms. As shown, one male silkworm mates with 6 females in the wildtype Dazao and produces hatchable eggs, while in BmOSER1 overexpression silkworms, one male mates with 23 females that laid hatchable eggs. b Duration of the entire fertile mating period between male and female adult silkworms. c Number of successful matings per male adult silkworms. d The number of eggs laid per female adult silkworms in wildtype and BmOSER1 knockout. ef The total brood sizes of Ceoser1 RNAi (Ceoser1 RNAi) (e) and overexpression (oeCeoser) (f) throughout life. Data in all scatter plots are presented as mean with SD and analyzed by Unpaired t-test, Two-tailed. n.s., not significant; **p < 0.01, ***p < 0.001, ****p < 0.0001. All data points derive from independent silkworms or nematodes. Source data are provided as a Source Data file.
Fig. 9
Fig. 9. Schematic representation of workflow and model.
Transcriptomic analyses of FOXO transcriptional targets in silkworms identified an evolutionarily conserved FOXO direct target OSER1. Mechanistically, FOXO protein binds to the promoter of OSER1 to activate its transcription. OSER1 expression is essential for normal mitochondrial morphology and functions, as well as low levels of reactive oxygen species (ROS), possibly via interacting with other as yet unidentified proteins. The in vivo studies showed the critical roles of OSER1 in longevity and stress resistance (especially oxidative stress response) in silkworms, flies, and nematodes. Interestingly, human subject studies support the idea that OSER1 also influences the human lifespan. This figure was created by BioMedVisual.com.

References

    1. van der Horst, A. & Burgering, B. M. Stressing the role of FoxO proteins in lifespan and disease. Nat. Rev. Mol. Cell Biol.8, 440–450 (2007). - PubMed
    1. Martins, R., Lithgow, G. J. & Link, W. Long live FOXO: unraveling the role of FOXO proteins in aging and longevity. Aging Cell15, 196–207 (2016). - PMC - PubMed
    1. Kenyon, C. J. The genetics of ageing. Nature464, 504–512 (2010). - PubMed
    1. Greer, E. L. et al. The energy sensor AMP-activated protein kinase directly regulates the mammalian FOXO3 transcription factor. J. Biol. Chem.282, 30107–30119 (2007). - PubMed
    1. Hay, N. Interplay between FOXO, TOR, and Akt. Bba-Mol. Cell Res1813, 1965–1970 (2011). - PMC - PubMed

MeSH terms

Substances

LinkOut - more resources