. 2024 Aug 20;15(1):7137.
doi: 10.1038/s41467-024-51407-5.

H-NS is a bacterial transposon capture protein

Affiliations

H-NS is a bacterial transposon capture protein

Charles Cooper et al. Nat Commun. .

Abstract

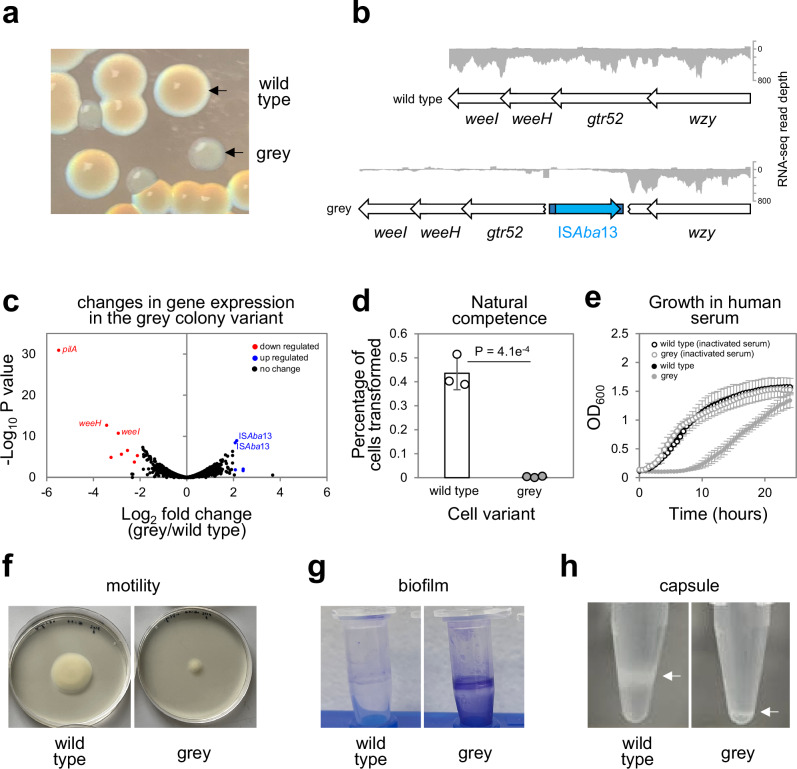
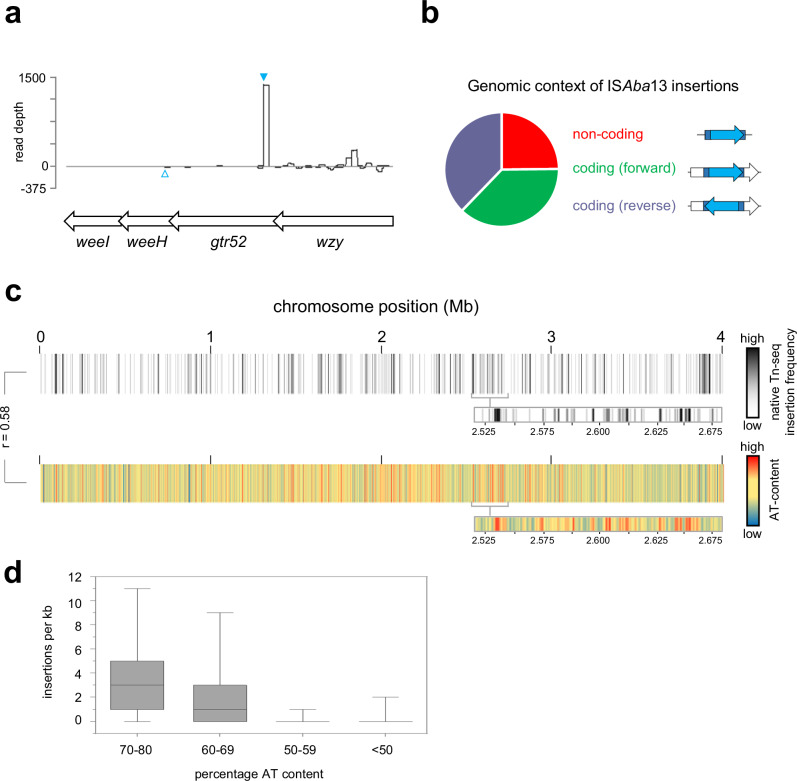
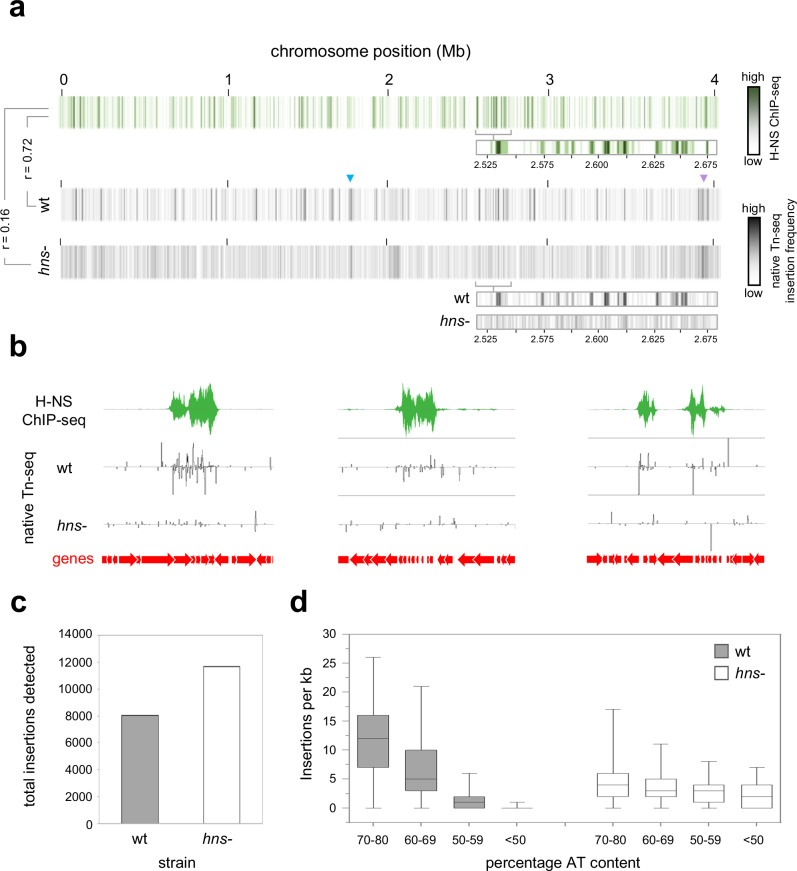
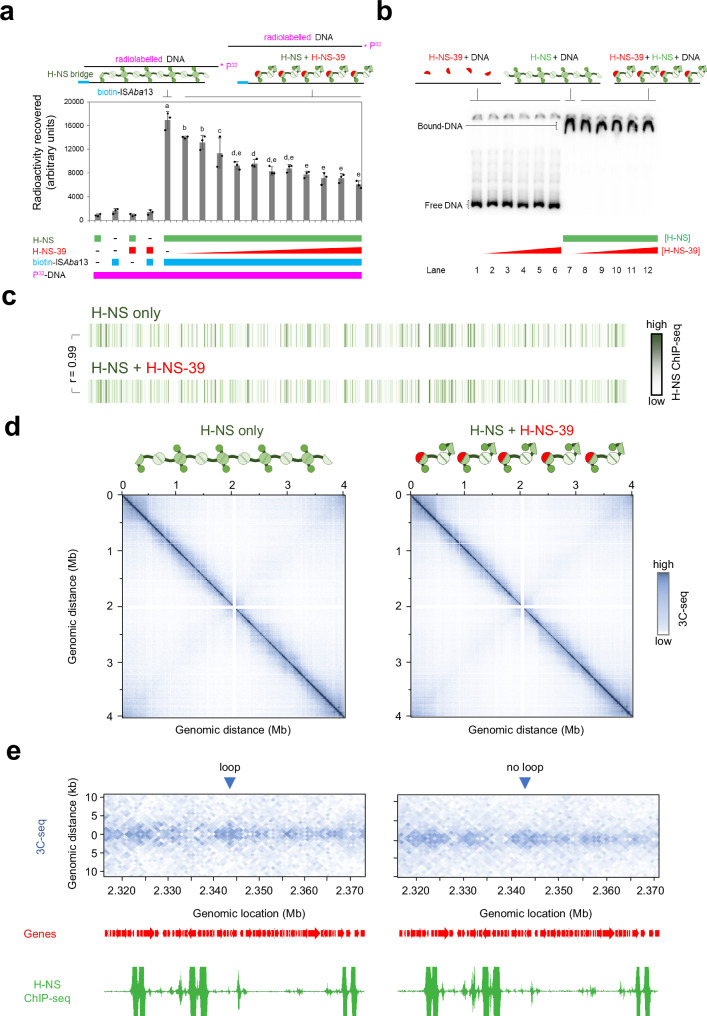
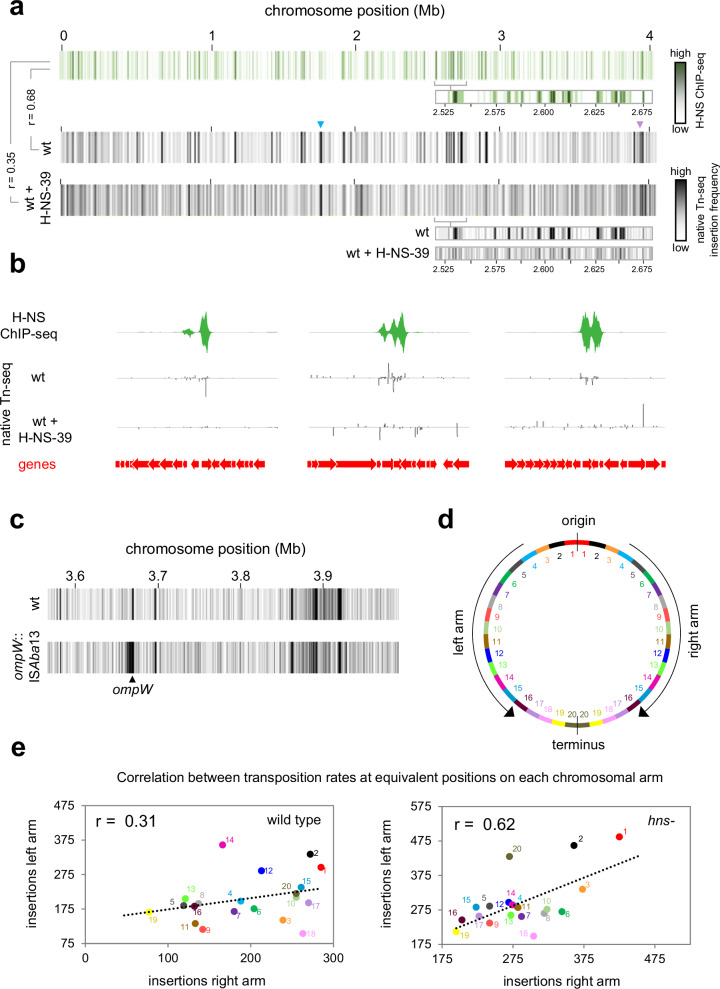
The histone-like nucleoid structuring (H-NS) protein is a DNA binding factor, found in gammaproteobacteria, with functional equivalents in diverse microbes. Universally, such proteins are understood to silence transcription of horizontally acquired genes. Here, we identify transposon capture as a major overlooked function of H-NS. Using genome-scale approaches, we show that H-NS bound regions are transposition "hotspots". Since H-NS often interacts with pathogenicity islands, such targeting creates clinically relevant phenotypic diversity. For example, in Acinetobacter baumannii, we identify altered motility, biofilm formation, and interactions with the human immune system. Transposon capture is mediated by the DNA bridging activity of H-NS and, if absent, more ubiquitous transposition results. Consequently, transcribed and essential genes are disrupted. Hence, H-NS directs transposition to favour evolutionary outcomes useful for the host cell.


Conflict of interest statement

The authors declare no competing interests.

Figures

Fig. 1
Fig. 1. Phenotypic diversity resulting from ISAba13 transposition into the Acinetobacter baumannii K-locus.
a Identification of a grey colony derivative. The image shows colonies of A. baumannii AB5075 grown on LB agar plates. The grey colony derivative arises spontaneously. b Genetic basis for the grey colony phenotype. Grey colony derivatives have a copy of the insertion sequence ISAba13 within the gtr52 gene of the capsule locus. Genes are shown as arrows and labelled. ISAba13 is in blue. The darker blue sections of ISAba13 represent the terminal inverted repeat sequences. The traces show Illumina sequencing read depths from RNA-seq experiments. Reads mapping to the top and bottom strands of the DNA are shown as positive and negative values respectively. The weeH and weeI genes are also referred to by the pseudonyms itrA1 and qhbA respectively,,. Note that only a section of the K-locus is illustrated, the full region occupies genomic positions 3,907,256 to 3,931,673. c Disruption of the K-locus also causes down regulation of the pilA gene. The volcano plot illustrates the results of RNA-seq experiments comparing the transcriptomes of wild type and grey colony types. Each data point represents a gene and significantly up- and down-regulated genes (P < 0.05 and a Log2 fold change of 2 or more) are highlighted blue and red respectively. P was calculated using an exact test. Notable genes are labelled. Note that the apparent up regulation of ISAba13 is likely to be an artefact due to the increased copy number of the element in grey cell derivatives. Two biological replicates were done. Source data are provided as a Source Data file. d Grey variants are defective for natural transformation. The bar chart shows the percentage of wild type and grey variant cells transformed by exogenous DNA. Results are the average of three biological replicates and error bars indicate standard deviation from the mean. Individual measurements are shown as discrete datapoints. A two-tailed student’s t test was used to determine P. Source data are provided as a Source Data file. e Grey variants cannot grow in human serum. The graph shows growth of wild type A. baumannii and the grey variant in the presence of 50% (v/v) human serum or heat inactivated human serum. Results are the average of three biological replicates and error bars indicate standard deviation from the mean. There is a significant difference in growth for wild type and grey variants in human serum (P = 9.3e−8) but not heat inactivated serum (P = 0.97) as determined using a one-way ANOVA test. Source data are provided as a Source Data file. f Grey colony variants are less motile. The image shows spread of wild type and grey colony variants on soft agar plates. g Grey colony variants better adhere to surfaces and form biofilms. The image shows crystal violet stained A. baumannii biofilms formed on the surface of microfuge tubes. h Grey colony derivatives are defective for capsule production. The images show cells separated by centrifugation in 125 µl of 30% (w/v) colloidal silica. Cells are visible as white bands and those with less capsule are more mobile during centrifugation.
Fig. 2
Fig. 2. Mapping genome and population wide transposition of ISAba13 reveals a strong preference for the K-locus and other AT-rich DNA regions.
a ISAba13 insertions at the K-locus. The schematic shows a section of the K-locus and corresponding read depths from native Tn-seq experiments. Genes are shown as arrows and sequence reads corresponding to ISAba13 insertion in the forward or reverse orientation are given as positive or negative read depths respectively. The filled cyan triangle indicates the site of ISAba13 insertion in the grey variant described in this work. The open cyan triangle indicates the site of ISAba13 insertion previously described by Whiteway et al. . b Genomic context of ISAba13 insertions. The pie chart illustrates the relative number of ISAba13 insertions detected in non-coding DNA or inside genes in each possible orientation. Note that non-coding DNA accounts for 13% of the A. baumannii chromosome but contains 25% of the ISAba13 insertions. c Chromosome-wide patterns of ISAba13 transposition. The panel shows two heatmaps, each representing the A. baumannii chromosome divided into 1 kb sections. Each section is coloured according to the number of ISAba13 insertions detected using native Tn-seq (top) or average DNA AT-content (bottom). The heatmap expansions are provided to aid comparison of the insertion frequency and AT-content. The Pearson correlation coefficient (r) of the two datasets is shown. d ISAba13 targets AT-rich sections of the A. baumannii chromosome. Box plot showing the distribution of ISAba13 insertion frequencies for 1 kb regions, with different AT-content, across two biological replicates. Boxes indicate the 25th–75th percentile. Horizontal lines indicate the median value. The whiskers indicate minimum and maximum values. Source data are provided as a Source Data file.
Fig. 3
Fig. 3. Targeting of ISAba13 to AT-rich DNA is driven by H-NS.
a Global patterns of H-NS binding and ISAba13 transposition are correlated and H-NS dependent. The panel shows three heatmaps, each representing the A. baumannii chromosome divided into 1 kb sections. Sections are coloured according to the H-NS ChIP-seq binding signal (top) or the number of ISAba13 insertions detected using native Tn-seq for wild type (middle) or hns- cells (bottom). The heatmap expansions are provided to aid comparison of H-NS binding and insertion frequency. Pearson correlation coefficients (r) between datasets are shown. The raw H-NS ChIP-seq read depths are provided in Supplementary Data 1. b Examples of H-NS mediated ISAba13 capture. Selected chromosomal regions with H-NS ChIP-seq and native Tn-seq data shown. In both cases, traces indicate read depths with positive and negative values corresponding to the top and bottom DNA strand respectively. Genes are shown as arrows. From left to right, the genomic loci are centred approximately around positions 134,000, 2,536,000 and 2,455,000 of the genome. c The number of detected transposition events is similar in the presence and absence of H-NS. The bar chart shows the number of ISAba13 insertions detected by native Tn-seq in wild type and hns- cells. For each strain, the number of insertions indicated is the combined total from two biological replicates. Source data are provided as a Source Data file. d Targeting of ISAba13 to AT-rich DNA is H-NS dependent. Box plot showing the distribution of ISAba13 insertion frequencies for 1 kb regions, with different AT-contents, in two biological replicates of wild type and hns- cells. Boxes indicate the 25th–75th percentile. Horizontal lines indicate the median value. The whiskers indicate minimum and maximum values. Source data are provided as a Source Data file.
Fig. 4
Fig. 4. The H-NS multimerization region blocks H-NS mediated DNA bridging in vitro and in vivo.
a H-NS-39 interferes with H-NS mediated DNA bridging in vitro. The bar chart illustrates the amount of radiolabelled DNA recovered by H-NS mediated bridging interactions with biotin labelled ISAba13. The radiolabelled sequence corresponds to the H-NS bound regulatory DNA upstream of genes encoding the type 6 secretion system of A. baumannii (Fig. S3a). Where present, H-NS was used at a final concentration of 6 μM. The bridging interaction is disrupted by H-NS-39, added at final concentrations between 0.5 and 10 μM. Results are the average of three independent experiments and error bars indicate standard deviation from the mean. The schematic above the graph illustrates the procedure. DNA fragments are shown as solid lines and H-NS is in green. Individual H-NS molecules possess surfaces for DNA binding (circle), dimerisation (dark green semi-circle) and multimerization (pale green semi-circle). H-NS-39 (red) consists of the multimerization surface only. Different letters above bars indicate significantly different groups according to an unpaired one-way ANOVA with Tukey’s HSD test (P = 6.63e−11). Source data are provided as a Source Data file. b H-NS-39 does not bind DNA or interfere with binding of H-NS to DNA in vitro. Results of an electrophoretic mobility shift assay to measure binding of H-NS to the regulatory region of genes encoding the type 6 secretion system of A. baumannii, and the impact of H-NS-39. Where present, H-NS and H-NS-39 were used at final concentrations of 6 μM and 1–10 μM respectively. The schematic is as described for (a). The experiment was done twice. c Global DNA binding by H-NS in vivo is the same in the presence and absence of H-NS-39. The panel shows two heatmaps, each representing the A. baumannii chromosome divided into 1 kb sections. Sections are coloured according to the H-NS ChIP-seq binding signal in the absence (top) or presence (bottom) of ectopic H-NS-39 expression. The Pearson correlation coefficient (r) between datasets is shown. The raw H-NS ChIP-seq read depths are provided in Supplementary Data 1. d Global 10 kb resolution 3C-seq contact maps are the same in the presence and absence of H-NS-39. The heatmaps illustrate interaction frequencies between 10 kb sections of the A. baumannii chromosome, measured by 3C-seq, in the presence and absence of H-NS-39. Axes indicate the genomic location of each bin in the pair. Individual sections are coloured according to the number of interactions between the two corresponding chromosomal locations. The contact matrix values, and explorable versions of each matrix, are in Supplementary Data files 2–4. e H-NS-39 alters short range interactions in 1 kb resolution 3C-seq contact maps. The heatmaps illustrate interaction frequencies between 1 kb sections of the A. baumannii chromosome, measured by 3C-seq, in the presence and absence of H-NS-39. An interaction pattern indicative of a loop is marked by a blue triangle. Signal in this region is lost in the presence of H-NS-39. The locations of genes (red arrows) are also shown alongside H-NS binding patterns determined by ChIP-seq with or without expression of H-NS-39. The contact matrix values, and explorable versions of each matrix, are in Supplementary Data files 2–4.
Fig. 5
Fig. 5. DNA bridging is required for capture of transposition events by H-NS.
a H-NS-39 causes more uniform ISAba13 transposition patterns globally. The panel shows three heatmaps, each representing the A. baumannii chromosome divided into 1 kb sections. Sections are coloured according to the H-NS ChIP-seq binding signal (top) or the number of ISAba13 insertions detected using native Tn-seq in the absence (middle) or presence (bottom) of H-NS-39 expression. The heatmap expansions are provided to aid comparison of H-NS binding and insertion frequency. Pearson correlation coefficients (r) between datasets are shown. b Examples of H-NS-39 mediated changes to ISAba13 transposition patterns. Selected chromosomal regions with H-NS ChIP-seq and native Tn-seq data shown. In both cases, traces indicate read depths with positive and negative values corresponding to the top and bottom DNA strand respectively. Genes are shown as arrows. c Transposition hotspots arise immediately adjacent to existing copies of ISAba13. The panel shows two heatmaps, each representing a 0.4 Mb region of the A. baumannii chromosome divided into 1 kb sections. Introduction of ISAba13 in ompW creates a transposition hotspot, around 10 kb in size, surrounding the insertion site. d Map of the A. baumannii chromosome. The schematic illustrates the A. baumannii chromosome divided into 40 sections, each 100 kb in length. Equivalent sections in the left and right replichores are coloured and numbered accordingly. e The number of detected transposition events correlate between equivalent positions on each chromosomal arm. The scatter plots show the number of ISAba13 insertions, detected by native Tn-seq, at equivalent positions on each chromosomal arm, in the presence and absence of hns. Data points are coloured according to the schematic in (d) and r values are correlation coefficients. Source data are provided as a Source Data file.

References

    1. Garcia-Vallve, S., Romeu, A. & Palau, J. Horizontal gene transfer in bacterial and archaeal complete genomes. Genome Res.10, 1719 (2000). 10.1101/gr.130000 - DOI - PMC - PubMed
    1. Nelson, E. J., Harris, J. B., Morris, J. G., Calderwood, S. B. & Camilli, A. Cholera transmission: the host, pathogen and bacteriophage dynamic. Nat. Rev. Microbiol.7, 693–702 (2009). 10.1038/nrmicro2204 - DOI - PMC - PubMed
    1. Venkatesan, M. M. et al. Complete DNA sequence and analysis of the large virulence plasmid of Shigella flexneri. Infect. Immun.69, 3271–3285 (2001). 10.1128/IAI.69.5.3271-3285.2001 - DOI - PMC - PubMed
    1. Borgeaud, S., Metzger, L. C., Scrignari, T. & Blokesch, M. The type VI secretion system of Vibrio cholerae fosters horizontal gene transfer. Science347, 63–67 (2015). 10.1126/science.1260064 - DOI - PubMed
    1. Seitz, P. & Blokesch, M. DNA-uptake machinery of naturally competent Vibrio cholerae. PNAS110, 17987–92 (2013). 10.1073/pnas.1315647110 - DOI - PMC - PubMed

MeSH terms

LinkOut - more resources