

Decoding myasthenia gravis: advanced diagnosis with infrared spectroscopy and machine learning
- PMID: 39164310
- PMCID: PMC11336246
- DOI: 10.1038/s41598-024-66501-3
Decoding myasthenia gravis: advanced diagnosis with infrared spectroscopy and machine learning
Abstract
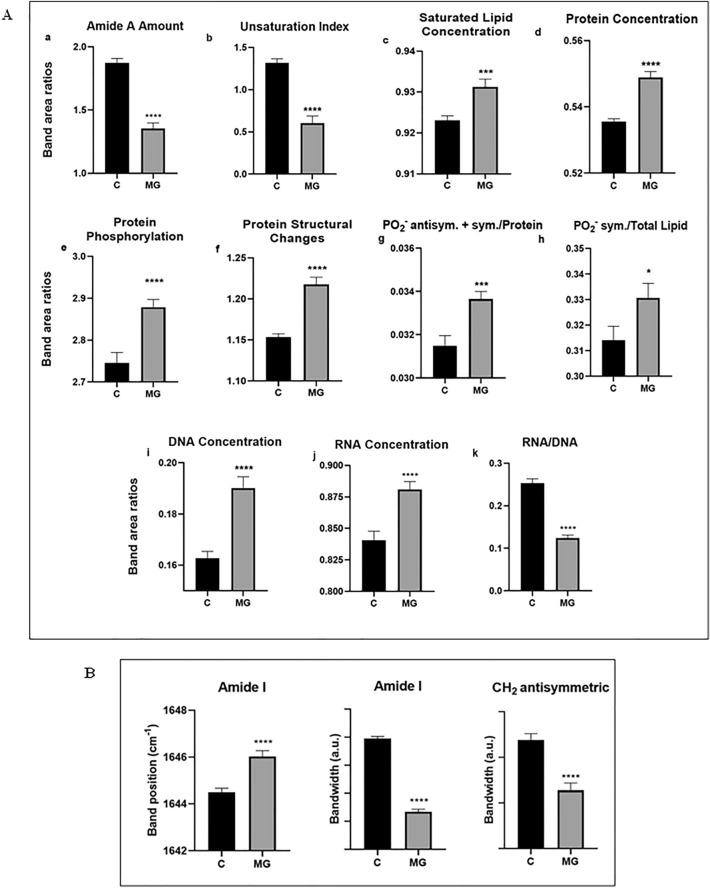
Myasthenia Gravis (MG) is a rare neurological disease. Although there are intensive efforts, the underlying mechanism of MG still has not been fully elucidated, and early diagnosis is still a question mark. Diagnostic paraclinical tests are also time-consuming, burden patients financially, and sometimes all test results can be negative. Therefore, rapid, cost-effective novel methods are essential for the early accurate diagnosis of MG. Here, we aimed to determine MG-induced spectral biomarkers from blood serum using infrared spectroscopy. Furthermore, infrared spectroscopy coupled with multivariate analysis methods e.g., principal component analysis (PCA), support vector machine (SVM), discriminant analysis and Neural Network Classifier were used for rapid MG diagnosis. The detailed spectral characterization studies revealed significant increases in lipid peroxidation; saturated lipid, protein, and DNA concentrations; protein phosphorylation; PO2-asym + sym /protein and PO2-sym/lipid ratios; as well as structural changes in protein with a significant decrease in lipid dynamics. All these spectral parameters can be used as biomarkers for MG diagnosis and also in MG therapy. Furthermore, MG was diagnosed with 100% accuracy, sensitivity and specificity values by infrared spectroscopy coupled with multivariate analysis methods. In conclusion, FTIR spectroscopy coupled with machine learning technology is advancing towards clinical translation as a rapid, low-cost, sensitive novel approach for MG diagnosis.
© 2024. The Author(s).
Conflict of interest statement
The authors declare no competing interests.
Figures


Similar articles
-
Fourier transform InfraRed spectra analyzed by multivariate and machine learning methods in determination spectroscopy marker of prostate cancer in dried serum.Spectrochim Acta A Mol Biomol Spectrosc. 2025 Feb 15;327:125305. doi: 10.1016/j.saa.2024.125305. Epub 2024 Oct 22. Spectrochim Acta A Mol Biomol Spectrosc. 2025. PMID: 39490177
-
Rapid detection of serological biomarkers in gallbladder carcinoma using fourier transform infrared spectroscopy combined with machine learning.Talanta. 2023 Jul 1;259:124457. doi: 10.1016/j.talanta.2023.124457. Epub 2023 Mar 23. Talanta. 2023. PMID: 36989965
-
Renal Cell Carcinoma Discrimination through Attenuated Total Reflection Fourier Transform Infrared Spectroscopy of Dried Human Urine and Machine Learning Techniques.Int J Mol Sci. 2024 Sep 11;25(18):9830. doi: 10.3390/ijms25189830. Int J Mol Sci. 2024. PMID: 39337322 Free PMC article.
-
Fourier Transform Infrared Spectroscopy in Oral Cancer Diagnosis.Int J Mol Sci. 2021 Jan 26;22(3):1206. doi: 10.3390/ijms22031206. Int J Mol Sci. 2021. PMID: 33530491 Free PMC article. Review.
-
Biofluid diagnostics by FTIR spectroscopy: A platform technology for cancer detection.Cancer Lett. 2020 May 1;477:122-130. doi: 10.1016/j.canlet.2020.02.020. Epub 2020 Feb 26. Cancer Lett. 2020. PMID: 32112901 Review.
Cited by
-
Structural features of DNA and their potential contribution to blind mole rat (Nannospalax xanthodon) longevity.Biogerontology. 2025 Mar 25;26(2):78. doi: 10.1007/s10522-025-10221-2. Biogerontology. 2025. PMID: 40131556 Free PMC article.
-
Machine Learning in Myasthenia Gravis: A Systematic Review of Prognostic Models and AI-Assisted Clinical Assessments.Diagnostics (Basel). 2025 Aug 14;15(16):2044. doi: 10.3390/diagnostics15162044. Diagnostics (Basel). 2025. PMID: 40870896 Free PMC article. Review.
-
FTIR spectroscopic characterization reveals short-term macromolecular responses to photobiomodulation in mesenchymal stem cells.Sci Rep. 2025 Aug 23;15(1):31051. doi: 10.1038/s41598-025-15190-7. Sci Rep. 2025. PMID: 40849501 Free PMC article.
-
MicroRNAs as Diagnostic Biomarkers of Myasthenia Gravis: A Systematic Review and Meta-Analysis.Cell Mol Neurobiol. 2025 Jul 18;45(1):71. doi: 10.1007/s10571-025-01585-7. Cell Mol Neurobiol. 2025. PMID: 40679699 Free PMC article.
References
-
- Suresh, A. B. & Asuncion, R. M. D. Myasthenia Gravis. StatPearls (2023). - PubMed
-
- Yavuz, Z. Türkiye Cumhuriyeti Ankara Üniversitesi Tip Fakültesi Myastenia Gravis klinik ve demografik özellikleri.
-
- Lennon, V. A. Serologic profile of and distinction from myasthenic myasthenia gravis the lambert-eaton syndrome. Neurology48, 23S (1997).10.1212/WNL.48.Suppl_5.23S - DOI
MeSH terms
Substances
Grants and funding
LinkOut - more resources
Full Text Sources
Medical
