. 2024 Oct;9(10):2653-2665.
doi: 10.1038/s41564-024-01778-8. Epub 2024 Aug 20.

Gut epithelial electrical cues drive differential localization of enterobacteria

Affiliations

Gut epithelial electrical cues drive differential localization of enterobacteria

Yaohui Sun et al. Nat Microbiol. 2024 Oct.

Abstract

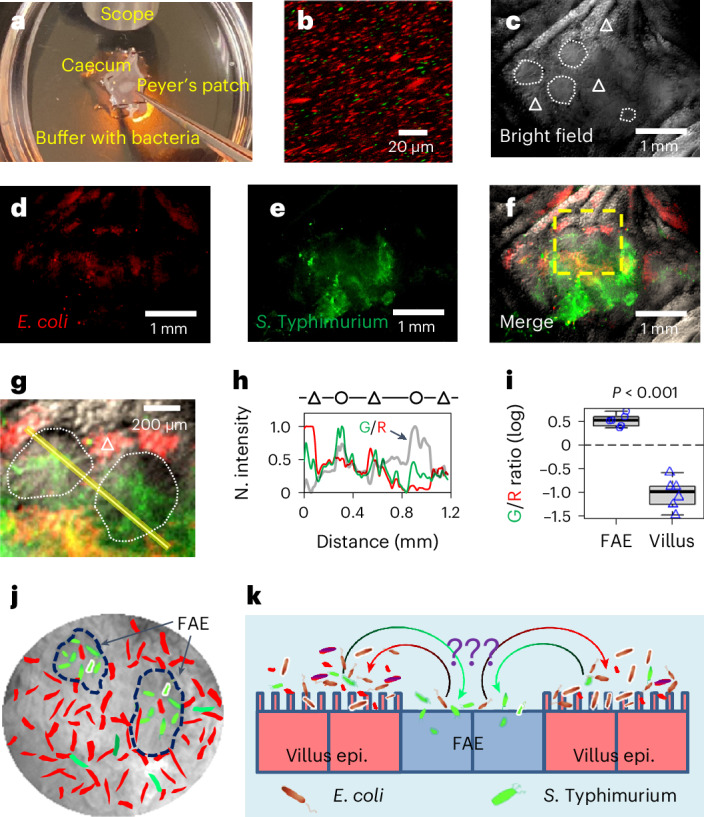
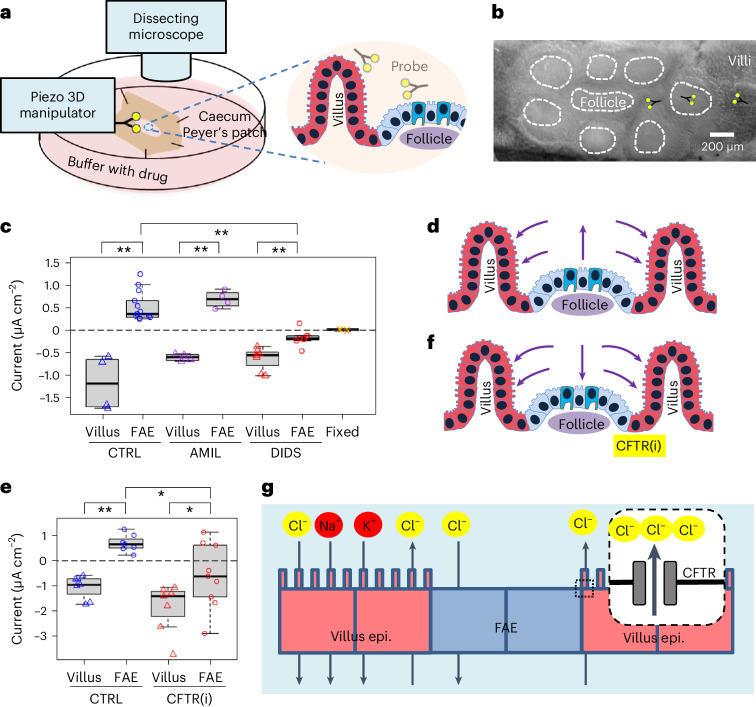
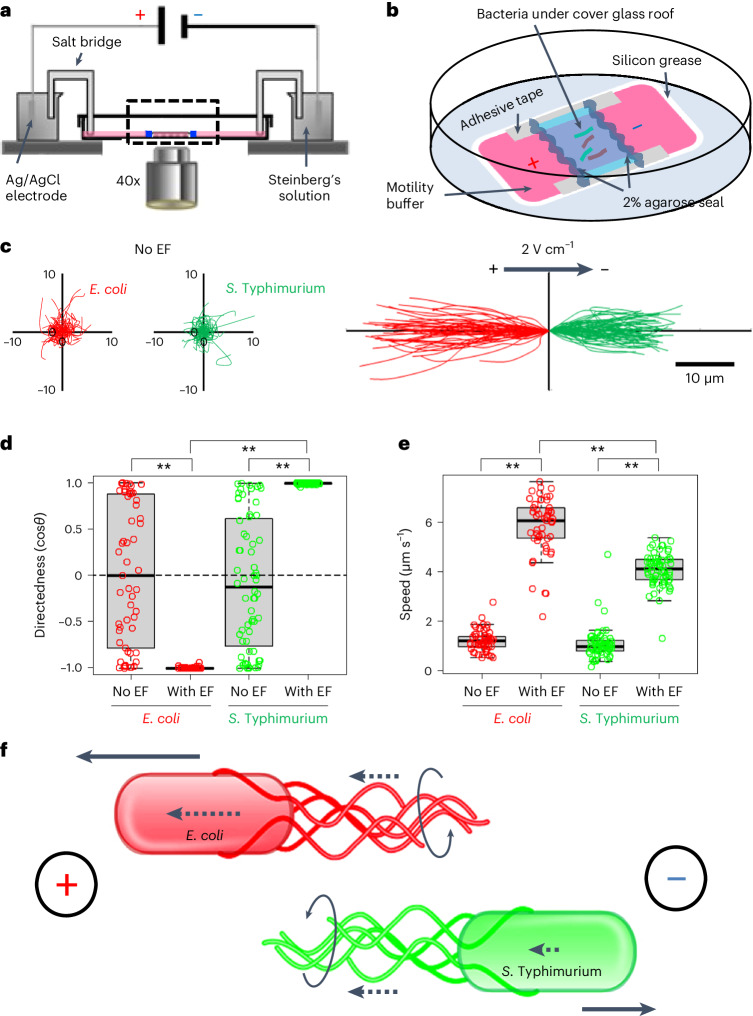
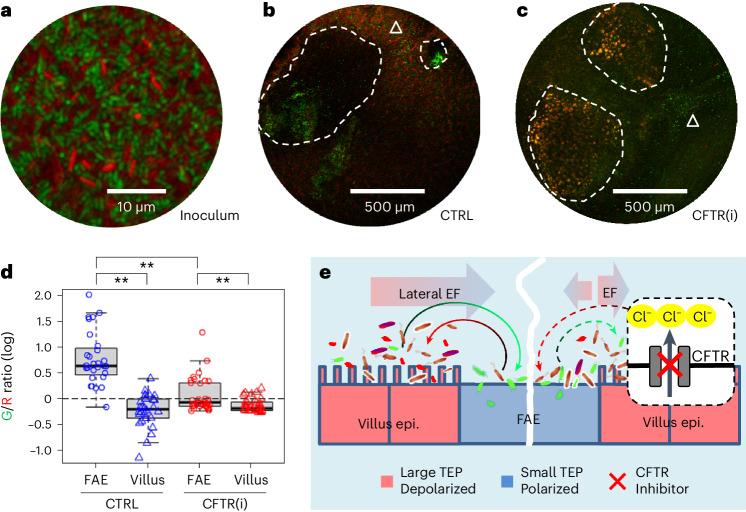
Salmonella translocate to the gut epithelium via microfold cells lining the follicle-associated epithelium (FAE). How Salmonella localize to the FAE is not well characterized. Here we use live imaging and competitive assays between wild-type and chemotaxis-deficient mutants to show that Salmonella enterica serotype Typhimurium (S. Typhimurium) localize to the FAE independently of chemotaxis in an ex vivo mouse caecum infection model. Electrical recordings revealed polarized FAE with sustained outward current and small transepithelial potential, while the surrounding villus is depolarized with inward current and large transepithelial potential. The distinct electrical potentials attracted S. Typhimurium to the FAE while Escherichia coli (E. coli) localized to the villi, through a process called galvanotaxis. Chloride flux involving the cystic fibrosis transmembrane conductance regulator (CFTR) generated the ionic currents around the FAE. Pharmacological inhibition of CFTR decreased S. Typhimurium FAE localization but increased E. coli recruitment. Altogether, our findings demonstrate that bioelectric cues contribute to S. Typhimurium targeting of specific gut epithelial locations, with potential implications for other enteric bacterial infections.


Conflict of interest statement

The authors declare no competing financial interests.

Figures

Fig. 1
Fig. 1. S. Typhimurium amasses in FAE and E. coli avoids the FAE.
a, Schematic illustrating the S. Typhimurium (expressing EGFP) vs E. coli (expressing dTomato) competitive targeting experiment setup in an ex vivo mouse caecum model. A freshly isolated mouse caecum was mounted in a silicone gel plate with its luminal side facing up. Tweezers point to a Peyer’s patch (details in Methods). b, A confocal image shows the inoculum of E. coli (red) vs S. Typhimurium (green) mixture (20:1, 108 c.f.u.s ml–1 in mouse Ringer’s solution). cf, Bright-field images of the mucosal epithelium of a mouse caecum shows the organization of FAE (white dotted enclosure) and villi (white triangle) (c), RFP fluorescence image of E. coli expressing dTomato (d), GFP fluorescence image of S. Typhimurium expressing EGFP (e) and the overlay (f). g, Enlargement of the yellow dashed area in f, showing that S. Typhimurium (green) preferably colonized FAE (white dotted enclosure), while E. coli (red) are dominantly associated with villus epithelium (white triangle). h, Normalized fluorescence profiles and green/red fluorescence ratio (thick grey line indicated by an arrow) of the line scan in g, showing difference in S. Typhimurium (green) and E. coli (red) spatial distributions between FAE (circle) and inter- and extrafollicular villus epithelium (triangle). i, Mean green/red fluorescence intensity (G/R) ratios associated with FAE or villus epithelium plotted in common logarithm (n = 6 mice, P < 0.001 by unpaired, two-tailed Student’s t-test). Box tops indicate the 75th percentile, box bottoms indicate the 25th percentile, centre lines indicate median, and whiskers indicate maximum and minimum. Dashed line indicates the ratio of 1. j, Cartoon showing microscopic view with two highlighted FAEs (dashed enclosures); S. Typhimurium in green and E. coli in red. k, Summary of the finding that S. Typhimurium (green) navigates to and accumulates in FAE, which E. coli (red) avoids and stays away from, through an unknown sorting mechanism (question marks). Source data
Fig. 2
Fig. 2. Robust ionic currents emerge from ion channel activities at murine caecum epithelia.
a, Schematic of the experimental setup. Forks indicate vibrating probes and the sites where current densities were measured. b, A mouse caecum under a dissecting microscope as viewed from the luminal side, showing an intact Peyer’s Patch containing a cluster of follicles (dashed enclosures) surrounded by villi. Forks indicate vibrating probes and the sites where current densities were measured. c, Peak ionic current densities (JI) in the absence (CTRL) or presence of a general ENaC inhibitor (AMIL) or chloride channel inhibitor (DIDS). Formalin-fixed mouse caeca (‘Fixed’) served as control. Each data point represents the average of 3 to 5 FAE or villus epithelium from each mouse (n = 4, 13, 4, 4, 7, 8, 4, respectively, from left to right). **P < 0.01 by one-way ANOVA with post hoc Tukey HSD test. Box tops indicate the 75th percentile, box bottoms indicate the 25th percentile, centre lines indicate median, and whiskers indicate maximum and minimum. d, A cartoon depicts ionic flows in caecal FAE and around villus epithelium as detected by vibrating probes. Arrows indicate the flow directions and sizes are approximate. e, Peak ionic current density (JI) in the absence (CTRL) or presence of a CFTR inhibitor (CFTR(i)). Each dot represents the average of 3 to 5 FAE or villus epithelium from each mouse (n = 7, 7, 7, 9, respectively, from left to right). Box tops indicate the 75th percentile, box bottoms indicate the 25th percentile, centre lines indicate median, and whiskers indicate maximum and minimum. *P < 0.05, **P < 0.01 by one-way ANOVA with post hoc Tukey HSD test. f, Ionic flows in the presence of a CFTR inhibitor (CFTR(i)). Note the reversed ionic flow around the FAE due to reduced secretion of chloride or bicarbonate. g, Schematic illustrating critical roles of major ion channels and CFTR in generating the ionic flows around the FAE. Source data
Fig. 3
Fig. 3. Regional pattern of cell membrane potentials in the FAE and villus epithelium.
a, Bright-field, live fluorescence and merged images of a mouse caecum, showing a Peyer’s patch stained with membrane potential-sensitive probe DiBAC4(3) (also see Extended Data Fig. 3). Enlargement of the yellow dashed area (bottom right panel) highlights a follicle (white dotted enclosure) surrounded by densely stained villus epithelium (white triangle), showing that the villus epithelium is electrically more positive than the FAE. b, Fluorescence intensity profile of the line scan in a (top right panel), showing a spatial difference in cellular membrane potential between FAE (circle) and inter- and extrafollicular villus epithelium (triangle). c, Relative quantitation of resting Vm of FAE and villus epithelium by DiBAC4(3) fluorescence fraction (%). A higher fraction means a more depolarized area. Quantification was based on observations from multiple FAEs and corresponding villus regions across two independent experiments (n = 4 mice, P < 0.001 by unpaired, two-tailed Student’s t-test). Box tops indicate the 75th percentile, box bottoms indicate the 25th percentile, centre lines indicate median, and whiskers indicate maximum and minimum. d, Pseudocoloured map of the Peyer’s patch region in a with a fire look-up table scale, showing the electrically negative FAEs surrounded by the relatively more positive villus epithelium. e, A cartoon to suggest how CFTR and flow of Cl or HCO3 influence cellular membrane potential at FAE and surrounding villus epithelium (details in the main text). Source data
Fig. 4
Fig. 4. Spatial difference in transepithelial potential generates a lateral potential gradient between FAE and villus epithelium.
a, A cartoon depicting the TEP experiment setup. b, A mouse caecum under a dissecting microscope, showing a glass electrode (yellow arrowhead) approaching an interfollicular villus (white triangle) surrounding a follicle (white dotted enclosure). c, Typical TEP traces recorded in the FAE or villus epithelium. d, The basal TEP of both villi and FAE were negative in the mouse caeca and significantly larger in the villi than in FAE (P = 0.033, by unpaired, two-tailed Student’s t-test). Each data point represents the average of 3 to 5 FAE or villus epithelium from each mouse (n = 7). Formalin-fixed mouse caeca (‘Fixed’) served as control (n = 3), which is not subjected to statistical analysis. e, The major villus away from FAE indicated as ‘av’ in b (n = 6) and the interfollicular villus surrounding FAE indicated as ‘iv’ in b (n = 4) have similar TEPs (P = 0.350, by unpaired, two-tailed Student’s t-test). For d and e, box tops indicate the 75th percentile, box bottoms indicate the 25th percentile, centre lines indicate median, and whiskers indicate maximum and minimum. f, Schematic illustration of the spatially distinctive TEPs and the generation of a lateral bioelectric field between FAE and surrounding villus epithelium. Source data
Fig. 5
Fig. 5. A physiological electrical field drives opposing directional migration of S. Typhimurium to the cathode and E. coli to the anode in vitro.
a, Experimental setup. b, Enlargement of the dashed area in a. c, Migration trajectories over 6 s of E. coli (red) and S. Typhimurium (green) in the absence (No EF) or presence of an electrical field (2 V cm−1) with the field polarity as shown. d,e, Quantification of directedness (cosθ: negative to the anode or left, positive to the cathode or right) (d), and migration speed (µm s−1) (e) of E. coli and S. Typhimurium in the absence (No EF) or presence (With EF) of electrical field. Each circle represents an individual cell (n = 57, 53, 64, 65, respectively, from left to right). Box tops indicate the 75th percentile, box bottoms indicate the 25th percentile, centre lines indicate median, and whiskers indicate maximum and minimum. **P < 0.01, by multiple unpaired, two-tailed Student’s t-test. f, The bacterial surface’s electrical property and flagellar propelling action determine migration direction in the galvanotaxis of E. coli and S. Typhimurium. Model based on ref. and this work. Dotted arrows indicate the direction and relative size of passive electrophoretic motilities of either bacterial bodies or flagellar filaments. Solid arrows indicate the direction and relative speed of bacterial migration under a 2 V cm−1 electrical field in the shown polarity. Circular arrows indicate flagellar rotations in the counterclockwise direction propelling the bacteria along a straight trajectory. Source data
Fig. 6
Fig. 6. Inhibiting CFTR decreases S. Typhimurium recruitment to the FAE and increases E. coli recruitment.
a, A confocal image illustrates the inoculum of E. coli K12 (red) and S. Typhimurium 14028S (green) at a 1:1 ratio (108 c.f.u.s ml−1 in mouse Ringer’s solution). b, A representative confocal image shows S. Typhimurium (green) accumulating in the FAE (white dashed enclosure) and E. coli (red) dominating in the villi (white triangle). c, A representative confocal image exhibits S. Typhimurium (green) and E. coli (red) co-existing in multiple regions of the FAE (white dashed enclosure) and the villus epithelium (white triangle) when CFTR is inhibited (CFTR(i)). d, Quantification of mean green/red fluorescence intensity ratios associated with FAE or villus epithelium in common logarithm. Analysis was based on observations from multiple FAEs and corresponding villus regions across two independent experiments (n = 4 mice). Box tops indicate the 75th percentile, box bottoms indicate the 25th percentile, centre lines indicate median, and whiskers indicate maximum and minimum. Dashed line indicates the ratio of 1. **P < 0.01, by one-way ANOVA followed by post hoc Tukey HSD test. e, A model proposing that a local bioelectric network drives S. Typhimurium targeting to the FAE entry port through galvanotaxis in gut epithelia. A lateral electrical field emerges from spatially defined bioelectric activities (ionic flow, cellular membrane potential and TEP), allowing the establishment of a microbioelectric route between the anatomically and functionally different FAE and villus epithelium. This not only favours the S. Typhimurium (green) to navigate to the FAE (curved green arrow) but also prevents the E. coli (red) from accidentally entering this ‘danger zone’ (curved red arrow). Inhibiting CFTR blocks Cl efflux (red cross) in the enteric epithelium near FAE, reducing or reversing ion flow in the FAE, resulting in increased E. coli recruitment (curved red dashed arrow) to the FAE or directing the S. Typhimurium (curved green dashed arrow) towards the adjacent villus epithelium. Source data
Extended Data Fig. 1
Extended Data Fig. 1. Defining spatial distributions of S. Typhimurium and E. coli between functionally different FAE and villus epithelium in an ex vivo mouse caecum model.
a, Representative images of the mucosal epithelium of a mouse caecum shows the organization of FAE and villi and accumulations of S. Typhimurium tagged with EGFP and E. coli tagged with dTomato. Pictures were taken at 30 min after incubation. Follicles are outlined in bright field image (yellow enclosures) and transferred to the green and red fluorescent images taken from the same field. Bar, 500 µm. b, Spatial profiles of the green vs red signals were calculated via line scan (thick yellow line) and plotted as normalized mean fluorescent intensities or green/red ratio crossing multiple FAEs. c, Ratio of mean green vs. red fluorescent intensities of the outlined FAEs (n = 3) were compared to that of matched villus regions (n = 3, yellow eclipses) and plotted as log10 (Mean ± SEM) in a bar chart. This figure is for demonstration purpose and is not subject to a statistical analysis. Source data
Extended Data Fig. 2
Extended Data Fig. 2. Ionic currents loop and contribute to the establishment of a lateral electrical field between functionally different FAE and villus epithelia.
a, Schematic depicting the organization of follicles and villi. Forks indicate the sites where the ionic currents were measured using vibrating probes. b, A typical current trace recorded at villus epithelium and c, A typical current trace recorded at FAE. These traces illustrate how an ionic current is measured and how the current polarities are defined. Maximal ionic currents were calculated based on a standard curve that was generated by passing specific currents in the same experimental setup for each probe. d, Consistency of the pooled measurements from different animals and different experiments (n = 13 and 22 mice respectively) including the ones we previously reported, showing that the ionic currents at FAE are exclusively outward and the ionic currents at villi are exclusively inward (p < 0.001 by unpaired, two-tailed Student’s t-test). Box tops indicate the 75th percentile, box bottoms indicate the 25th percentile, centre lines indicate median, and whiskers indicate maximum and minimum. e, A cartoon depicts ionic flow (purple arrows) and the establishment of a lateral electrical field between FAE and villus epithelia. Source data
Extended Data Fig. 3
Extended Data Fig. 3. Regional Vm patterns of mouse caecum epithelia.
a, A low-resolution image of villi away from Peyer’s patch, stained with membrane potential-sensitive probe DiBAC4(3). Bar, 5 mm. b, A close-up of the checked area in (a). Bar, 500 µm. c, A low-resolution image of a mouse caecal Peyer’s patch, stained with membrane potential-sensitive probe DiBAC4(3). Bar, 3 mm. d, A close-up of the checked area in (c) (also shown as in Fig. 3a). Bar, 500 µm.
Extended Data Fig. 4
Extended Data Fig. 4. Map of spatial TEP around rat ileal Peyer’s patches and surrounding villi.
a, A rat ileum under a dissecting microscope, showing a glass electrode approaching a follicle (white dashed enclosure) inside a Peyer’s patch. Bar, 1 mm. b, All TEP were negative to the lumen and spatially different as defined by the locations marked in (a). Each data point represents a single measurement of a representative rat sample (n = 7, 7, 5, 7, 7 respectively, from left to right). This panel is for demonstration and is not subject to a statistical analysis. c, TEPs in the villi are significantly larger than those in FAE (p = 0.011 by unpaired, two-tailed Student’s t-test). Each data point represents an average of 3 to 5 measurements of each rat sample (n = 6). d, The major villus away from FAE indicated as “av” in (a) and the interfollicular villus surrounding FAE indicated as “iv” in (a) have similar TEPs (p = 0.970 by unpaired, two-tailed Student’s t-test). Each data point represents an average of 3 to 5 measurements of each rat sample (n = 6). For panels (b), (c) and (d) box tops indicate the 75th percentile, box bottoms indicate the 25th percentile, centre lines indicate median, and whiskers indicate maximum and minimum. Source data
Extended Data Fig. 5
Extended Data Fig. 5. Electric currents remained constant during bacterial galvanotaxis.
a, A schematic of bacterial galvanotaxis setup. Actual voltage drop is measured across a 20 mm microfluidic chamber that is sealed with 2% agar. Channel height is about 120 µm. b, Representative currents in the circuit monitored by an ammeter in series in (a) during a five-minute experiment. Source data
Extended Data Fig. 6
Extended Data Fig. 6. Electrical field induces flagellar redistribution exclusively at the rear of the S. Typhimurium body at the anode side.
a, A fluorescence image showing flagella arranged in various directions in the absence of an electrical field (No EF). Scale bar, 10 µm. b, A fluorescence image demonstrating flagellar redistribution to the rear of the cell body on the anode side when an electrical field is present in the indicated orientation. Scale bar, 10 µm. c, A rose plot illustrating the random arrangement of flagella in the absence of an electrical field (No EF, n = 28 cells). The ring unit represents frequency (percentage). d, A rose plot revealing that an electrical field in the indicated orientation enforces flagella to redistribute at the rear of the cell body, facing the anode side at an angle less than 60 degrees (n = 32 cells). The ring unit represents frequency (percentage). e, Quantification of flagellar orientation as cosθ, where θ are the angles in (c) and (d). Negative values indicate orientation towards the anode (left), and positive values indicate orientation towards the cathode (right). Each circle represents an individual cell (n = 28 and 32 respectively). p < 0.001 by unpaired, two-tailed Student’s t-test. Box tops indicate the 75th percentile, box bottoms indicate the 25th percentile, center lines indicate the median, and whiskers indicate maximum and minimum values. Source data
Extended Data Fig. 7
Extended Data Fig. 7. B. subtilis do not undergo robust galvanotaxis in vitro.
a, Migration trajectories of B. subtilis over 6 seconds in the absence (No EF) or presence of an electrical field (2 V/cm) with the field polarity as shown. Red: to the right or cathode, black: to the left or anode. b, Quantification of directionality in cosθ. Each circle represents an individual cell (n = 50), p = 0.034 by unpaired, two-tailed Student’s t-test. c, Quantification of migration speed (µm s–1). Each circle represents an individual cell (n = 50), p = 0.839 by unpaired, two-tailed Student’s t-test. For panels (b) and (c) box tops indicate the 75th percentile, box bottoms indicate the 25th percentile, centre lines indicate median, and whiskers indicate maximum and minimum. Source data
Extended Data Fig. 8
Extended Data Fig. 8. Flagella-dependent targeting to FAE is chemotaxis-independent.
Mouse caeca were incubated with the indicated E. coli and/or S. Typhimurium strain or stain mixtures ex vivo, and epithelia (FAE or Villus) were collected by 2 mm biopsy punches 30 min after inoculation. a, Bars represent geometric means ± standard errors of the indicated bacterial c.f.u.s recovered from the FAEs in log10 (n = 4 mice in each condition). P values were calculated by unpaired, two-tailed Student’s t-test. b, Bars represent geometric means ± standard errors of the competitive index of the recovered bacteria from each epithelium (FAE or Villus) in log10 (n = 4 mice in each competition pair). p = 0.019 by unpaired, two-tailed Student’s t-test. Source data
Extended Data Fig. 9
Extended Data Fig. 9. Differential recruitment of latex beads and bacteria to FAE and villus epithelium.
a, A confocal microscopy image displaying the initial inoculum mixture containing E. coli K12 (red), S. Typhimurium 14028S (green), and latex bead (blue) at a 1:1:1 ratio (108 c.f.u.s ml−1 in mouse Ringer’s solution). b, Representative confocal microscopy image of mouse caecum epithelium 30 min post-incubation with the tagged bacteria and bead mixture. The white dashed line delineates the FAE from the surrounding villus epithelium (indicated by a white triangle). Scale bar, 200 µm. c, Enhanced contrast image of the blue fluorescence channel from (b), illustrating the homogeneous distribution of latex beads across both the FAE and adjacent villus epithelium, demarcated by a dashed line. Scale bar, 200 µm. d, Quantification of fluorescent bead fraction within the FAE and villus epithelium (% area). Analysis was based on observations from multiple FAEs and corresponding villus regions across two independent experiments (n = 4 mice). p = 0.551 by unpaired two-tailed Student’s t-test. e, Analysis of mean Blue (beads) vs. Red (E. coli) fluorescence intensity (B/R) ratios associated with the FAE and villus epithelium, presented in log10 scale. Calculations were derived from multiple FAEs and matched villus regions over two repeated experiments (n = 4 mice). p < 0.001 by unpaired, two-tailed Student’s t-test, indicating a significant difference in the distribution of E. coli K12 between the two epithelial types. For panels (d) and (e) box tops indicate the 75th percentile, box bottoms indicate the 25th percentile, centre lines indicate median, and whiskers indicate maximum and minimum. Source data
Extended Data Fig. 10
Extended Data Fig. 10. CFTR inhibition does not change S. Typhimurium and E. coli recruitment in villi away from FAE.
a, A representative confocal image shows E. coli (red) associating with villi and sparsely scatted S. Typhimurium (green). Bar, 500 µm. b, A representative confocal image displays a similar distribution pattern of E. coli (red) and S. Typhimurium (green) in the villus epithelium in the presence of CFTR inhibitor (CFTR (i)) compared to the absence of CFTR (CTRL) in (a). c, Quantification of mean Green/Red fluorescence intensity ratios associated with the vast villi away from FAE in the absence or presence of CFTR(i). Data in common logarithm were calculated from multiple regions of two repeated experiments in each condition (n = 4 mice). p = 0.066 by unpaired, two-tailed Student’s t-test. Box tops indicate the 75th percentile, box bottoms indicate the 25th percentile, centre lines indicate median, and whiskers indicate maximum and minimum. Source data

References

    1. Belkaid, Y. & Hand, T. W. Role of the microbiota in immunity and inflammation. Cell157, 121–141 (2014). - PMC - PubMed
    1. Crim, S. M. et al. Preliminary incidence and trends of infection with pathogens transmitted commonly through food – Foodborne Diseases Active Surveillance Network, 10 U.S. Sites, 2006–2014. Morb. Mortal. Wkly Rep.64, 495–499 (2015). - PMC - PubMed
    1. Centers for Disease Control and Prevention. Preliminary FoodNet Data on the incidence of infection with pathogens transmitted commonly through food–10 States, 2008. Morb. Mortal. Wkly Rep. 58, 333–337 (2009). - PubMed
    1. Lynch, M. F., Tauxe, R. V. & Hedberg, C. W. The growing burden of foodborne outbreaks due to contaminated fresh produce: risks and opportunities. Epidemiol. Infect.137, 307–315 (2009). - PubMed
    1. Galan, J. E. & Curtiss, R. 3rd Cloning and molecular characterization of genes whose products allow Salmonella typhimurium to penetrate tissue culture cells. Proc. Natl Acad. Sci. USA86, 6383–6387 (1989). - PMC - PubMed

MeSH terms

Substances