Randomized Controlled Trial
. 2024 Aug 20;14(1):19334.
doi: 10.1038/s41598-024-70083-5.

Concurrent tDCS-fMRI after stroke reveals link between attention network organization and motor improvement

Affiliations
Randomized Controlled Trial

Concurrent tDCS-fMRI after stroke reveals link between attention network organization and motor improvement

Claudia A Salazar et al. Sci Rep. .

Abstract

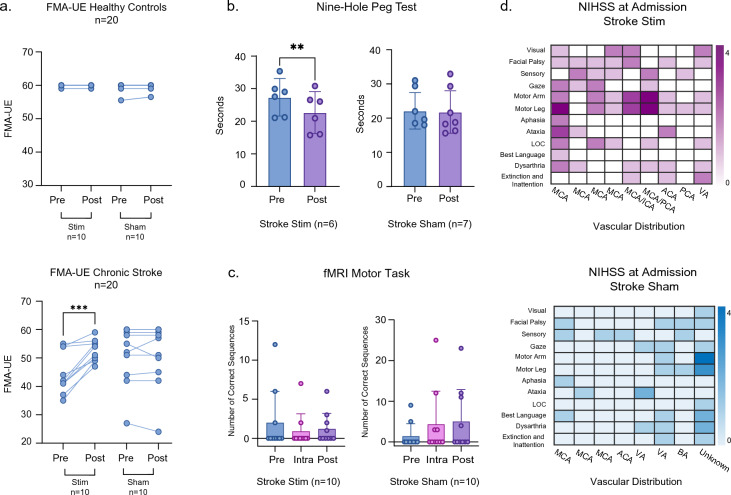
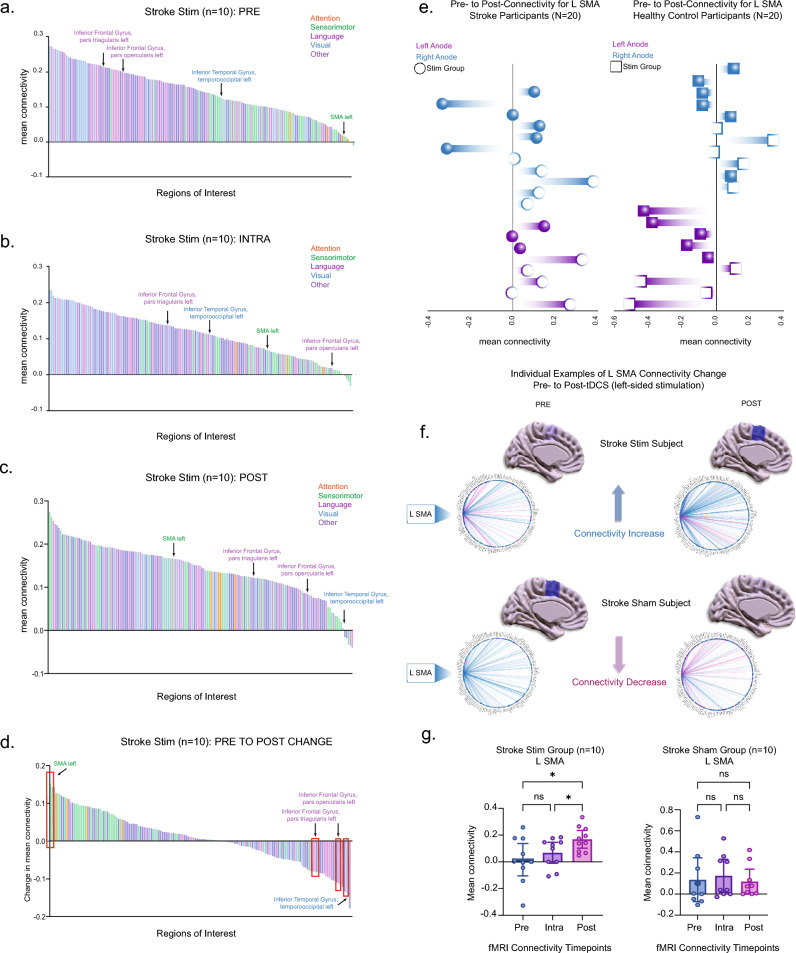
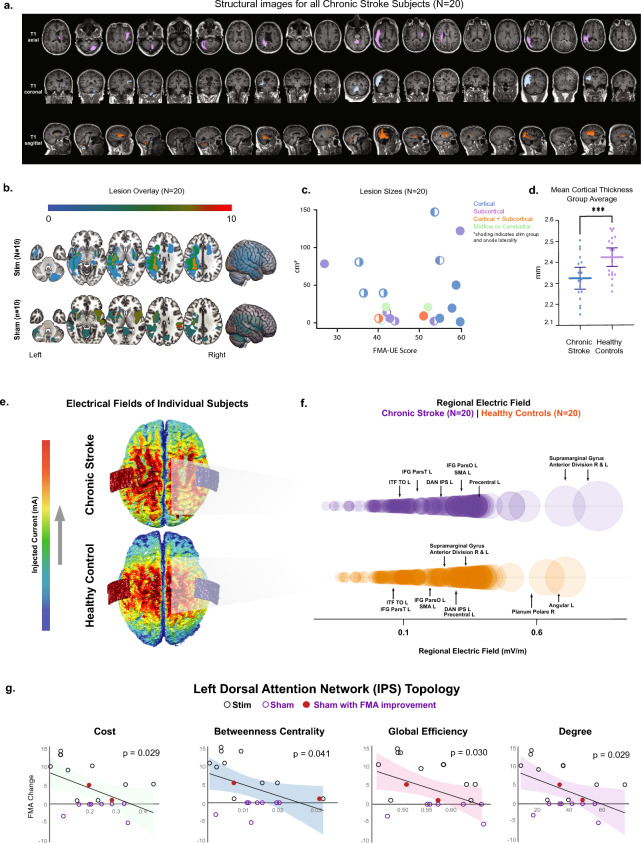
Restoring motor function after stroke necessitates involvement of numerous cognitive systems. However, the impact of damage to motor and cognitive network organization on recovery is not well understood. To discover correlates of successful recovery, we explored imaging characteristics in chronic stroke subjects by combining noninvasive brain stimulation and fMRI. Twenty stroke survivors (6 months or more after stroke) were randomly assigned to a single session of transcranial direct current stimulation (tDCS) or sham during image acquisition. Twenty healthy subjects were included as controls. tDCS was limited to 10 min at 2 mA to serve as a mode of network modulation rather than therapeutic delivery. Fugl-Meyer Assessments (FMA) revealed significant motor improvement in the chronic stroke group receiving active stimulation (p = 0.0005). Motor changes in this group were correlated in a data-driven fashion with imaging features, including functional connectivity (FC), surface-based morphometry, electric field modeling and network topology, focusing on relevant regions of interest. We observed stimulation-related changes in FC in supplementary motor (p = 0.0029), inferior frontal gyrus (p = 0.0058), and temporo-occipital (p = 0.0095) areas, though these were not directly related to motor improvement. The feature most strongly associated with FMA improvement in the chronic stroke cohort was graph topology of the dorsal attention network (DAN), one of the regions surveyed and one with direct connections to each of the areas with FC changes. Chronic stroke subjects with a greater degree of motor improvement had lower signal transmission cost through the DAN (p = 0.029). While the study was limited by a small stroke cohort with moderate severity and variable lesion location, these results nevertheless suggest a top-down role for higher order areas such as attention in helping to orchestrate the stroke recovery process.


Conflict of interest statement

The authors declare no competing interests.

Figures

Figure 1
Figure 1
(a) FMA-UE scores were collected for all subjects and analyzed based on their respective group assignments (HC stim = 10; HC sham = 10; chronic stroke stim = 10; chronic stroke sham = 10). The first column represents individual FMA-UE scores before and after stimulation. (b) Bar graphs represent the nine-hole peg test scores for the stroke stim (n = 6) and stroke sham (n = 7) groups. The graphs show individual values, mean, and 95% confidence intervals. Pre-stimulation (blue) and post-stimulation (purple) scores are shown. (c) All subjects completed a finger-tapping task while inside the MRI scanner. The plots represent the number of correct sequences achieved at each timepoint (pre, intra, post) and include 95% confidence intervals for chronic stroke stim (n = 10) and sham (n = 10) groups. (d) NIHSS scores are shown as a heat map for chronic stroke stim (magenta) and chronic stroke sham (blue). NIHSS domains are represented in the y axis and vascular distributions are shown along the x axis. Each vertical column represents one subject. Three subjects are not represented in the heat map (1 chronic stroke stim, 2 chronic stroke sham) due to inaccessible NIHSS scores. ACA anterior cerebral artery, BA basilar artery, ICA internal carotid artery, LOC loss of consciousness, MCA middle cerebral artery, PCA posterior cerebral artery, VA vertebral artery.
Figure 2
Figure 2
(ad) Averaged connectivity for 164 brain atlas regions in the stroke stim group (n = 10) are arranged in descending order. Each bar represents one region of the atlas (error bars removed for clarity). Each region is color-coded to the following functions: attention (orange), sensorimotor (green), language (magenta), visual (blue), and other (purple). These depict averaged values at the (a) pre-stimulation, (b) intra-stimulation, and (c) post-stimulation timepoints. (d) The difference in mean connectivity from pre- to post-stimulation for the stroke stim group (n = 10) is illustrated, with L SMA displaying the highest positive change in connectivity. Red boxes indicate four areas with statistically significant change with stimulation. (e) Subjects with a right-sided anode are represented in blue, while those with left-sided anode are shown in purple. The left column corresponds to the stroke group (N = 20) and the right column to the healthy control group (N = 20). Filled-in shapes denote subjects in the sham group. The x-axis displays the mean connectivity for the L SMA, ranging from positive to negative values. (f) Sagittal brain slices and connectomes illustrate L SMA connectivity changes from pre- to post-stimulation in two individual subjects. The top example represents a subject from the stroke stim group, while the bottom depicts a subject from the stroke sham group. Darker blue signifies higher connectivity, while a more translucent blue indicates lower connectivity. (g) The mean connectivity of the L SMA to all other 163 regions of interest were computed and compared between the pre-, intra-, and post-stimulation phases (see Supplementary Table 2 for all 4 areas with significant changes).
Figure 3
Figure 3
(a) Each stroke subject’s T1-weighted scan is shown in axial, coronal, and sagittal orientations in order of randomization and the lesion color coded by a board-certified neuroradiologist. (b) Lesion overlays for the stroke stim and stroke sham groups are represented. (c) Lesion sizes for each individual stroke subject are shown as a function of FMA-UE score. The color of the data points corresponds to the stroke location: cortical, subcortical, cortical and subcortical, and midline or cerebellar stroke. Solid data points represent sham group subjects, while data points that are partially filled denote the stimulation group. The filled portion of these symbols reflects anode placement laterality. (d) A comparison of mean whole-brain cortical thickness revealed a statistically significant difference between chronic stroke subjects and healthy controls. (e) Models illustrating the dispersion of the electric field are shown for one stroke subject (top) and one healthy control (bottom) with roughly equal current densities. (f) Atlas-based electric fields (EF) were calculated for each subject. Average EF (y-axis) is shown as a function of circle diameter for chronic stroke (purple) and healthy control (orange) subjects. (g) Displays linear regression results correlating the pre-stimulation graph theory metrics for the left Dorsal Attention Network's (DAN) Intraparietal Sulcus (IPS) with changes in the Fugl-Meyer Assessment Upper Extremity (FMA-UE) scores for both the stroke stimulation and sham groups. Graph theory metrics examined are illustrated below the regressions, including degree, betweenness centrality, global efficiency, and cost, with lines denoting edges and spheres as nodes. P-values are fdr-corrected.

References

    1. McDonald, M. W. et al. Cognition in stroke rehabilitation and recovery research: Consensus-based core recommendations from the second Stroke Recovery and Rehabilitation Roundtable. Int. J. Stroke14, 774–782 (2019). 10.1177/1747493019873600 - DOI - PubMed
    1. Barrett, A. M. & Muzaffar, T. Spatial cognitive rehabilitation and motor recovery after stroke. Curr. Opin. Neurol.27, 653–658 (2014). 10.1097/WCO.0000000000000148 - DOI - PMC - PubMed
    1. VanGilder, J. L., Hooyman, A., Peterson, D. S. & Schaefer, S. Y. Post-stroke cognitive impairments and responsiveness to motor rehabilitation: A review. Curr. Phys. Med. Rehabil. Rep.8, 461–468 (2020). 10.1007/s40141-020-00283-3 - DOI - PMC - PubMed
    1. Anderlini, D., Wallis, G. & Marinovic, W. Language as a predictor of motor recovery: The case for a more global approach to stroke rehabilitation. Neurorehabil. Neural Repair33, 167–178 (2019). 10.1177/1545968319829454 - DOI - PubMed
    1. Joy, M. T. & Carmichael, S. T. Encouraging an excitable brain state: Mechanisms of brain repair in stroke. Nat. Rev. Neurosci.22, 38–53 (2021). 10.1038/s41583-020-00396-7 - DOI - PMC - PubMed

Publication types

MeSH terms