. 2024 Sep;25(9):1742-1753.
doi: 10.1038/s41590-024-01926-6. Epub 2024 Aug 20.

Influenza vaccination stimulates maturation of the human T follicular helper cell response

Affiliations

Influenza vaccination stimulates maturation of the human T follicular helper cell response

Stefan A Schattgen et al. Nat Immunol. 2024 Sep.

Abstract

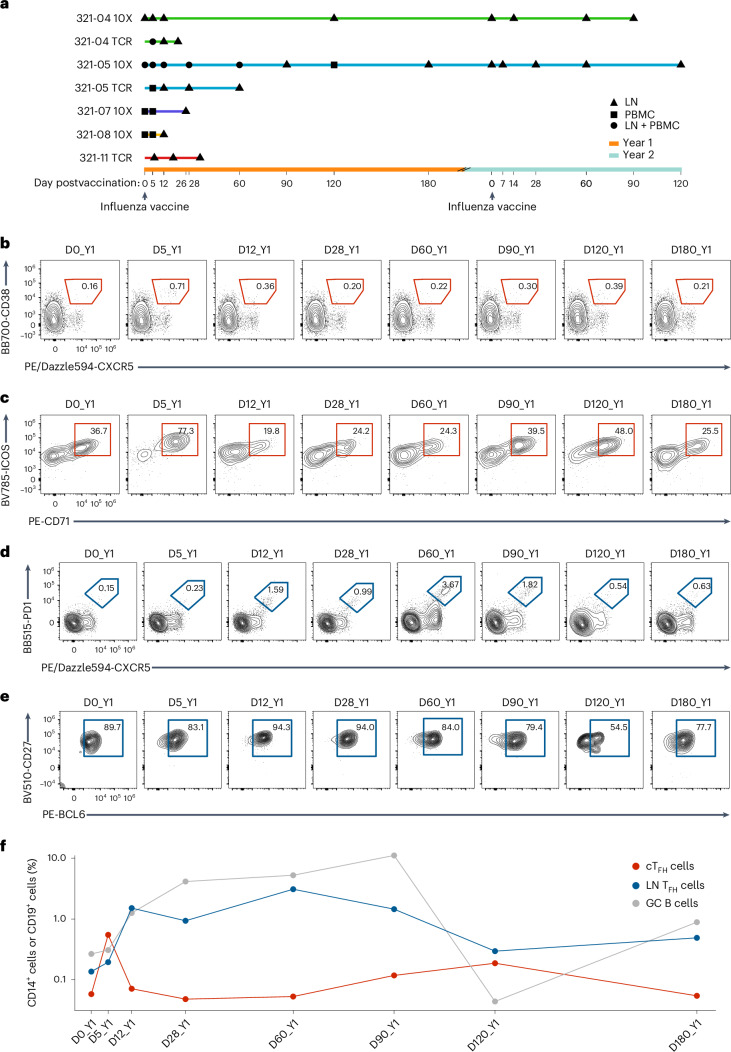
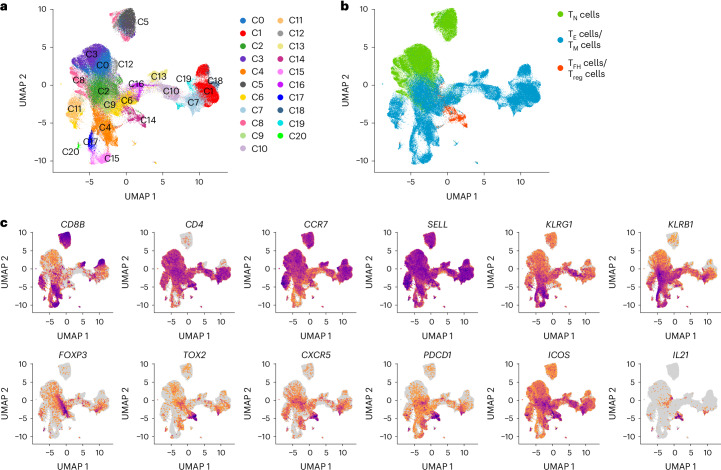
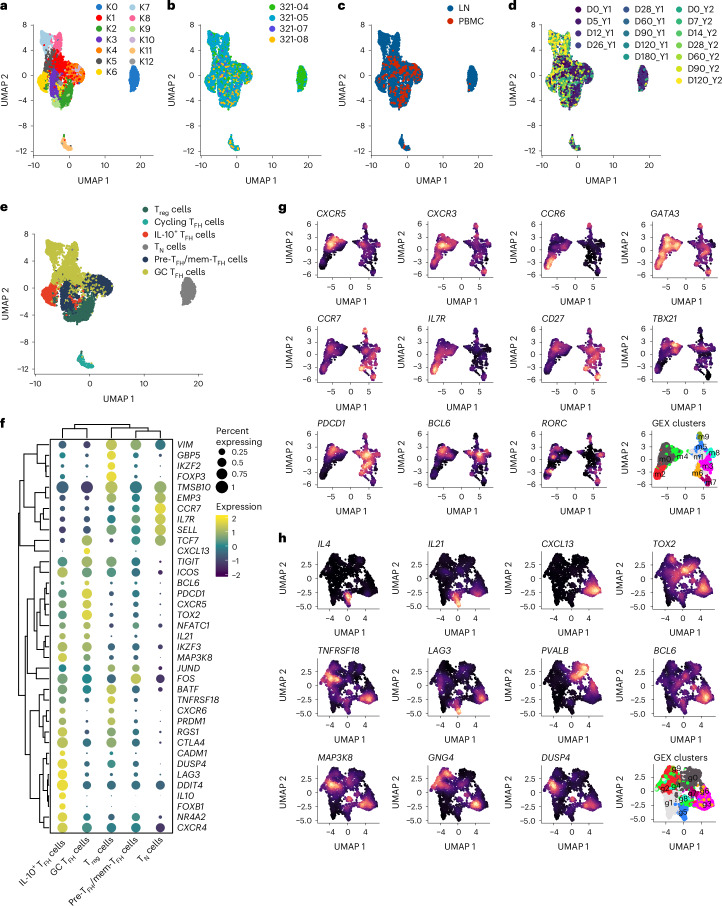
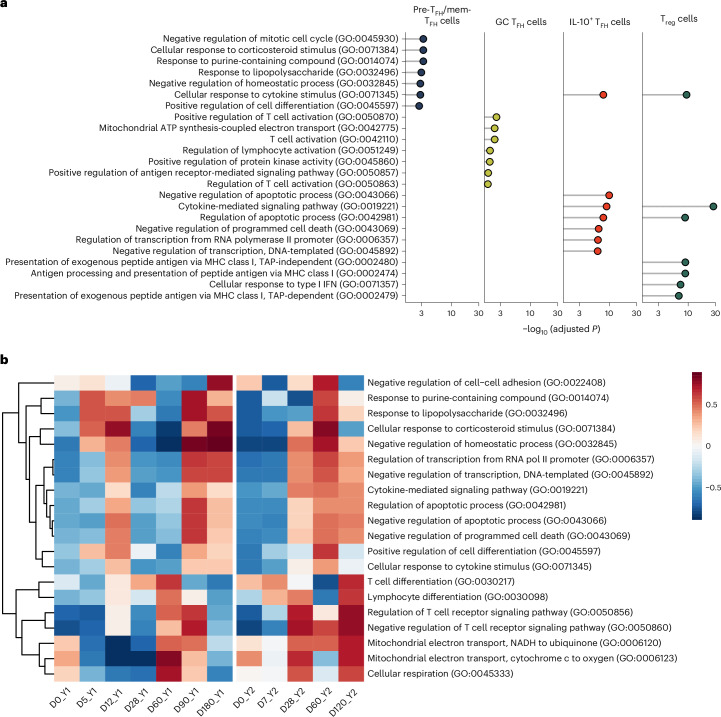
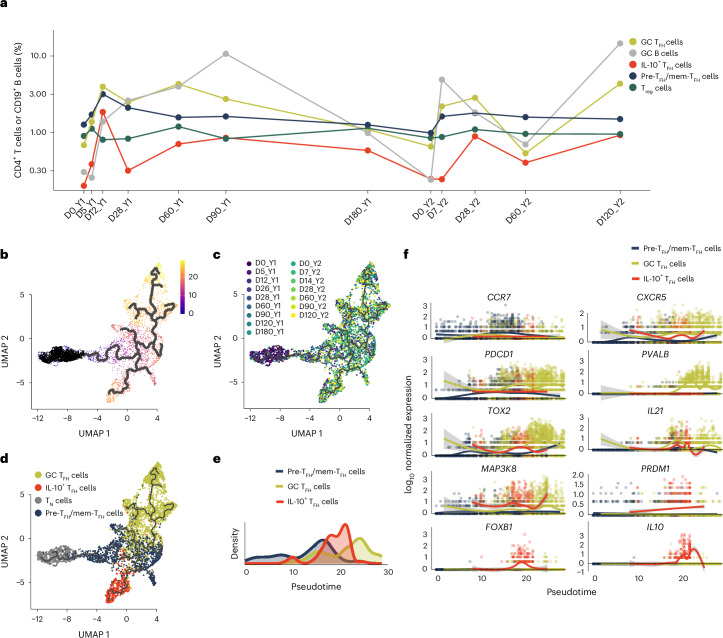
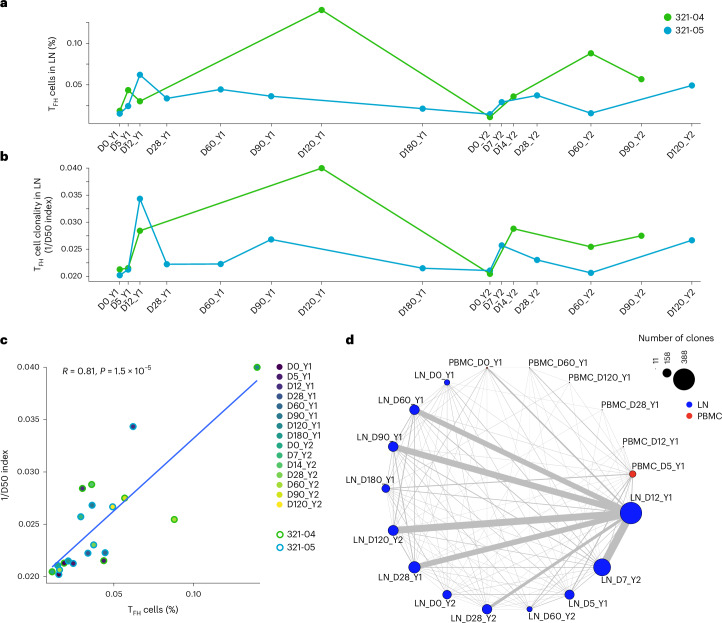
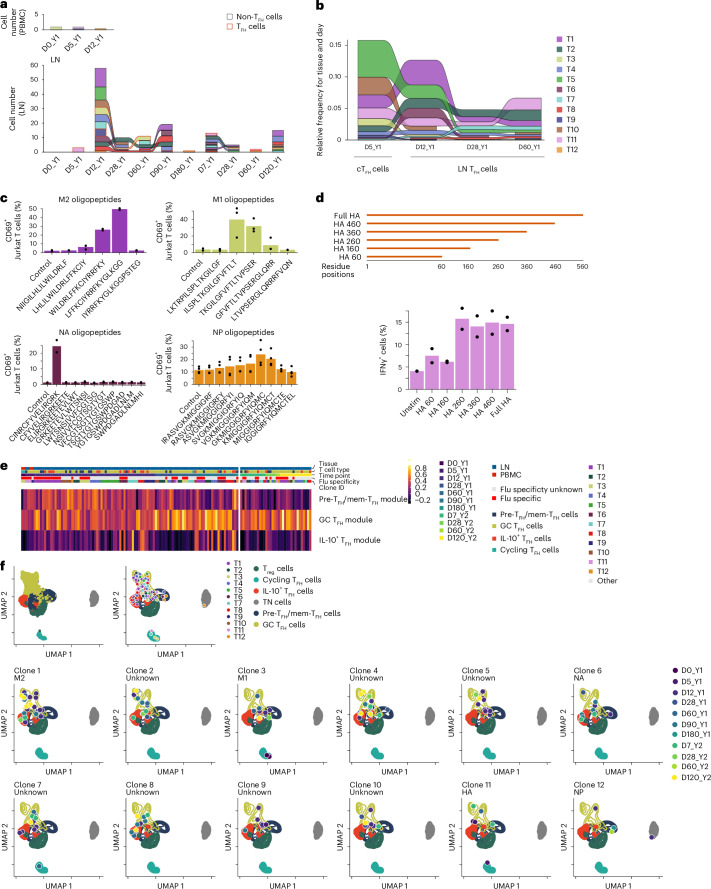
The differentiation and specificity of human CD4+ T follicular helper cells (TFH cells) after influenza vaccination have been poorly defined. Here we profiled blood and draining lymph node (LN) samples from human volunteers for over 2 years after two influenza vaccines were administered 1 year apart to define the evolution of the CD4+ TFH cell response. The first vaccination induced an increase in the frequency of circulating TFH (cTFH) and LN TFH cells at week 1 postvaccination. This increase was transient for cTFH cells, whereas the LN TFH cells further expanded during week 2 and remained elevated in frequency for at least 3 months. We observed several distinct subsets of TFH cells in the LN, including pre-TFH cells, memory TFH cells, germinal center (GC) TFH cells and interleukin-10+ TFH cell subsets beginning at baseline and at all time points postvaccination. The shift toward a GC TFH cell phenotype occurred with faster kinetics after the second vaccine compared to the first vaccine. We identified several influenza-specific TFH cell clonal lineages, including multiple responses targeting internal influenza virus proteins, and found that each TFH cell state was attainable within a clonal lineage. Thus, human TFH cells form a durable and dynamic multitissue network.


Conflict of interest statement

A.H.E. is a consultant for InBios and Fimbrion Therapeutics. The Ellebedy Laboratory received funding under sponsored research agreements from Emergent BioSolutions. P.G.T. has consulted and/or received honoraria and travel support from Pfizer, Merck, Illumina, Johnson and Johnson and 10x Genomics, and serves on the Scientific Advisory Board of Immunoscape, Shennon Bio and Cytoagents. The authors have applied for patents covering some aspects of these studies. All other authors declare no competing interests.

Figures

Fig. 1
Fig. 1. Influenza vaccination stimulates a CD4+ TFH cell response in blood and LN of humans.
a, Schematic representation indicating the time points of PBMC (D0_Y1, D5_Y1, D12_Y1, D28_Y1, D60_Y1 and D120_Y1) and LN (D0_Y1, D5_Y1, D12_Y1, D26_Y1, D28_Y1, D60_Y1, D90_Y1, D120_Y1, D180_Y1, D0_Y2, D7_Y2, D14_Y2, D28_Y2, D60_Y2, D90_Y2 and D120_Y2) samples in five donors (321-04, 321-05, 321-07, 321-08 and 321-11) postvaccination with Flucelvax QIV on D0_Y1 (2018–2019 season) and D0_Y2 (2019–2020 season) 1 year apart. b, Representative flow cytometry plots of circulating CXCR5+CD38+ TFH cells (cTFH cells) in PBMCs from donor 321-05 at D0_Y1, D5_Y1, D12_Y1, D28_Y1, D60_Y1, D90_Y1, D120_Y1 and D180_Y1, gated on CD45+CD14CD19CD3+CD4+ cells. c, Frequency of ICOS+CD71+ cTFH cells in PBMCs from donor 321-05 at D0_Y1, D5_Y1, D12_Y1, D28_Y1, D60_Y1, D90_Y1, D120_Y1 and D180_Y1, gated on CXCR5+CD38+ TFH cells as in b. d, Representative flow cytometry plots of CXCR5+PD-1+ LN TFH cells in donor 321-05 at D0_Y1, D5_Y1, D12_Y1, D28_Y1, D60_Y1, D90_Y1, D120_Y1 and D180_Y1, gated on CD14CD19CD4+ T cells. e, Frequency of CD27+BCL6+ LN TFH cells in 321-05 at D0_Y1, D5_Y1, D12_Y1, D28_Y1, D60_Y1, D90_Y1, D120_Y1 and D180_Y1, gated on CXCR5+PD-1+ TFH cells as in d. f, Frequency of cTFH, LN TFH and CD19+IgDloCD20hiCD38int LN GC B cells in 321-05 at D0_Y1, D5_Y1, D12_Y1, D28_Y1, D60_Y1, D90_Y1, D120_Y1 and D180_Y1. Shown as a percent of total CD4+ T cells or CD19+ B cells on log10 scale.
Fig. 2
Fig. 2. scGEX and TCR profiling capture diverse T cell phenotypes in blood and LN after influenza vaccination.
a, UMAP projection of the total T cell dataset generated from the PBMC (at D0_Y1, D5_Y1, D12_Y1, D28_Y1, D60_Y1 and D120_Y1) and LN (at D0_Y1, D5_Y1, D12_Y1, D26_Y1, D28_Y1, D60_Y1, D90_Y1, D120_Y1, D180_Y1, D0_Y2, D7_Y2, D14_Y2, D28_Y2, D60_Y2, D90_Y2 and D120_Y2) samples from donors 321-04, 321-05, 321-07 and 321-08 annotated by GEX cluster (n = 154,109 cells with 127,329 unique TCR clonotypes). b, UMAP projection of the total T cell dataset annotated by T cell phenotype as CCR7hiSELLhi TN, CCR7loSELLloKLRG1+ TE cells or TM cells or PDCD1+CXCR5+ TFH or FOXP3+ Treg cells. c, Feature plots displaying distinguishing T cell markers in the total T cell dataset.
Fig. 3
Fig. 3. Influenza vaccination stimulates the differentiation of distinct TFH cell subsets.
ad, UMAP projections of the TFH/Treg subset annotated by scGEX cluster (a), donor (b), tissue (c) and time postimmunization (d) in a subset of the total T cell dataset in Fig. 2 that contained all cells clonally related to those in the TFH/Treg cell cluster C14 from the PBMC and LN of all donors (n = 6,109 cells with 4,418 unique TCR clonotypes). e, UMAP projection of the TFH/Treg subset annotated as CCR7loCXCR5loPDCD1loICOS+ pre-TFH/mem-TFH cells, CCR7CXCR5hiPDCD1hiICOS+ GC TFH cells, CCR7CXCR5hiPDCD1hiICOS+LAG3+ IL-10+ TFH cells, FOXP3+ Treg cells, MKI67+ cycling cells or CCR7+CD4+ TN cells. f, Dot plot of select TFH cell and Treg cell subset-specific markers in TFH/Treg subset grouped by each subset (excluding cycling) defined in e. g,h, Reclustering and feature plots of CCR7loCXCR5loPDCD1loICOS+ pre-TFH/mem-TFH cells (g) and CCR7CXCR5hiPDCD1hiICOS+ GC TFH cells (h) displaying marker genes associated with scGEX clusters within the pre-TFH/mem-TFH and GC TFH cells.
Fig. 4
Fig. 4. Influenza vaccination alters TFH cell metabolism and signaling with time.
a, Enrichr analysis showing enriched GO biological processes in using LN pre-TFH/mem-TFH, IL-10+ TFH, GC TFH and Treg cells from the TFH/Treg subset from donors 321-04 and 321-05 at time points D0_Y1, D5_Y1, D12_Y1, D28_Y1, D60_Y1, D90_Y1, D120_Y1, D180_Y1, D0_Y2, D7_Y2, D14_Y2, D28_Y2, D60_Y2, D90_Y2 and D120_Y2. Marker DEGs for the four subsets were redefined by comparing them against the global background of subsetted LN pre-TFH/mem-TFH, GC TFH, IL-10+ TFH and Treg cells included in the analysis. b, GSVA across D0_Y1, D5_Y1, D12_Y1, D28_Y1, D60_Y1, D90_Y1, D180_Y1, D0_Y2, D7_Y2, D28_Y2, D60_Y2 and D120_Y2 in LN TFH cells from donor 321-05 (excluding Treg cells) for top TFH cell-specific GO terms for a.
Fig. 5
Fig. 5. Influenza vaccination elicits dynamic alterations in TFH cell composition.
a, Relative frequency of LN GC TFH cell, GC B cells, IL-10+ TFH cells, pre-TFH/mem-TFH cell and Treg cell subsets in donor 321-05 at time points D0_Y1, D5_Y1, D12_Y1, D28_Y1, D60_Y1, D90_Y1, D180_Y1, D0_Y2, D7_Y2, D28_Y2, D60_Y2 and D120_Y2. bd, UMAP projections of LN pre-TFH/mem-TFH, GC TFH, IL-10+ TFH and CD4+ TN cells from all donors at D0_Y1, D5_Y1, D12_Y1, D26_Y1, D28_Y1, D60_Y1, D90_Y1, D120_Y1, D180_Y1, D0_Y2, D7_Y2, D14_Y2, D28_Y2, D60_Y2, D90_Y2 and D120_Y2 subsetted from the TFH/Treg subset, reclustered and subjected to pseudotime analysis showing calculated pseudotime values with selected root nodes where pseudotime scale was set to zero are indicated by black points on the left side of the projection (b), time points (c) or TFH cell subset (d). n = 4,418 cells. e, Density plots of pseudotime value distributions by TFH cell subset in the division of the TFH/Treg subset defined in b. f, Scatter plot of log10 normalized expression of indicated TFH cell subset marker genes versus pseudotime values per cell in the division of the TFH/Treg subset defined in b. Each dot represents a cell, and the color indicates its assigned TFH cell subset.
Fig. 6
Fig. 6. Influenza vaccination leads to TFH cell clonal expansion.
a, Relative frequency of all subsets of TFH cells in LN (TFH/Treg subset excluding Treg and TN cells) from donors 321-04 and 321-05 over D0_Y1, D5_Y1, D12_Y1, D28_Y1, D60_Y1, D90_Y1, D120_Y1, D180_Y1, D0_Y2, D7_Y2, D14_Y2, D28_Y2, D60_Y2, D90_Y2 and D120_Y2 time points. b, TCR clonality of all subsets of TFH cells in LN (TFH/Treg subset excluding Treg and TN cells) from donors 321-04 and 321-05 over D0_Y1, D5_Y1, D12_Y1, D28_Y1, D60_Y1, D90_Y1, D120_Y1, D180_Y1, D0_Y2, D7_Y2, D14_Y2, D28_Y2, D60_Y2, D90_Y2 and D120_Y2 time points by inverse D50 index. c, Scatter plot comparing the relative frequency and clonality from a and b (n = 20). Correlation analyses were performed using the Pearson correlation metric, and P values were computed using two-sided t test. d, Network graph depicting the connection between TFH cell clonal lineages in PBMCs and LN in donor 321-05 at D0_Y1, D5_Y1, D12_Y1, D28_Y1, D60_Y1, D90_Y1, D180_Y1, D0_Y2, D7_Y2, D28_Y2, D60_Y2 and D120_Y2 time points. Node sizes correspond to the number of unique clones, and edge widths correspond to the number of clones connecting each node.
Fig. 7
Fig. 7. Vaccination evokes maturation of influenza-specific TFH cell clonal lineages.
a, Number of cells detected in PBMCs (top) and LN (bottom) for TFH cell clonal lineages T1–T12 in donor 321-05 at D0_Y1, D5_Y1, D12_Y1, D28_Y1, D60_Y1, D90_Y1, D180_Y1, D0_Y2, D7_Y2, D28_Y2, D60_Y2 and D120_Y2. b, Relative abundance of TFH cell clonal lineages T1–T12 in bulk TCRβ sequencing of sorted cTFH cells and LN TFH cells from donor 321-05 at D5_Y1, D12_Y1, D28_Y1 and D60_Y1. c, Frequency of CD69+ cells in T1, T3 and T12 cell lines after 24 h of coculture with aAPCs expressing HLA-DR3*03:01, HLA-DPA1*01:03/DPB1*13:01 or HLA-DR5*01:01 pulsed with peptides derived from influenza M2, M1, NA or NP, and in the T6 cell line after 24 h of coculture with B cells expressing HLA-DPA1*01:03/DPB1*04:02 pulsed with NA peptides. DMSO alone was used as a control (n = 2–4 technical replicates per condition). Representative of two experiments. d, Frequency of IFNγ+ T11 Jurkat T cell line after 24 h coculture with aAPCs transfected with plasmids containing full HA protein, residues 1–460 (HA 460), 1–360 (HA 360), 1–260 (HA 260), 1–160 (HA 160) or the empty vector control (unstim; n = 2 technical replicates per condition). Representative of n = 2 experiments. e, Heatmap of pre-TFH/mem-TFH, GC TFH and IL-10+ TFH cells gene set module scores for TFH cell clonal lineages T1–T12 from donor 321-05 across time points in a. f, UMAP projection showing the localization of all cells encompassed by TFH cell clonal lineages T1–T12 assessed in donor 321-05 across time points from within the embedding from Fig. 2e. Source data
Extended Data Fig. 1
Extended Data Fig. 1. TFH flow gating strategy and donor 321-04 LN TFH and cTFH frequencies.
a,b, Gating strategies for defining activated cTFH cells (CXCR5+CD38+ICOS+CD71+; a) and LN GC TFH cells (CXCR5+PD1+BCL-6+; b). c, Frequency of CXCR5+CD38+ cTFH in PBMCs for donor 321-04 in year 1 determined using flow cytometry. Shown as percent of total CD4+ T cells. d, Frequency of CXCR5+PD-1+BCL-6+ GC TFH and IgDloCD20hiCD38int GC B cell in LN biopsies taken from donor 321-04 in year 1 determined using flow cytometry. Shown as percent of total CD4+ T cells or total CD19+ B cells.
Extended Data Fig. 2
Extended Data Fig. 2. Single-cell gene expression and TCR profiling capture diverse T cell phenotypes in blood and LN after influenza vaccination.
a, Dot plot showing the expressions of marker genes for each gene expression cluster of the total T cell dataset generated from the PBMC (at D0_Y1, D5_Y1, D12_Y1, D28_Y1, D60_Y1 and D120_Y1) and LN (at D0_Y1, D5_Y1, D12_Y1, D26_Y1, D28_Y1, D60_Y1, D90_Y1, D120_Y1, D180_Y1, D0_Y2, D7_Y2, D14_Y2, D28_Y2, D60_Y2, D90_Y2 and D120_Y2) samples from donors 321-04, 321-05, 321-07 and 321-08 annotated by GEX cluster. n = 154,109 cells with 127,329 unique TCR clonotypes. b, Frequency of cells by donor within each gene expression cluster. c, 2D UMAP projection of the total T cell dataset colored by log10(1 + n) transformed clone sizes. d, Distribution of log10(1 + n) transformed clone sizes across GEX clusters. e, Frequency of cells by donor within each gene expression cluster.
Extended Data Fig. 3
Extended Data Fig. 3. B cell subset frequency correlation and marker genes for TFH/Treg subset.
a, Heatmap of Pearson correlation between frequency of LN TFH (all TFH subsets) and naive, resting memory, activated, GC and plasmablast (PB) B cell subsets in the lymph node. b, Scatter plot comparing the relative frequencies of germinal center B cells versus TFH cells in LN samples. Correlation analyses were performed using the Pearson correlation metric and P values were computed using two-sided t-tests. c, Heatmap of the top marker genes for each GEX cluster for the TFH clonal lineages subset. d, Volcano plot of DEGs between indicated TFH subset, Treg cells and TN cells. e, Violin plots of mouse full TFH module score as defined in ref. in human TFH cells from this study grouped by subset.
Extended Data Fig. 4
Extended Data Fig. 4. Influenza-vaccination stimulated alterations in TFH metabolism and signaling in donor 321-04.
GSVA of donor 321-05 LN TFH cells with respect to time for TFH-specific upregulated GO terms.
Extended Data Fig. 5
Extended Data Fig. 5. Influenza-vaccination induced changes to TFH composition and phenotypes over time in donor 321-04.
a, Relative frequencies of pre/memory, GC and IL-10+ TFH subsets in LN samples from donor 321-04 over time. b, Volcano plots showing DEGs within LN GC TFH cells (all subsets) from donor 321-05 across matched time points (or all time points) after vaccination for years 1 and 2. D5_Y1 vs D7_Y2 (top), D28_Y1 vs D28_Y2 (middle) and year 1 vs year 2 (bottom). c, Heatmap of scaled GEX in LN GC TFH cells from donor 321-05 at indicated time points. Genes shown are the top 10 marker genes for each time point from b. d, Violin plots showing expressions of IL21, CXCL13 and CXCR5 in LN GC TFH cells for donors 321-04 (top) and 321-05 (bottom) at time points D0_Y1, D5_Y1, D12_Y1, D28_Y1, D60_Y1, D90_Y1, D120_Y1, D180_Y1, D0_Y2, D7_Y2, D14_Y2, D28_Y2, D60_Y2, D90_Y2 and D120_Y2. e, Comparison of somatic hypermutation frequency of QIV-specific antibody lineages to LN GC TFH frequency after year 1 vaccination. The box-and-whisker plots show the distribution of SHM frequency for the QIV-specific antibody lineage with the number indicating the median value for the time point. The red point indicates the frequency of GC TFH within CD4+ T cells of the LN for the time point. Donors 321-04 and 321-05 are shown in the top and bottom panels, respectively.
Extended Data Fig. 6
Extended Data Fig. 6. Bulk and single-cell TCR repertoire profiling of cTFH and LN TFH cells after influenza vaccination.
ac, Network graph depicting the connections between TFH clonal lineages in PBMCs and LN for donors: 321-04 (a), 321-08 (b) and 321-07 (c) at D0_Y1, D5_Y1, D12_Y1, D120_Y1, D0_Y2, D14_Y2, D60_Y2 and D90_Y2 time points. Node sizes correspond to the number of unique clones, and edge widths correspond to the number of clones connecting each node. d, 2D UMAP projection of total T cell dataset highlighting cells with matching paired TCR sequences to TCR data generated by scPCR of individually sorted CXCR5+CD38+ cTFH and CXCR5+PD-1+ LN TFH cells for donors 321-04 and 321-05. e, Frequency cells within each GEX cluster matching to TCRα or TCRβ sequences in the bulk TCR repertoire sequencing from bulk-sorted CXCR5+CD38+ cTFH and CXCR5+PD-1+ LN TFH cells for donors 321-04 and 321-05. TCRs were sequenced from the following combinations of donor, time point and tissue: donor 321-05: D12_Y1, D28_Y1, D60_Y1 in LN and D5_Y1 PBMCs; donor 321-04: D5_Y1 and D12_Y1 in LN and D5_Y1 PBMCs; donor 321-11: D6_Y1, D18_Y1, D21_Y1, D35_Y1 in LN. f, Morisita–Horn index of overlapping clonotypes for TCRα (left) and TCRβ (right) in bulk TCR sequencing from e.
Extended Data Fig. 7
Extended Data Fig. 7. Identification and profiling of influenza-specific TFH clonotypes in donor 321-05.
a, Gating strategy for assessing Jurkat TFH TCR cell line activation in co-culture experiments. b, Frequency of CD69+ Jurkat T cells expressing TCRs T1, T3 and T12 after co-culture with aAPCs infected with influenza PR8 for 24 hours. c, Frequency of CD69+ T1, T3 and T12 Jurkat T cell lines after co-culture with aAPCs transfected with plasmids expressing individual segments of the IAV genome compared to empty vector control for 24 hours. d, Frequency of CD69+ Jurkat T cells expressing TCRs T4, T6, T7, T9 and T10 after co-culture for 24 hours with partially HLA-matched B cells pulsed with influenza protein peptide pools. e, Frequency of CD69+ in T6 Jurkat cells stimulated as in d in the presence of antibodies blocking specific MHC class II molecules. f, Frequency of CD69+ T11 cell line co-culture with aAPCs pulsed with recombinant HA protein, PMA/ionomycin or DMSO control for 24 hours. g, PC1 scores of individual cells from the picked TFH lineages with respect to time. h, Heatmap showing the expressions of genes corresponding to the head and tail PC1 loadings in the twelve TFH clonal lineages.

Update of

References

    1. Crotty, S. T follicular helper cell differentiation, function, and roles in disease. Immunity41, 529–542 (2014). 10.1016/j.immuni.2014.10.004 - DOI - PMC - PubMed
    1. Chevalier, N. et al. CXCR5 expressing human central memory CD4 T cells and their relevance for humoral immune responses. J. Immunol.186, 5556–5568 (2011). 10.4049/jimmunol.1002828 - DOI - PubMed
    1. He, J. et al. Circulating precursor CCR7(lo)PD-1(hi) CXCR5+ CD4+ T cells indicate TFH cell activity and promote antibody responses upon antigen reexposure. Immunity39, 770–781 (2013). 10.1016/j.immuni.2013.09.007 - DOI - PubMed
    1. Herati, R. S. et al. Circulating CXCR5+PD-1+ response predicts influenza vaccine antibody responses in young adults but not elderly adults. J. Immunol.193, 3528–3537 (2014). 10.4049/jimmunol.1302503 - DOI - PMC - PubMed
    1. Mettelman, R. C. et al. Baseline innate and T cell populations are correlates of protection against symptomatic influenza virus infection independent of serology. Nat. Immunol.24, 1511–1526 (2023). 10.1038/s41590-023-01590-2 - DOI - PMC - PubMed