. 2024 Oct;26(10):1790-1803.
doi: 10.1038/s41556-024-01487-8. Epub 2024 Aug 20.

Retinoic acid induces human gastruloids with posterior embryo-like structures

Affiliations

Retinoic acid induces human gastruloids with posterior embryo-like structures

Nobuhiko Hamazaki et al. Nat Cell Biol. 2024 Oct.

Abstract

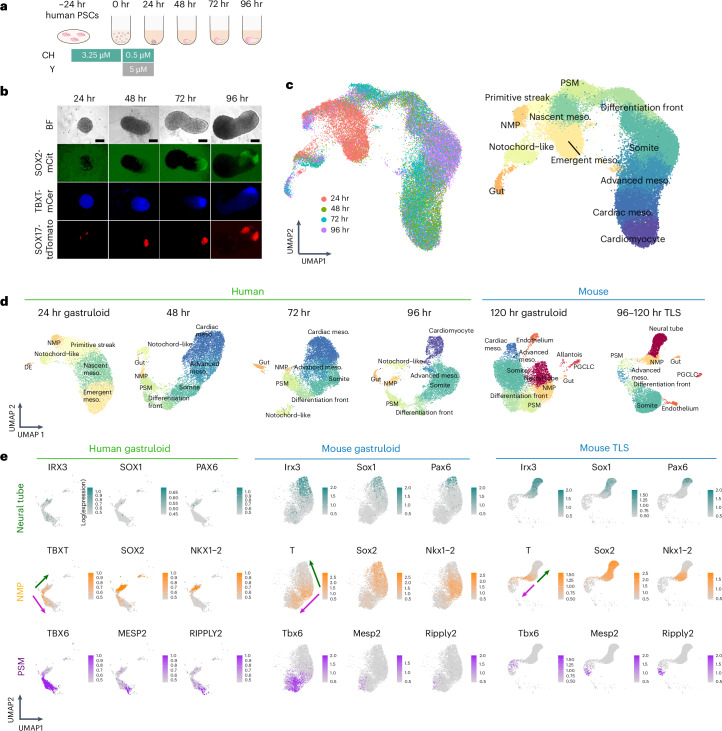
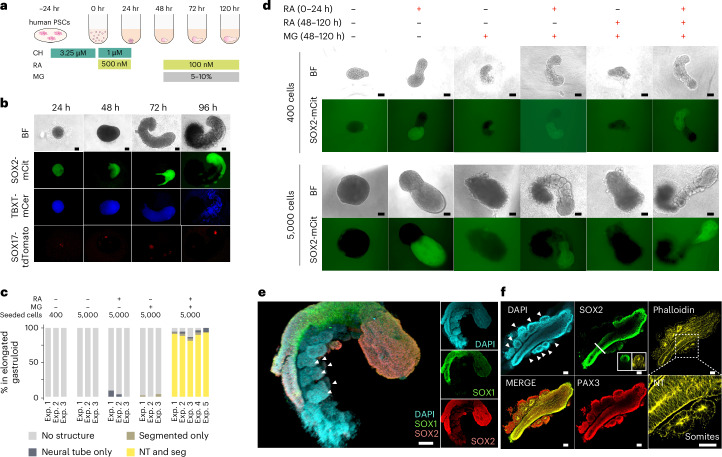
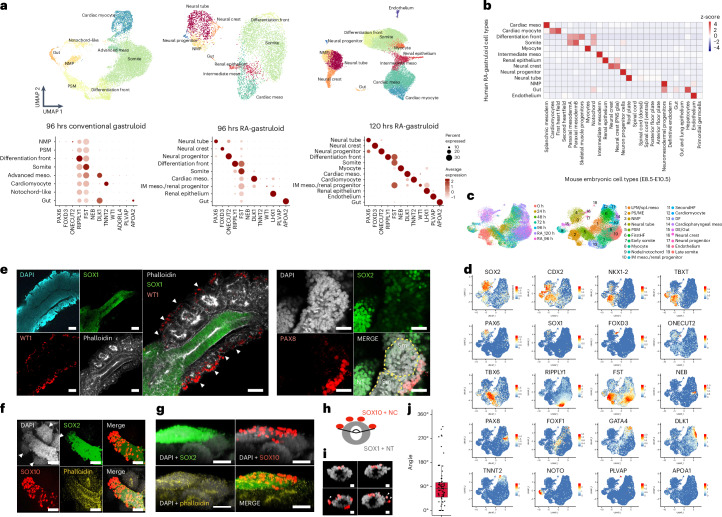
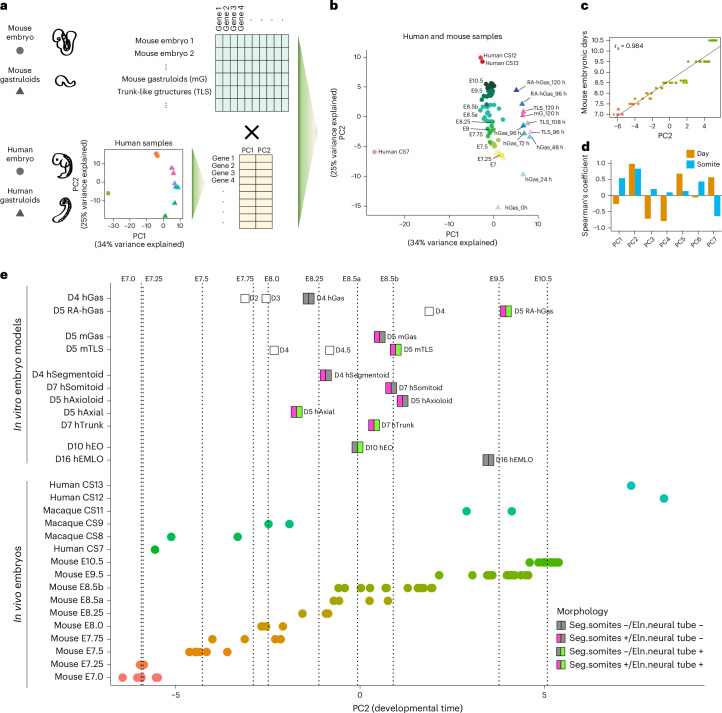
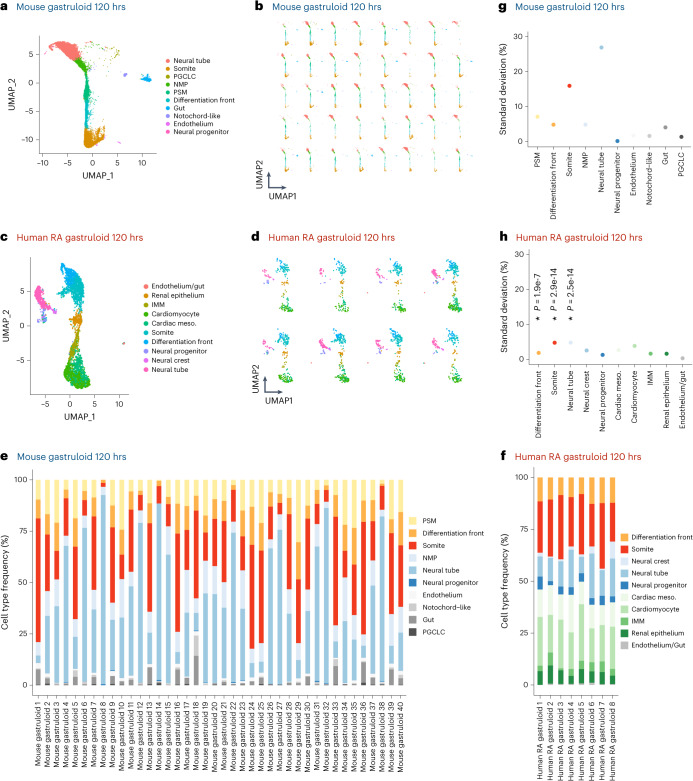
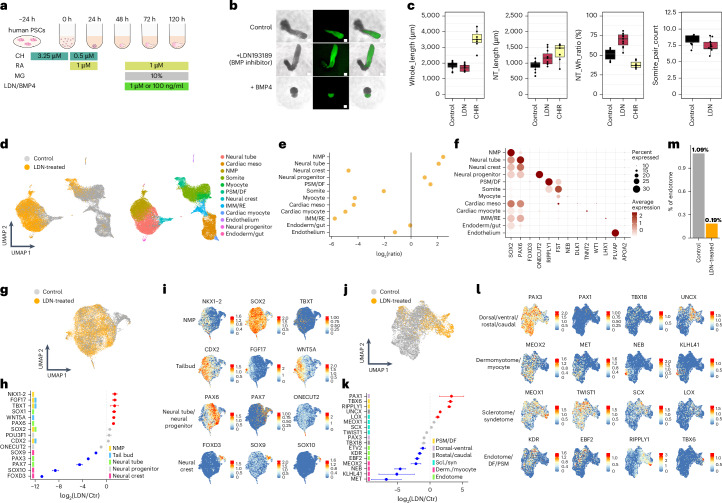
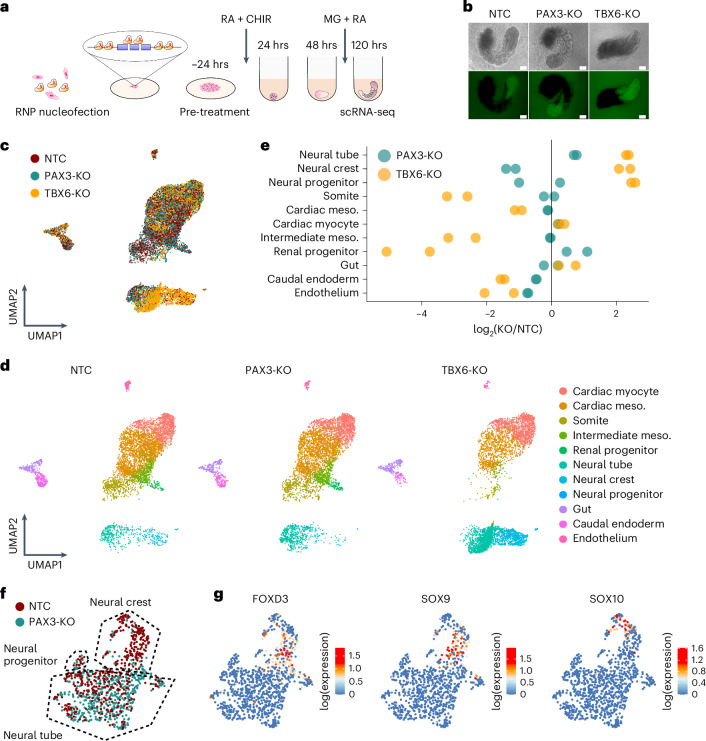
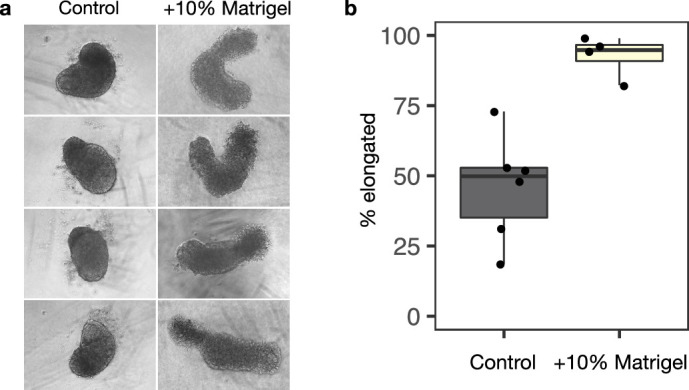
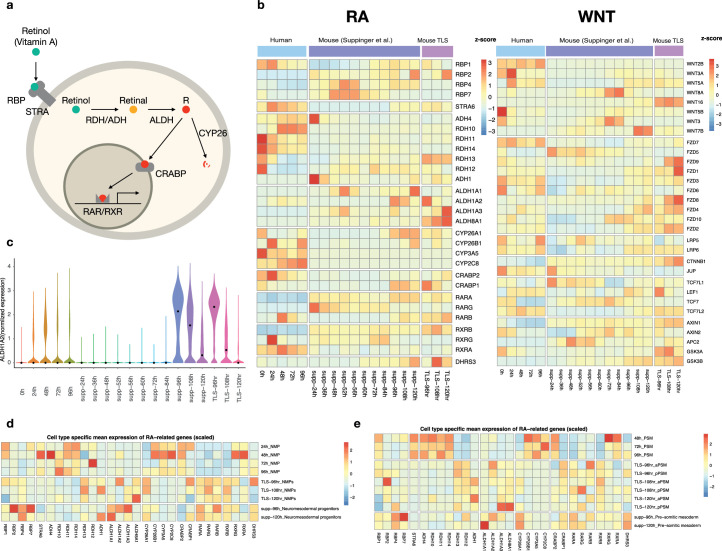
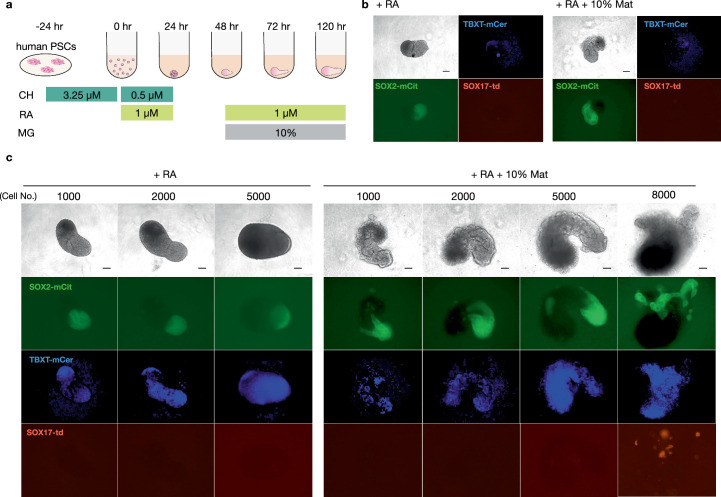
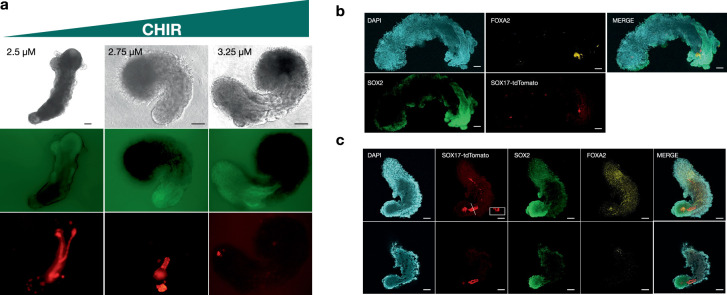
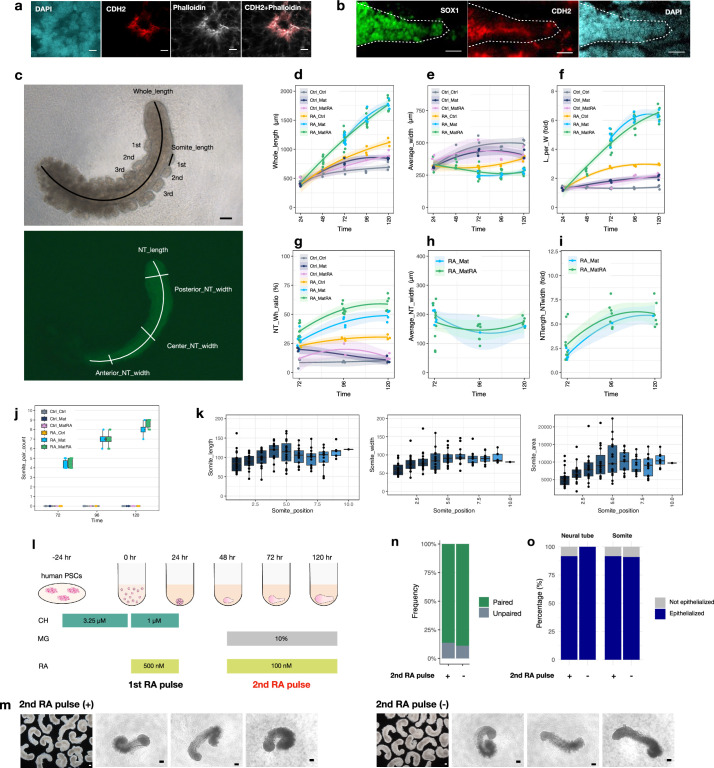
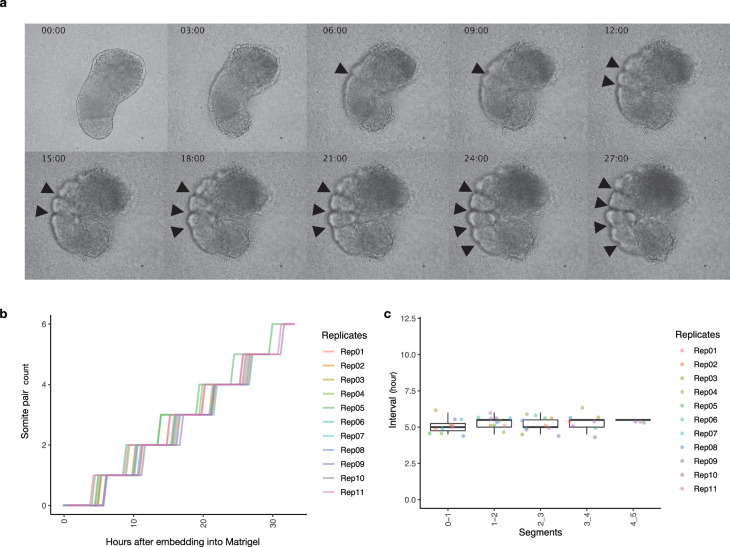
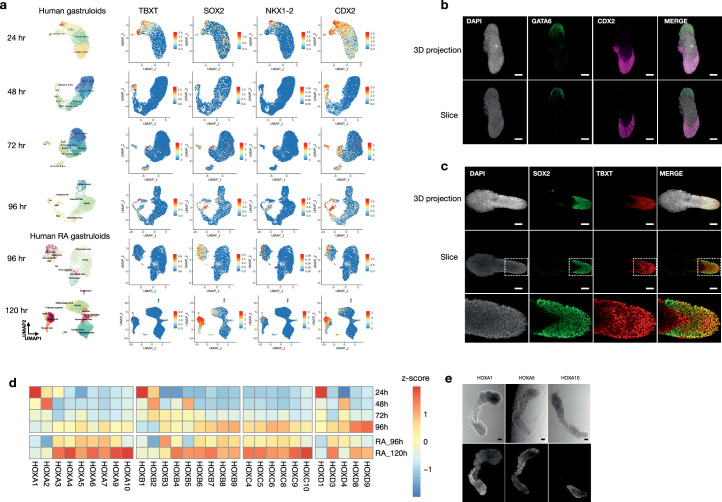
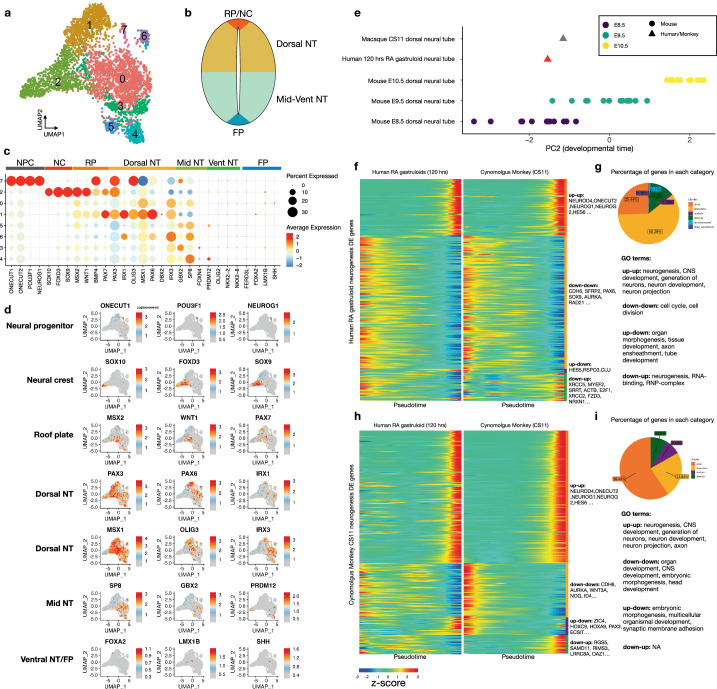
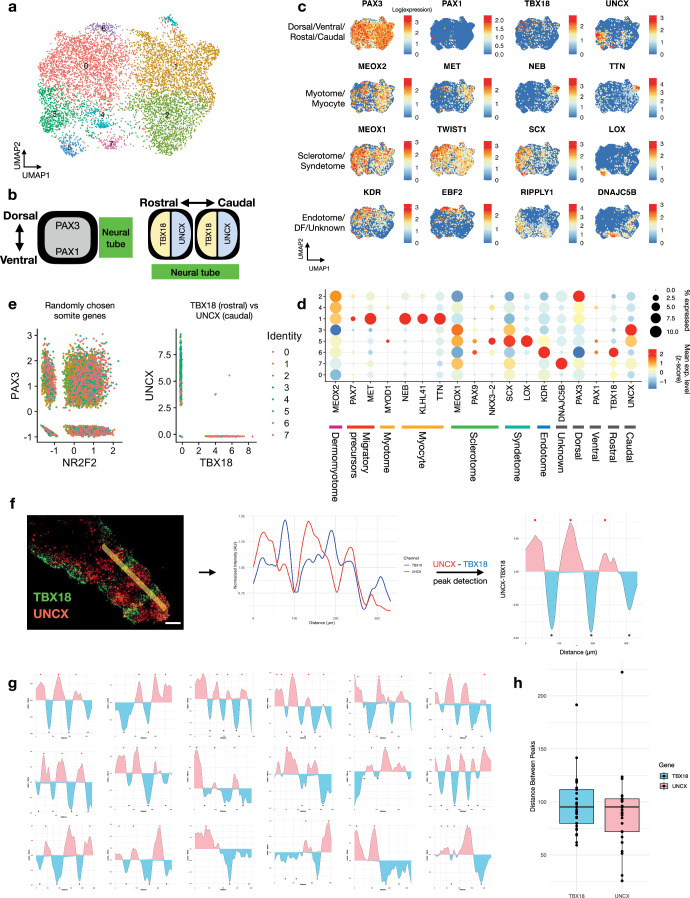
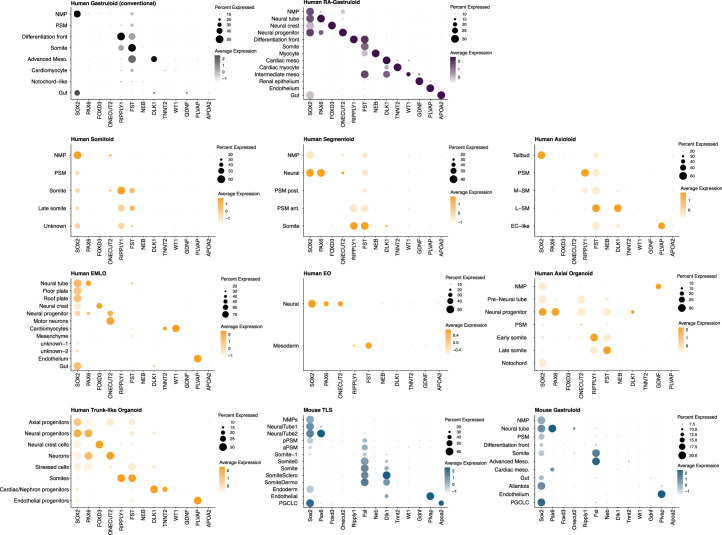
Gastruloids are a powerful in vitro model of early human development. However, although elongated and composed of all three germ layers, human gastruloids do not morphologically resemble post-implantation human embryos. Here we show that an early pulse of retinoic acid (RA), together with later Matrigel, robustly induces human gastruloids with posterior embryo-like morphological structures, including a neural tube flanked by segmented somites and diverse cell types, including neural crest, neural progenitors, renal progenitors and myocytes. Through in silico staging based on single-cell RNA sequencing, we find that human RA-gastruloids progress further than other human or mouse embryo models, aligning to E9.5 mouse and CS11 cynomolgus monkey embryos. We leverage chemical and genetic perturbations of RA-gastruloids to confirm that WNT and BMP signalling regulate somite formation and neural tube length in the human context, while transcription factors TBX6 and PAX3 underpin presomitic mesoderm and neural crest, respectively. Looking forward, RA-gastruloids are a robust, scalable model for decoding early human embryogenesis.


Conflict of interest statement

J.S. is a scientific advisory board member, consultant and/or co-founder of Prime Medicine, Cajal Neuroscience, Guardant Health, Maze Therapeutics, Camp4 Therapeutics, Phase Genomics, Adaptive Biotechnologies, Scale Biosciences, Sixth Street Capital, Pacific Biosciences and Somite Therapeutics. The other authors declare no competing interests.

Figures

Fig. 1
Fig. 1. Single-cell transcriptional profiling of a time-series of conventional human gastruloids.
a, Schematic of conventional human gastruloid protocol. CH, CHIR99021; Y, Y-27632. b, Representative images of RUES2-GLR. The experiments were repeated independently six times with similar results. SOX2-mCit, pluripotent and ectoderm marker; TBXT-mCer, mesoderm marker; SOX17-tdTomato, endoderm marker. Scale bar, 100 µm. c, Integrated UMAP of ~44,000 scRNA-seq profiles from four time points of human gastruloid development, coloured by time point (left) or cell type annotation (right). The 48 h to 96 h gastruloids were sequenced per time point. d, UMAP projection of scRNA-seq profiles from individual time points of human gastruloids (generated by this study based on published protocols) or published data from mouse gastruloids or mouse TLSs. PGCLC, primordial germ cell-like cell; DE, definitive endoderm. e, Normalized expression of marker genes for neural tube (top row), NMPs (middle row) or PSM (bottom row) in UMAP projections of scRNA-seq profiles of extracted cell types (neural tube, NMP and PSM cells) from human gastruloids at 96 h, mouse gastruloids at 120 h (ref. ), or mouse TLS at 120 h (ref. ). Arrows represent putative differentiation of NMPs toward neural tube (green) and PSM (purple) fates, respectively. The key point is that NMP-like and PSM-like cells are detected in all three models, but neural tube-like cells are detected only in the two mouse models. UMAP, Uniform Manifold Approximation and Projection.
Fig. 2
Fig. 2. Robust induction of human gastruloids with both a neural tube and segmented somites via a discontinuous regimen of retinoic acid.
a, Schematic of human RA-gastruloid protocol. MG, Matrigel; CH; CHIR99021. RA was applied for the first 24 h after induction, then withdrawn, then added back at 48 h along with 5–10% MG. b, Representative images of developing human RA-gastruloids. Scale bar, 100 µm. n = 768 (96 × 8 plates) human RA-gastruloids showed similar morphology (elongated gastruloid with flanking somites) and patterns of marker gene expression (asymmetric, elongated SOX2-mCit+ signal flanked by non-overlapping weak TBXT-mCer signal overlaying somites). c, Quantification of the frequency of NT elongation and somite segmentation under various experimental conditions. NT, neural tube; Seg, segmented somites. d, Representative images of gastruloids with or without RA/MG from 400 cells (top) or 5,000 cells (bottom). The concentration of RA at 0–24 h and 48–120 h was 500 nM and 100 nM, respectively. n = 24–48 per condition. The concentration of MG was 5%. Scale bar, 100 µm. e, 3D projections of immunostained 120 h RA-gastruloids. The SOX1+, SOX2+ region corresponds to the NT-like structure, flanked by somite-like structures. Arrowheads indicate paired somites. n = 12/13 human RA-gastruloids showed similar morphology (elongated gastruloid with flanking somites) and patterns of marker gene expression (asymmetric, elongated, coincident SOX1 and SOX2 staining that did not extend to flanking somites). Scale bar, 100 µm. f, Confocal section of immunostained 120 h RA-gastruloid. Phalloidin staining shows the apical accumulation of F-actin in SOX2+, PAX3+ NT and PAX3+ somites. Slice images of the area indicated in the bold line are shown in the SOX2 staining image. The magnified region in the phalloidin staining image is indicated by a dotted square. Arrowheads indicate paired somites. Scale bar, 100 µm. n = 9/11 human RA-gastruloids showed similar morphology (elongated gastruloid with flanking somites) and patterns of marker gene expression (asymmetric, elongated SOX2 staining flanked by PAX3 staining of flanking somites). Source data
Fig. 3
Fig. 3. Induction of neural crest, IMM and other advanced cell types in human RA-gastruloids.
a, Annotated UMAP of scRNA-seq profiles from conventional (96 h) or RA (96 or 120 h) human gastruloids (top). The 48 h to 96 h gastruloids were sequenced per time point. IM meso., intermediate mesoderm. Marker gene expression (bottom). b, Cell type mapping of 120 h human RA-gastruloids against mouse embryonic datasets, via non-negative least-squares regression. c, Integrated UMAP of scRNA-seq data from conventional (0–96 h) and RA (96–120 h) human gastruloids. LPM/Spl.meso, lateral plate mesoderm/splanchnic mesoderm; PS/ME, primitive streak/mesoendoderm; FirstHF, first heart field; IM meso/renal progenitor, intermediate mesoderm/renal progenitor; SecondHF, second heart field; DF, differentiation front; DE/Gut, definitive endoderm/gut. d, Marker gene expression. e, Immunostaining of IMM and renal epithelium in 120 h human RA-gastruloids. Anti-WT1 (red, IMM), anti-SOX1 (green, neural tube), phalloidin (white, F-actin) or DAPI (cyan, nuclear) staining (left). WT1 + IMM-like cells appear lateral to the phalloidin-stained somites. Scale bar, 100 µm. Anti-PAX8 (red, renal epithelium), anti-SOX2 (green, neural tube) or DAPI (cyan, nuclear) staining (right). Scale bar, 100 µm. Arrowheads indicate paired somites. n = 4/4 and n = 3/4 gastruloids showed similar patterns of marker gene expression, respectively (punctate WT1 or PAX8 staining at the lateral border of somites). Sm, somite. fj, Immunostaining of neural crest-like cells in 120 h RA-gastruloids. f, 3D projection of somite and neural tube with anti-SOX2 (green, neural cells), anti-SOX10 (red, neural crest), phalloidin (yellow, F-actin) or DAPI (white, nuclear) staining. Arrowheads indicate paired somites. g, Lateral views of human RA-gastruloids. Scale bar, 50 µm. n = 11/12 gastruloids showed similar patterns of marker gene expression (punctate SOX10 staining asymmetrically localized on one surface of putative neural tube). h, Quantification of distribution of SOX10+ neural crest cells on neural tubes. Two straight lines were drawn from the centre point of a neural tube toward the outermost SOX10+ cells. NC, neural crest. i, Representative images of sliced neural tube images. Arrowhead indicates migrating SOX10+ cells. Scale bars, 10 µm. The experiments were repeated independently three times with similar results. j, Boxplot showing the distribution of the angle encompassing all SOX10+ cells observed on the surface of a given gastruloid. n = 71. DAPI, 4,6-diamidino-2-phenylindole.
Fig. 4
Fig. 4. Computational staging of human RA-gastruloids and other mammalian synthetic embryo models.
a, Schematic of strategy for computational staging. In brief, PCA on human samples defines a PC correlated with developmental progression (PC2). Projection of data from tightly staged mouse embryo data onto this human-defined PC enables staging of the relative progression of synthetic embryo models across species and systems. b, Projection of data from pooled mouse gastruloids (mG, 120 h), pooled mouse TLSs (96, 108 and 120 h) and individual, or pooled mouse embryos (E7.0–E10.5) onto PC space defined by the analysis of human data (CS, Carnegie stage human embryos; hGas, conventional human gastruloids; RA-hGas, human RA-gastruloids). c, Scatter-plot and Spearman’s correlation of mouse embryos’ PC2 values (x axis) and their embryonic stage (y axis; E7.0–10.5). A fitted regression line from a linear model is plotted. rs, Spearman’s correlation. d, Spearman’s correlation of mouse embryos’ PC values for various human-defined PCs, focusing either on mouse embryo day (E7.0–10.5) or somite count (0–12 somites). e, Pseudo-bulk transcriptomes of pooled human embryo models including RA-gastruloids (RA-hGas, 96, 120 h), conventional human gastruloids (hGas, 48, 72, 96 h), human somitoids (hSomitoid, day 7), human segmentoids (hSegmentoid, day 4), human axioloids (hAxioloid, day 5), human axial organoids (hAxial, day 5), human trunk-like organoids (hTrunk, day 7), EMLO gastruloids (hEMLO, day 16), human EOs (hEO, day 10); pooled mouse embryo models including gastruloids (mGas, day 5) and TLS (mTLS, day 5); individual human embryos at CS7, CS12 and CS13 (refs. ,); individual macaque embryos at CS8, CS9 and CS11 (ref. ) and individual, or pooled mouse embryos, projected onto the human-derived PC2. For mouse embryos, E8.5 and earlier samples are pooled embryos profiled with 10x Genomics scRNA-seq, whereas E8.5b and later samples are individual mouse embryos profiled with sci-RNA-seq3 (refs. ,). The dotted lines indicate the median PC2 values of mouse embryos at each embryonic day. Embryo models are coloured by the presence/absence of the morphologies of segmented somites and/or an elongated neural tube structure.
Fig. 5
Fig. 5. Inter-individual variation in cell type composition in mouse gastruloids versus human RA-gastruloids.
a,b, UMAP visualization of cell types observed in mouse gastruloids at 120 h, based on data from GSE212050 (ref. ). In a, all individuals are represented, whereas in b, the same UMAP projection shows the contribution of individual gastruloids. c,d, Same as a,b, but based on individual human RA-gastruloids with scRNA-seq data obtained by sci-Plex. e,f, Frequency with which individual cell types are observed in individual mouse gastruloids at 120 h (e) or individual human RA-gastruloids at 120 h (f). g,h, The s.d. of cell type proportions in individual mouse gastruloids at 120 h (g) or individual human RA-gastruloids at 120 h (h). In brief, to account for differences in the total number of cells per individual gastruloid, we randomly sampled 100 cells from each individual gastruloid, ten times per individual, to generate pseudo-replicates. For three cell types abundantly present in both models (differentiation front, somites, neural tube), we performed an analysis of variance (ANOVA) to test for significant differences in s.d. values between human and mouse samples. NPCs were excluded from the analysis because although present in both models, on average less than one NPC per individual mouse gastruloid was detected, precluding variance analysis. If the ANOVA was significant (P < 0.05), a post hoc Tukey’s honest significant difference (HSD) test was conducted to further evaluate pairwise differences between the species. For all three cell types compared, variation across individuals was significantly lower in human RA-gastruloids than mouse gastruloids (differentiation front, P = 1.89 × 10−7; somites, P = 2.9 × 10−14; neural tube, P = 2.5 × 10−14). Source data
Fig. 6
Fig. 6. Effects of perturbing BMP signalling on human RA-gastruloids.
a, Schematic of perturbation of BMP signalling in human RA-gastruloids. CHIR, CHIR99021; LDN/BMP4, LDN193189 or BMP4. b, Representative images of untreated control, LDN-treated and BMP4-treated RA-gastruloids. The experiments were repeated independently three times with similar results. Scale bar, 100 µm. c, Morphometrics. From left to right: full length (µm) of 120 h RA-gastruloids, neural tube (NT) length (µm) measured with SOX2-mCit signal, neural tube/full-length ratio and somite pair counts. n = 6 and 11 for untreated and LDN treatment, respectively. d, UMAP visualization of co-embedded scRNA-seq data from untreated (grey) and LDN-treated (yellow) 120 h human RA-gastruloids (left). Same UMAP labelled by cell type annotation (right). e, Cell type composition changes upon LDN treatment of human RA-gastruloids. f, Marker gene expression in each cell type. gi, The effects of BMP inhibition on neural lineages (NMP, neural tube, neural crest and neural progenitor cells). UMAP visualization of co-embedded scRNA-seq data (neural lineages only) from untreated (grey) and LDN-treated (yellow) 120 h human RA-gastruloids (g). Changes in marker gene expression with LDN treatment in neural lineages (h). Colour bars at left indicate the cell type(s) for which each gene is a marker. Dots indicate the ratio of average expression in LDN-treated versus control gastruloids. Data are presented as mean ± s.e.m. across pseudo-replicates (n = 3). Dots corresponding to increases or decreases larger than twofold are coloured red and blue, respectively. Same UMAP projection as g (i). Gene expression of three marker genes for each neural cell type are shown in each row. jl, Same as gi, but restricting instead to somitic lineages with pseudo-replicates (n = 3). Data are presented as mean ± s.e.m. m, Effects of LDN treatment on the proportion of endotome cells. Endotome cells are defined as the subset of somitic cells that are both KDR2+ and EBF2+. The bar chart shows the proportion of endotome cells, out of all somitic cells, in two experimental conditions.
Fig. 7
Fig. 7. Genetic perturbation of transcription factors in human RA-gastruloids.
a, Schematic of transcription factor knockouts in human RA-gastruloids using CRISPR/Cas9 RNPs. Six Cas9-gRNA RNPs were nucleofected into PS cells, inducing indels or full deletion of exons of PAX3 or TBX6. Nucleofected PS cells were subjected to RA-gastruloid induction protocol. RA-gastruloids were collected at 120 h after cell aggregation. b, Representative images of non-targeting-control (NTC), PAX3-KO, TBX6-KO RA-gastruloids. n = 96 gastruloids for each condition. Scale bar, 100 µm. c,d, UMAP of scRNA-seq data from NTC, PAX3-KO and TBX6-KO RA-gastruloids, labelled by genotype (c) or cell type (d). e, Cell type composition changes upon knockout of each transcription factor. log2 (KO/NTC) fold changes for each cell type are shown as dots. Vertical black line corresponds to no change in the proportion of the cell type between KO and NTCs. f, Annotated UMAP embedding of neural cell types only (neural tube, neural crest and neural progenitor cells) from PAX3-KO RA-gastruloid and controls. g, Same embedding as e, but showing gene expression (log-scaled) of neural crest marker genes.
Extended Data Fig. 1
Extended Data Fig. 1. Effects of Matrigel on human gastruloid morphology.
a, Representative images of human gastruloids without (left) vs. with (right) 10% Matrigel. The addition of 10% Matrigel enhances the extent of human gastruloid elongation. b, Boxplot showing the proportion of elongated gastruloids observed in the absence (left) vs. presence (right) of 10% Matrigel across a total of ten experiments. Raw counts are provided in Supplementary Table 1. The addition of 10% Matrigel enhances the robustness of human gastruloid elongation. Source data
Extended Data Fig. 2
Extended Data Fig. 2. Differential expression of genes related to RA/Retinol/Retinal pathways in mouse vs. human gastruloids.
a, Schematic of RA metabolism pathways. b, Heatmaps showing expression levels of genes involved in RA (left panel) and WNT (right panel) signalling pathways in conventional human gastruloids at 0–96 h from Moris et al., mouse gastruloids at 24–120 h from Suppinger et al. and mouse TLS 96–120 h from Veenvliet et al. Gene expression values were scaled by z-score across samples. c, Normalized expression of ALDH1A2 in conventional human gastruloids at 0–96 h, mouse gastruloids at 24–120 h, and mouse TLS at 96–120 h. d-e, Heatmaps showing expression levels of genes involved in RA signalling pathways in NMPs (d) and PSMs (e) of conventional human gastruloids at 0–96 h, mouse TLS at 96–120 h and mouse gastruloids at 96–120 h. Gene expression levels are shown for timepoints where NMPs and PSMs were detected in a given model.
Extended Data Fig. 3
Extended Data Fig. 3. The number of seeded cells impacts human gastruloid formation in the context of a discontinuous regimen of retinoic acid.
a, Schematic of discontinuous regimen of RA and Matrigel treatment while inducing human gastruloids. RA, retinoic acid; MG, 10% Matrigel. b, Representative images of 96 h human gastruloids induced from 400 cells. 1 µM RA (0–24 h and 48–96 h) (left) or 1 µM RA (0–24 h and 48–96 h) + 10% Matrigel (48–96 h) (right) were added to the medium. Scale bars, 100 µm, N = 32. c, Representative images of 96 h human RA-gastruloids while varying the number of cells used for initial seeding. Scale bars, 100 µm, N = 48.
Extended Data Fig. 4
Extended Data Fig. 4. Lower CHIR concentrations facilitate formation of elongated gut tube-like structures in human RA-gastruloids.
a, Effects of CHIR concentration at the pre-treatment stage on SOX17-tdTomato positive cell accumulation and elongation. Scale bars, 200 µm N = 32, 38, and 48, respectively. b, Immunostaining of 3.25 µM CHIR-treated 120 h human RA-gastruloids with anti-SOX2, anti-SOX17-tdTomato, and anti-FOXA2 antibodies. Scale, 100 µm, N = 8 out of 12 showed a similar staining pattern. c, Immunostaining of 2.75 µM CHIR-treated 120 h human RA-gastruloid with anti-SOX2, anti-SOX17-tdTomato, and anti-FOXA2 antibodies. (Top) Max projection of z-stack image. (Bottom) A slice of z-stack. Scale bars, 100 µm. N = 5 out of 7 gastruloids showed a similar staining pattern.
Extended Data Fig. 5
Extended Data Fig. 5. Morphological properties of human conventional and RA-gastruloids.
a, Immunostaining of N-cadherin (CDH2) and phalloidin in somites in an RA-gastruloid. Phalloidin-stained F-actin and CDH2 were co-localized and highly concentrated at the apical surface of somites. Scale bar, 10 µm. b, Immunostaining of N-cadherin (CDH2) and SOX1 in the neural tube in an RA-gastruloid. Scale bar, 100 µm. c, (Top) Bright-field of a human RA-gastruloid. The whole length was measured as the length of a line along the centre of the body. Each somite length was measured from the posterior end. (Bottom) SOX2-mCit view of the top picture. Neural tube length (NT_length) was measured as the continuous SOX2+ area. The width of neural tubes was measured and averaged over several positions (10%, 50%, 90% along the full length of the structure). Scale bar, 100 µm. d-l, Morphometric measurements of gastruloids which originated from 5,000 cells, as a function of time. Ctrl, no treatment controt; RA, Retinoic acid; Mat, 5% Matrigel; MatRA, Matrigel + RA. Left and right part of each text label indicates the conditions at 0–24 h and at 48–120 h, respectively. For example, Ctrl_Ctrl indicates no treatment for both 0–24 h and 48–120 h. N = ≥ 3 for each time point and condition. d, Whole length (µm) of gastruloids. e, Average width (µm) of gastruloids. f, Ratio (%) of whole length to average width. g, Ratio (%) of length of neural area to the whole length. h, Average neural tube width (µm). i, Ratio (%) of neural tube length-to-width. j, Number of somites observed as a function of time. k, Length, width, and area of somites as a function of position. N = 16 RA-gastruloids. l, Schematic of RA-gastruloid induction protocol, highlighting the first vs. second RA pulse. m, Bright-field images of human RA-gastruloids induced with (left column) vs. without (right column) inclusion of the second RA pulse. Scale bars = 100 µm. n, Frequency of paired somites in RA-gastruloids with vs. without inclusion of the second RA pulse. Somites with areas within 30% of one another were classified as "paired somites". This comparison was made for 3 randomly chosen putative somite pairs within each gastruloid. A gastruloid was subsequently designated as "paired gastruloid" if at least 2 out of 3 putative somite pairs were classified as "paired somites". N = 13/14 (92.9%) and N = 11/12 (91.7%) for RA-gastruloids with vs. without inclusion of the second RA pulse, respectively. o, Frequency of neural tube (left) and somite (right) epithelialization with vs. without inclusion of the second RA pulse, respectively. Epithelization was defined by the accumulation of phalloidin staining at the apical side of the structures upon immunostaining. The percentages indicate the frequency of gastruloids with epithelialized somite or neural tube. N = 11 and N = 10 for RA-gastruloids with vs. without inclusion of the second RA pulse, respectively. Source data
Extended Data Fig. 6
Extended Data Fig. 6. Live imaging of human RA-gastruloids.
a, Snapshots of the elongating human RA-gastruloids. After RA supplementation at 0–24 h, these gastruloids were subjected to live imaging after the addition of 5% Matrigel and RA at 48 h from the induction. Arrowheads indicate the emergence of a segmentation. The time after embedding gastruloid into Matrigel and RA is shown on the top left. b, Number of somite pairs observed in RA-gastruloid in the live imaging. The x-axis indicates the hours from embedding of the RA-gastruloid into Matrigel. c, Boxplot of the time interval between successive segmentations. Source data
Extended Data Fig. 7
Extended Data Fig. 7. Evaluation of NMPs and anterior–posterior patterning in human RA-gastruloids.
a, UMAP visualization with cell types and normalized expression patterns of NMP marker genes reported in literature for conventional human gastruloids at 24, 48, 72, or 96 h, or human RA-gastruloids at 96 or 120 h. b, Immunostaining of GATA6 (anterior marker) and CDX2 (posterior marker) in 48 h human RA-gastruloid. 3D max projection (Top) and sliced (Bottom) view. Scale bar, 100 µm. c, Immunostaining of SOX2 and TBXT in 48 h human RA-gastruloid. 3D max projection (Top) and sliced (Bottom) view. The dotted square in the middle row is zoomed in the bottom row. Scale bar, 100 µm. d, Heatmap showing the relative expression of HOX genes in conventional and RA-gastruloids at various timepoints. Mean expression levels of whole cells of each sample were normalized by z-score across samples. e, Representative images of HCR of HOX genes in human RA-gastruloids at 120 h. (Top) Bright-field and (Bottom) HCR imaging of HOXA1, HOXA5 and HOXA10. Scale bar, 100 µm. N = 18, 17, 21 gastruloids for HOXA1, HOXA5 and HOXA10, respectively.
Extended Data Fig. 8
Extended Data Fig. 8. Evaluation of dorsal-ventral markers and neural differentiation in human RA-gastruloids.
a, Clustering and UMAP visualization of neural-related cells from scRNA-seq data of 120 hr human RA-gastruloids. b, Schematic of dorsal-ventral axis of neural tube, with labels corresponding to subsets of marker genes shown in panel (c). c, Bubble plot of marker gene expression patterns in each of the clusters shown in panel (a). d, Marker gene expression, projected onto UMAP shown in panel (a). NPC, neural progenitor; NC, neural crest cells; RP, roof plate; NT, neural tube; FP, floor plate. e, Staging alignment of pseudo-bulk profiles of neural tube cells from CS11 cynomolgus monkey embryos, neural tube cells from 120 h human RA-gastruloids and dorsal neural tube cells from E8.5–E10.5 mouse embryos, leveraging human-defined PC2 (see Fig. 4, Supplementary Fig. 12, Supplementary Fig. 13 and corresponding sections of main text for more details). f, Developmentally differentially expressed genes (DEGs) along the neural differentiation trajectory of human RA-gastruloids were computed. The heatmaps show side-by-side comparison of the scaled expression level of these DEGs along neural differentiation trajectories in 120 h human RA-gastruloids (left) or CS11 cynomolgus monkey embryos (right). Genes are grouped into concordant (up-up: upregulated in both species, down-down: downregulated in both species) and discordant (up-down: upregulated in human and downregulated in monkey, down-up: downregulated in human and upregulated in monkey) categories with example genes shown for each category. Genes that are not detected in monkeys are not shown in the heatmaps. g, The percentage of DEGs in each category and the GO terms (http://www.gsea-msigdb.org/gsea) associated with each category shown in panel (f). h, Same as panel (g), except that the DEGs shown are from the neural differentiation trajectory of cynomolgus monkey. i, The percentage of DEGs in each category and the GO terms associated with each category shown in panel (h).
Extended Data Fig. 9
Extended Data Fig. 9. Markers of spatial patterning and differentiation in the somites of human RA-gastruloids.
a, Clustering and UMAP visualization of somite-related cell types (somite, differentiation front, myocyte) from scRNA-seq data of 120 h human RA-gastruloids. b, Schematic of dorsal-ventral and rostral-caudal axes of somites, with expected marker genes noted. c, Same UMAP as panel (a) showing expression of selected marker genes for various subtypes of cells within somites. DF, differentiation front. d, Bubble plot showing expression patterns of selected marker genes for clusters shown in panel (a). e, Scatter-plot showing scaled expression levels of randomly chosen pairs of genes (left) or TBX18 vs. UNCX (right). The expression of TBX18 and UNCX, markers of the rostral-caudal axis of somites, are mutually exclusive. f, (left) Representative image of HCR of UNCX and TBX18 in 120 h human RA-gastruloids, and quantification of the signal intensity along with the A-P axis. Scale bar, 50 µm. (middle) Signal intensities of TBX18 (blue) and UNCX (red) were measured on the yellow line of the left panel. Data was normalized with the mean values of each signal and processed with LOESS smoothing. (right). Line plot showing the difference between TBX18 and UNCX values. Red and blue dots indicate the peaks for UNCX-high (red) and TBX18-high (blue), respectively, detected by a findpeaks function of pracma R package. g, Similar line plots for 18 RA-gastruloids. h, Boxplot showing the distribution of the distances between successive TBX18-high (blue) or UNCX-high (red) peaks. Source data
Extended Data Fig. 10
Extended Data Fig. 10. Cell types identified in various human and mouse embryo models.
Marker gene expression of annotated cell types in various embryo models are shown as bubble plots. The colours indicate the classification of embryo models; conventional human gastruloids (grey), human RA-gastruloids (purple), other embryo models–,, (yellow), and mouse gastruloids (blue),. The same set of marker genes (columns) are used in all panels.

References

    1. Deglincerti, A. et al. Self-organization of the in vitro attached human embryo. Nature533, 251–254 (2016). - PubMed
    1. Shahbazi, M. N. et al. Self-organization of the human embryo in the absence of maternal tissues. Nat. Cell Biol.18, 700–708 (2016). - PMC - PubMed
    1. Xiang, L. et al. A developmental landscape of 3D-cultured human pre-gastrulation embryos. Nature577, 537–542 (2019). - PubMed
    1. Yu, L. et al. Blastocyst-like structures generated from human pluripotent stem cells. Nature591, 620–626 (2021). - PubMed
    1. Zheng, Y. et al. Controlled modelling of human epiblast and amnion development using stem cells. Nature573, 421–425 (2019). - PMC - PubMed

Publication types

MeSH terms