. 2024 Nov;133(5):308-316.
doi: 10.1038/s41437-024-00715-z. Epub 2024 Aug 20.

Stem cell transcriptional profiles from mouse subspecies reveal cis-regulatory evolution at translation genes

Affiliations

Stem cell transcriptional profiles from mouse subspecies reveal cis-regulatory evolution at translation genes

Noah M Simon et al. Heredity (Edinb). 2024 Nov.

Erratum in

Abstract

A key goal of evolutionary genomics is to harness molecular data to draw inferences about selective forces that have acted on genomes. The field progresses in large part through the development of advanced molecular-evolution analysis methods. Here we explored the intersection between classical sequence-based tests for selection and an empirical expression-based approach, using stem cells from Mus musculus subspecies as a model. Using a test of directional, cis-regulatory evolution across genes in pathways, we discovered a unique program of induction of translation genes in stem cells of the Southeast Asian mouse M. m. castaneus relative to its sister taxa. We then mined population-genomic sequences to pursue underlying regulatory mechanisms for this expression divergence, finding robust evidence for alleles unique to M. m. castaneus at the upstream regions of the translation genes. We interpret our data under a model of changes in lineage-specific pressures across Mus musculus in stem cells with high translational capacity. Our findings underscore the rigor of integrating expression and sequence-based methods to generate hypotheses about evolutionary events from long ago.


Conflict of interest statement

The authors declare no competing interests.

Figures
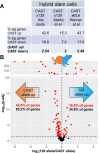
Fig. 1
Fig. 1. Directional cis-regulatory variation in translation gene expression in stem cells between mouse subspecies.
A Results from analyses of differential allele-specific expression across genes from the Gene Ontology term GO:0006412, translation, in stem cells of F1 hybrids between CAST and either C57BL/6 (from Werner et al. 2017) or 129 (Marks et al. or this study) as indicated. The first and second rows report the percentage of translation genes in which the CAST allele was expressed higher or lower, respectively, than the allele of the other parent, and the third row reports the ratio of these quantities. B Each point reports allele-specific expression of a translation gene in CASTx129 hybrid stem cells cultured in this study: the x-axis reports the log2 ratio of expression of the respective strain alleles, and the y-axis reports the log10 of the significance of the difference (p-adj, adjusted p-value). Point colors report significance of differential allele-specific expression (red, adjusted p < 0.05; black, adjusted p > 0.05). Red and black text inlays report the percentage of translation genes where expression of the respective parental allele was higher with and without filtering for significance, respectively.
Fig. 2
Fig. 2. Directional trans-regulatory variation in translation gene expression in stem cells between mouse subspecies.
A Data are as in Fig. 1A except that each column reports results from comparisons between homozygous CAST and homozygous 129 (this study or Skelly et al. 2020), C57BL/6 J, A/J, NZO/HILtJ, NOD/ShiLtJ, WSB/EiJ, or PWD/PhJ (Skelly et al. 2020) as indicated. B Data are as in Fig. 1B except that each point reports expression of a translation gene in a comparison between homozygous CAST and 129 stem cells.
Fig. 3
Fig. 3. Signatures of species divergence and regulatory function of Ctr9 at translation genes.
A In a given row, each colored cell reports normalized divergence, the ratio of inter-subspecies divergence to within-subspecies polymorphism, at Ctr9 binding sites upstream of genes from the Gene Ontology term GO:0006412, translation, or all other genes of the genome, in a comparison between M. m. castaneus and the indicated population of a sister taxon. FRA, France; GER, Germany; IRA, Iran; AFG, Afghanistan; CZE, Czech Republic; KAZ, Kazakhstan. Cells are colored based on relative values. Values at the bottom report the results of an ANOVA testing for differences in normalized divergence between translation genes and controls (see Table 1 and Table S7). P-adj, screen p-value after correction for multiple testing; OR, odds ratio. B A portion of a Ctr9 binding footprint upstream of the translation gene Rps29 as an example of mouse subspecies variation. The x-axis reports position relative to the transcription start site. Each row reports the sequence of one mouse individual; at heterozygote loci, only the allele representing the alternate to the reference is shown, although our analysis methods accounted for both (see Methods). C Data are as in A, except that each value reports the number of sites divergent between M. m. castaneus and the indicated sister population in the region of interest, standardized by the length of the latter. D Data are as in A, except that each value reports the number of sites polymorphic within M. m. castaneus and/or the indicated sister population in the region of interest, standardized by the length of the latter. E Shown is an analysis of mouse subspecies divergence variation at Ctr9 binding sites, in genes stratified by membership in the translation gene cohort and allele-specific expression differences between CAST and 129 alleles in F1 hybrid stem cells (ASE; Marks et al. ; Table S5). For a given bar, the y-axis reports the percentage of genes in the indicated category containing variants in Ctr9 binding sites divergent between M. m. castaneus and one or more sister taxon (Table S8). *, Fisher’s exact test p = 0.02. F) Data and symbols are as in Fig. 1B except that each point reports a comparison of expression of one translation gene between Ctr9 knockdown and shRNA control mouse stem cells (Ruan et al. 2023), and red and black text inlays report the percentage of translation genes where expression was higher in the indicated genotype with and without filtering for significance, respectively.

Update of

References

    1. Agoglia RM, Sun D, Birey F, Yoon S-J, Miura Y, Sabatini K et al. (2021) Primate cell fusion disentangles gene regulatory divergence in neurodevelopment. Nature 592(7854):421–427. 10.1038/s41586-021-03343-3 - PMC - PubMed
    1. Auclair G, Borgel J, Sanz LA, Vallet J, Guibert S, Dumas M et al. (2016) EHMT2 directs DNA methylation for efficient gene silencing in mouse embryos. Genome Res 26(2):192–202. 10.1101/gr.198291.115 - PMC - PubMed
    1. Beamer WG, Shultz KL, Churchill GA, Frankel WN, Baylink DJ, Rosen CJ et al. (1999) Quantitative trait loci for bone density in C57BL/6J and CAST/EiJ inbred mice. Mamm Genome 10(11):1043–1049. 10.1007/s003359901159 - PubMed
    1. Benjamini Y, Hochberg Y (1995) Controlling the False Discovery Rate: A Practical and Powerful Approach to Multiple Testing. J R Stat Soc: Ser B (Methodol) 57(1):289–300. 10.1111/j.2517-6161.1995.tb02031.x
    1. Berg JJ, Harpak A, Sinnott-Armstrong N, Joergensen AM, Mostafavi H, Field Y et al. (2019) Reduced signal for polygenic adaptation of height in UK Biobank. Elife 8:e39725. 10.7554/eLife.39725 - PMC - PubMed