. 2024 Nov;21(11):1251-1265.
doi: 10.1038/s41423-024-01203-4. Epub 2024 Aug 20.

Engineered mitochondria exert potent antitumor immunity as a cancer vaccine platform

Affiliations

Engineered mitochondria exert potent antitumor immunity as a cancer vaccine platform

Jingwen Luo et al. Cell Mol Immunol. 2024 Nov.

Abstract

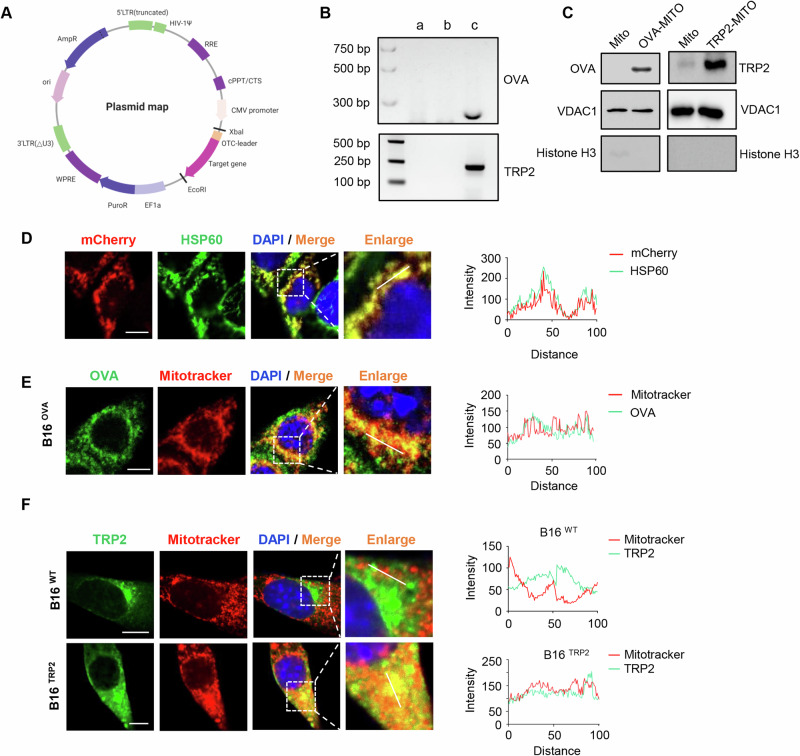
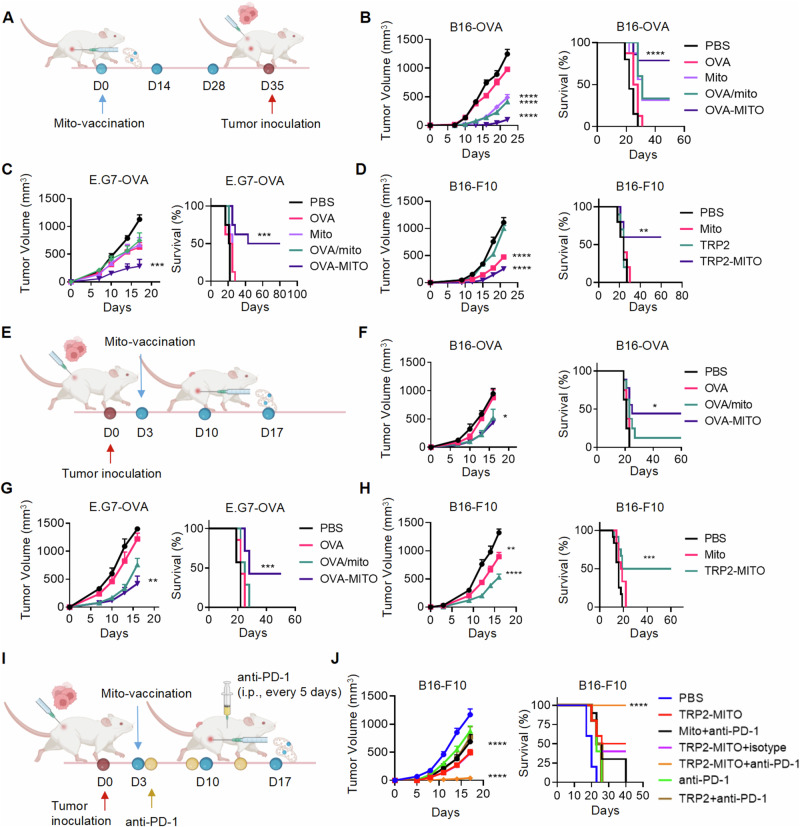
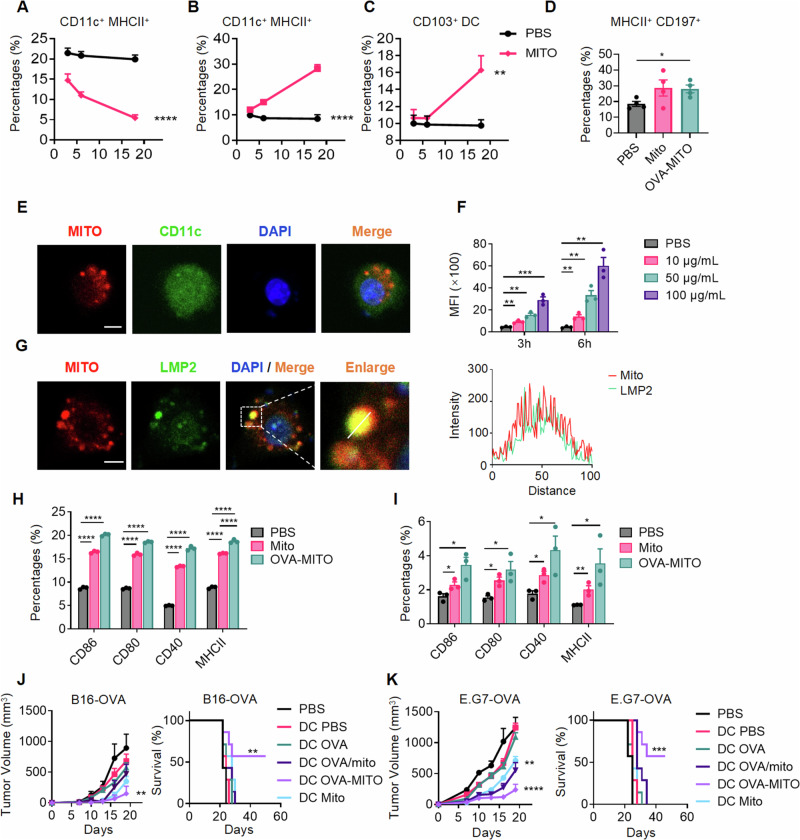
The preferable antigen delivery profile accompanied by sufficient adjuvants favors vaccine efficiency. Mitochondria, which feature prokaryotic characteristics and contain various damage-associated molecular patterns (DAMPs), are easily taken up by phagocytes and simultaneously activate innate immunity. In the current study, we established a mitochondria engineering platform for generating antigen-enriched mitochondria as cancer vaccine. Ovalbumin (OVA) and tyrosinase-related protein 2 (TRP2) were used as model antigens to synthesize fusion proteins with mitochondria-localized signal peptides. The lentiviral infection system was then employed to produce mitochondrial vaccines containing either OVA or TRP2. Engineered OVA- and TRP2-containing mitochondria (OVA-MITO and TRP2-MITO) were extracted and evaluated as potential cancer vaccines. Impressively, the engineered mitochondria vaccine demonstrated efficient antitumor effects when used as both prophylactic and therapeutic vaccines in murine tumor models. Mechanistically, OVA-MITO and TRP2-MITO potently recruited and activated dendritic cells (DCs) and induced a tumor-specific cell-mediated immunity. Moreover, DC activation by mitochondria vaccine critically involves TLR2 pathway and its lipid agonist, namely, cardiolipin derived from the mitochondrial membrane. The results demonstrated that engineered mitochondria are natively well-orchestrated carriers full of immune stimulants for antigen delivery, which could preferably target local dendritic cells and exert strong adaptive cellular immunity. This proof-of-concept study established a universal platform for vaccine construction with engineered mitochondria bearing alterable antigens for cancers as well as other diseases.

Keywords: Antitumor immunity; Cardiolipin; Mitochondria vaccine; TLR2.


Conflict of interest statement

The authors declare no competing interests.

Figures

Fig. 1
Fig. 1
Construction of stable vaccine generation platform with engineered mitochondria bearing model antigen. A Schematic representation of the antigen expression plasmid containing the mitochondrial localization signal peptide sequence from ornithine transcarbamylase (OTC) and selected length of model antigen (OVA or TRP2) sequence. B Agarose gel electrophoresis showing mRNA expression levels of OVA or TRP2 in B16-F10 cells. a, untreated B16-F10 cells; b, B16-F10 cells transfected with null plasmid; c, constructed stable B16-F10 cell lines with mitochondria bearing model antigen (OVA or TRP2). C Immunoblot analysis of OVA or TRP2 levels in the mitochondria of B16-F10 cells or constructed stable B16-F10 cell lines with mitochondria bearing model antigen (OVA or TRP2). Anti-VDAC1 was used as a loading control. D Immunofluorescent analysis of the colocalization of exogenous mCherry with HSP60 in B16-F10 cells transfected with mCherry fluorescent protein expression plasmid with an OTC leader sequence. The fluorescence intensity corresponding to mCherry and HSP60 is shown on the right side. E Immunofluorescence analysis of the colocalization of exogenous OVA with MitoTracker in stable B16-F10 cell line with mitochondria bearing OVA (B16OVA). The fluorescence intensity corresponding to OVA and MitoTracker is shown on the right side. F Immunofluorescent analysis of the colocalization of exogenous TRP2 with MitoTracker in B16-F10 cells and stable B16-F10 cell line with mitochondria bearing TRP2 (B16TRP2). The fluorescence intensity corresponding to TRP2 and MitoTracker is shown on the right side. Scale bars represent 10 μm in (DF)
Fig. 2
Fig. 2
Engineered mitochondria vaccine inhibits tumor growth in mice. A Schematic representation of the prophylactic tumor vaccines (OVA-MITO or TRP2-MITO) for immunotherapy in mice. B16-OVA (B) and E.G7-OVA (C)-derived tumor-bearing mice received the indicated prophylactic treatments (5 μg soluble OVA, 50 μg Mito, 50 μg Mito plus 5 μg soluble OVA, or 50 μg OVA-MITO on day 0, 14 and 28). Mito represents the control mitochondria without tumor antigen. Tumor volumes and mouse survival measured at the indicated time points are shown. (n = 12 in (B) and n = 8 in C). D, B16-F10-derived tumor-bearing mice received the indicated prophylactic treatments (5 μg soluble TRP2, 50 μg Mito or 50 μg TRP2-MITO on day 0, 14 and 28). Tumor volumes and mouse survival measured at the indicated time points are shown (n = 10). E Schematic representation of the therapeutic tumor vaccines (OVA-MITO or TRP2-MITO) for immunotherapy in mice. B16-OVA (F) and E.G7-OVA (G)-derived tumor-bearing mice received the indicated therapeutic treatments (5 μg soluble OVA, 50 μg Mito plus 5 μg soluble OVA or 50 μg OVA-MITO on day 3, 10 and 17). Tumor volumes and mouse survival measured at the indicated time points are shown. (n = 8 in (F) and n = 7 in (G). H B16-F10-derived tumor-bearing mice received the indicated therapeutic treatments (50 μg Mito or 50 μg TRP2-MITO on day 3, 10 and 17). Tumor volumes and mouse survival measured at the indicated time points are shown. (n = 12). I Schematic representation of TRP2-MITO vaccines in combination with anti-PD-1 therapy in a murine B16-F10 tumor model. J B16-F10-derived tumor-bearing mice received the indicated therapeutic treatments (5 μg soluble TRP2, 50 μg TRP2-MITO or 50 μg Mito on day 3, 10, and 17, 10 mg/kg anti-PD-1 antibodies (Abs), or isotype-matched control antibody every 5 days). Tumor volumes and mouse survival measured at the indicated time points are shown. (n = 8). Data are presented as the mean values ± SEMs. One-way ANOVA was conducted for the analysis of tumor volumes, and the log-rank (Mantel-Cox) test was used for survival; *P < 0.05, **P < 0.01, ***P < 0.001, and ****P < 0.0001. See also Supplementary Fig. 1
Fig. 3
Fig. 3
Engineered mitochondria vaccine could effectively recruit Dendritic cells and enhance their maturation and local antitumor immune response. A Flow cytometry analysis of CD11c+ MHC II+ DC accumulation at the injection site of mice after the subcutaneous injection (50 µg Mito, or PBS for 3 h, 6 h, and 18 h). (n = 5). Flow cytometry analysis of the number of CD11c+ MHC II+ DCs (B) and CD103+ DCs (C) migrating to the draining lymph nodes (dLNs) of mice after the subcutaneous injection (50 µg Mito, or PBS for 3 h, 6 h, and 18 h). (n = 5). D Flow cytometric analysis of CCR7 (CD197+) expression in MHC II+ DCs in the draining lymph nodes of mice after the subcutaneous injection (50 µg Mito alone, 50 µg OVA-MITO, or PBS for 18 h). (n = 4). E Immunofluorescence analysis of CD11c+ BMDCs incubated with mCherry-MITO (10 μg/mL) for 6 h. F Flow cytometric analysis of CD11c+ BMDCs treated with the indicated concentrations (PBS, 10 µg/mL, 50 µg/mL, or 100 µg/mL Mito) of MitoTracker™ Red CMXRos-stained mitochondria for 3 or 6 h. G Immunofluorescence analysis of the colocalization of exogenous mCherry-MITO with LMP2 in BMDCs treated with mCherry-MITO (10 μg/mL) for 3 h. The fluorescence intensity corresponding to mCherry and LMP2 is shown on the right side. H Flow cytometric analysis of CD86, CD80, CD40, and MHC II expression in BMDCs treated with Mito or OVA-MITO (10 μg/ml) in vitro for 24 h, the experiment was repeated twice. I Flow cytometric analysis of CD86, CD80, CD40, and MHC II expression in BMDCs in the draining lymph nodes of mice after the indicated treatments (50 μg Mito or 50 μg OVA-MITO into the hind footpad of mice for 18 h). (n = 3) The experiment was repeated twice. B16-OVA (J) and E.G7-OVA (K) tumor-bearing mice received the indicated therapeutic treatments (1 × 106 DCs preincubated with PBS, OVA, OVA/mito, Mito and OVA-MITO at 10 μg/mL overnight, immunized on day 3, 10, and 17). Tumor volumes and mouse survival measured at the indicated time points are shown. (n = 7). Mito represents the control mitochondria without tumor antigen. Scale bars represent 10 μm in (E) and (G). Data are presented as the mean values ± SEMs. One-way ANOVA was conducted in (AD), t test analysis was conducted in (F, H, and I), and log rank (Mantel-Cox) test was used for survival; *P < 0.05, **P < 0.01, ***P < 0.001, and ****P < 0.0001. See also Supplementary Fig. 2
Fig. 4
Fig. 4
OVA-MITO vaccine activates T-cell immunity in the tumor microenvironment. Flow cytometric analysis of tumor-infiltrating CD3+ CD8+ T cell (A), CD3+ CD8+ CD107a+ T cell (B), and CD3+ CD8+ CD11c+ T cell (C) from mice preimmunized with the indicated treatments (5 μg soluble OVA, 50 μg Mito plus 5 μg soluble OVA or 50 μg OVA-MITO on day 0, 14 and 28). The data are illustrated as positive percentages in all tested cells. (n = 5). Flow cytometric analysis of tumor-infiltrating M2 macrophages (CD11b+, F4/80+, CD206+) (D), and MDSCs (CD11b+, Gr1+) (E) from mice preimmunized with the indicated treatments (5 μg soluble OVA, 50 μg Mito plus 5 μg soluble OVA or 50 μg OVA-MITO on day 0, 14 and 28). The data are illustrated as positive percentages in all tested cell. (n = 5). F Flow cytometric analysis of splenic CD4+ TCMs (CD44+CD62L+) and CD4+ TEMs (CD44+CD62Llow) in mice receiving the indicated treatments (5 μg soluble OVA, 50 μg Mito plus 5 μg soluble OVA or 50 μg OVA-MITO on day 0, 14 and 28). The data are illustrated as positive percentages CD4+ cells (TCM, Central Memory T cell; TEM, Effector Memory T cell; n = 3). G Flow cytometric analysis of splenic CD8+ TCM cells (CD44+CD62L+) and CD8+ TEM cells (CD44+CD62Llow) in mice receiving the indicated treatments (5 μg soluble OVA, 50 μg Mito plus 5 μg soluble OVA or 50 μg OVA-MITO on day 0, 14 and 28). The data are illustrated as positive percentages CD8+ cells (TCM, Central Memory T cell; TEM, Effector Memory T cell; n = 3). HJ Splenocytes from mice immunized the indicated treatment (5 μg soluble OVA, 50 μg Mito plus 5 μg soluble OVA or 50 μg OVA-MITO on day 0, 14 and 28) were isolated and subsequently cultured in vitro with OVA257-264 peptide for 72 h. Flow cytometric analysis of CD8+ OVA tetramer+ T cells (H), CD8+ Granzyme+ T cells (I), and CD8+ IFN-γ+ T cells (J). The data are illustrated as positive percentages in CD8+ cells (n = 3). K ELISA analysis of IFN-γ secretion in the supernatant of CD8+ T cells after the same treatment as (HJ). (n = 4). The experiment was repeated twice. L Splenic lymphocytes from mice that had received the indicated treatment (5 μg soluble OVA, 50 μg Mito plus 5 μg soluble OVA or 50 μg OVA-MITO on day 0, 14 and 28) were isolated and subsequently cultured with B16-OVA cells at different ratios (25:1, 50:1) for 6 h. The specific lysis analysis of B16-OVA cells after splenic T-cell stimulation. (n = 3). M, Splenic lymphocytes were isolated from mice received the indicated treatments (immunized with 5 μg soluble OVA, 50 μg mito plus 5 μg soluble OVA or 50 μg OVA-MITO in the prophylactic vaccine mode). A total of 1 × 107 spleen lymphocytes prepared from immunized mice were injected 1 day before inoculation of B16-OVA cells. Tumor volumes measured at the indicated treatments are shown. (n = 7). N, Splenocytes from mice that had received the indicated treatment (5 μg soluble OVA, 50 μg Mito plus 5 μg soluble OVA or 50 μg OVA-MITO on day 0, 14 and 28) were isolated and subsequently cultured in vitro with OVA323-339 peptide for 72 h. Flow cytometric analysis of IFN-γ+ CD4+ Th1 cells (Left). The data are illustrated as positive percentages in CD4+ cells. ELISA analysis of IFN-γ secretion in the supernatant of Th1 CD4+ T cells (right). (n = 3). The experiment was repeated twice. Data are presented as the mean values ± SEMs. One-way ANOVA was conducted in (AN); *P < 0.05, **P < 0.01, ***P < 0.001, and ****P < 0.0001. See also Supplementary Fig. 3
Fig. 5
Fig. 5
Mitochondria vaccines promote dendritic cell maturation by regulating the TLR2-mediated pathway. ELISA analysis of IL-6 (A), TNF-α (B), and IL-12p70 (C) levels in the supernatant of different knockout CD11c+ BMDCs that were incubated with mitochondria (10 μg/mL) for 24 h. Flow cytometric analysis of CD86, CD80, CD40, and MHC II in WT (D) and TLR2−/− (E) CD11c+ BMDCs that were incubated with or without mitochondria (10 μg/mL) for 24 h. (n = 3). F Flow cytometric analysis of CD86, CD80, CD40, and MHC II of CD11c+ BMDCs (pretreatment of BMDCs with 100 Μm C29 with for 2 h, subsequently stimulated with or without 10 μg/mL mitochondria for 24 h). (n = 3). G ELISA analysis of IL-6, TNF-α and IL-12p70 levels in the supernatant of BMDCs that received the same treatments as (F) (n = 3). H BMDCs (2 × 105) from WT or TLR2−/− mice were preincubated with OVA (1 μg/mL) or OVA-MITO (10 μg/mL) and subsequently cocultured with CFSE-labeled CD8+ T cells (1 × 106) from OT-I mice for 48 h. Phase contrast images of OT-I CD8+ T cells, Scale bars, 100 μm. The experiment was repeated twice. I B16-F10 tumor-bearing WT and TLR2−/− mice received the indicated prophylactic treatments (50 μg Mito or 50 μg TRP2-MITO on day 0, 14, and 28). Tumor volumes measured at the indicated time points are shown. (n = 8). J B16-OVA tumor-bearing WT and TLR2−/− mice received the indicated prophylactic treatments (5 μg soluble OVA or 50 μg OVA-MITO on day 0, 14 and 28). Tumor volumes measured at the indicated time points are shown (n = 8). K B16-F10 tumor-bearing WT and TLR2−/− mice received the indicated therapeutic treatments on the opposite frank (50 μg Mito or 50 μg TRP2-MITO on day 3, 10 and 17). Tumor volumes measured at the indicated time points are shown. (n = 12 in the WT Mito group; n = 11 in the other groups). Data are presented as the mean values ± SEMs. One-way ANOVA was conducted in (AC) and (IK), and t test analysis was conducted in (DH); *P < 0.05, **P < 0.01, ***P < 0.001, and ****P < 0.0001. See also Supplementary Fig. 4
Fig. 6
Fig. 6
Cardiolipin from mitochondria play a major role in dendritic cell maturation and antitumor immune response through TLR2. A Flow cytometric analysis of CD86, CD80, CD40, and MHC II of CD11c+ BMDCs that were treated with the indicated concentrations (PBS, 10 μg/mL, 20 μg/mL or 50 μg/mL of cardiolipin for 24 h. CL is for cardiolipin (n = 3). The experiment was repeated twice. Flow cytometric analysis of CD86, CD80, CD40, and MHC II in WT (B) and TLR2−/− (C) CD11c+ BMDCs that were treated with or without CL (50 μg/mL) for 24 h. (n = 3). The experiment was repeated twice. D qRT-PCR analysis of Crls1 in B16-F10 cells transfected with siCrls1 or siScramble for 48 h. E Analysis of CL level in mitochondria in B16-F10 cells transfected with siCrls1 or siScramble for 48 h. F-G B16-F10-derived tumor-bearing mice received the indicated therapeutic treatments (50 μg TRP2-MITO, 50 μg CL-downregulated TRP2-MITO with siCrls1 or with siScramble on day 3, 10 and 17). Tumor volumes measured and mouse survival measured at the indicated time points are shown. (n = 12). HI B16-F10-derived tumor-bearing mice received the indicated subcutaneous injection (50 μg TRP2-MITO on day 3, 10 and 5 mg/kg CL every 3 days). Tumor volumes and mouse survival measured at the indicated time points are shown (n = 12). Data are presented as the mean values ± SEMs. T test analysis was conducted in (A–C), one-way ANOVA was conducted in (DH), and the log rank (Mantel-Cox) test was used for survival; **P < 0.01, ***P < 0.001, and ****P < 0.0001

References

    1. Saxena M, van der Burg SH, Melief CJM, Bhardwaj N. Therapeutic cancer vaccines. Nat Rev Cancer. 2021;21:360–78. - PubMed
    1. Probst P, Stringhini M, Ritz D, Fugmann T, Neri D. Antibody-based delivery of TNF to the tumor neovasculature potentiates the therapeutic activity of a peptide anticancer vaccine. Clin Cancer Res. 2019;25:698–709. - PMC - PubMed
    1. Perez CR, De Palma M. Engineering dendritic cell vaccines to improve cancer immunotherapy. Nat Commun. 2019;10:5408. - PMC - PubMed
    1. Lopes A, Vandermeulen G, Préat V. Cancer DNA vaccines: current preclinical and clinical developments and future perspectives. J Exp Clin Cancer Res. 2019;38:146. - PMC - PubMed
    1. Tatsis N, Ertl HC. Adenoviruses as vaccine vectors. Mol Ther. 2004;10:616–29. - PMC - PubMed

LinkOut - more resources