. 2024 Aug 20;15(1):362.
doi: 10.1007/s12672-024-01238-z.

Subtyping of gastric cancer based on basement membrane genes that stratifies the prognosis, immune infiltration and therapeutic response

Affiliations

Subtyping of gastric cancer based on basement membrane genes that stratifies the prognosis, immune infiltration and therapeutic response

Xin Tang et al. Discov Oncol. .

Abstract

Gastric cancer (GC) is highly heterogeneous and prone to metastasis, which are obstacles to the effectiveness of treatment. The basement membrane (BM) acts as a barrier to tumor cell invasion and metastasis. It is critical to investigate the relationship between BM status, metastasis, and patient prognosis. In several large cohorts, we investigated BM gene expression-based molecular classification and risk-prognosis models for GC, examined tumor microenvironment (TME) differences among different molecular subtypes, and developed risk models in predicting prognosis, immunotherapy effectiveness, and chemotherapy resistance. Three GC subtypes (BMclusterA/B/C) based on BM gene expression status were discovered. Each of the three GC subtypes has unique immune infiltration and activated oncogenic signals. Moreover, a 6-gene score (BMscore) predictive model was developed. The low BMscore group had a high tumor mutation burden, high immunogenicity, and low RHOJ expression levels, implying that individuals with GC in this category may be more susceptible to immunotherapy and treatment. The EMT subtype showed a considerably higher BMscore than the other subtypes in the Asian Organization for Research on Cancer (ACRG) molecular classification. Endothelial cells, smooth muscle cells, and fibroblasts may be engaged in regulating BM reorganization in GC progression, according to single-cell transcriptome analyses. In conclusion, we defined a novel molecular classification of GC based on BM genes, developed a prognostic risk model, and elucidated the cell subpopulations involved in BM remodeling at the single-cell level. This study has deepened the understanding of the relationship between GC metastasis and BM alterations, achieved prognostic stratification, and guided therapy.

Keywords: Basement membrane; Gastric cancer; Metastasis; Molecular classification; Pathology.


Conflict of interest statement

The authors declare no competing interests.

Figures
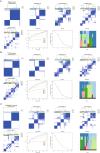
Fig. 1
Fig. 1
Subtype analysis of GC based on BM gene expression. A Unsupervised clustering results of the Meta cohort. The eight subgraphs, in order from left to right, top to bottom, are Subplots 1–5 show the matrix heat map of the meta-queue for k = 2–6, subplot 6 shows the consistent cumulative distribution function (CDF) plot, where the value of k with a small decreasing slope of the CDF is usually chosen, subplot 7 is the Delta Area Plot, which shows the relative change of area under the CDF curve compared with k and k-1. A larger value indicates that the clustering effect under this k value is more obvious than that under K-1, subplot 8 is the tracking plot, which shows the classification of the samples attributed to different values of k. Different color blocks represent different classifications, and the samples whose color is often changed before and after taking different K values represent classification instability. B Unsupervised clustering results for the TCGA-STAD cohort. The subplot arrangement is consistent with the Meta cohort. C Unsupervised clustering results for the GSE84437 cohort. The subplot arrangement is consistent with the Meta cohort
Fig. 2
Fig. 2
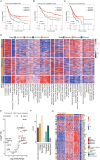
The differences in prognosis among the three subtypes of gastric cancer. A KM survival analysis of BMclusterA/B/C subtypes in the Meta cohort. B KM survival analysis of BMclusterA/B/C subtypes in the GSE84437 cohort. C KM survival analysis curves for BMclusterA, B, C subtypes in TCGA cohort. D GSVA enrichment analysis shows the activation status of biological signaling pathways in BMclusterA/B/C subtypes. Red represents relatively activated pathways and blue represents relatively inhibited pathways. E Volcano plot used to demonstrate BM genes that are differentially expressed between GC tumor and normal tissue. Blue dots represent genes that are down-regulated in tumor tissue and red dots represent genes that are up-regulated in tumor tissue. F Bar graph demonstrating the classification of 46 differentially expressed BM genes. G Heatmap demonstrating the expression levels of the 46 differentially expressed BM genes in the three GC subtypes compared to normal tissue
Fig. 3
Fig. 3
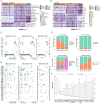
The immune infiltration and activation of oncogenic signals are different among BMclusterA/B/C subtypes of gastric cancer. A Heatmap of TME cell infiltration and tumor purity between BMclusterA/B/C subtypes in the Meta cohort. B Heatmap of the distribution of enriched cancer-related signaling pathways among BMclusterA/B/C subtypes in the Meta cohort. C Mutational landscape of core genes in the enriched cancer signaling pathways. D Statistical histogram of pathological information among BMclusterA/B/C subtypes in the GSE62254 dataset. E Mutation landscape of 46 differential basement membrane genes. F CNV frequency map of the 46 differential basement membrane genes
Fig. 4
Fig. 4
The altered biological pathways in the three GC subtypes relative to normal tissues. A Venn diagram showing the distribution of differential genes in BMclusterA/B/C subtypes compared to normal samples. B GO analysis of differentially expressed genes in BMclusterA showed the top 20 enriched pathways. C GO analysis of differentially expressed genes in BMclusterB showed the top 20 enriched pathways. D GO analysis of differentially expressed genes in BMclusterC showed the top 40 enriched pathways
Fig. 5
Fig. 5
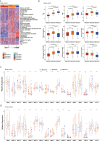
The TME tags of the three GC subtypes correlated with BM gene expression levels. A The heatmap shows the scores of 29 TME tags calculated by ssGSEA in the BMclusterA/B/C subtypes of the Meta cohort. B Boxplots show the scores of 9 TME tags in the BMclusterA/B/C subtypes of the Meta cohort. Statistical differences were tested using t ‘test. C Expression of 16 MMPs and NTN4 in the BMclusterA/B/C subtypes of Meta cohort. The upper and lower ends of the boxes represent the interquartile range of values. Lines in the boxes represent median values and black dots represent outliers. Asterisks represent statistical P values (*P < 0.05; **P < 0.01; ***P < 0.001, ****P < 0.0001). Statistical differences between the three subtypes were tested using the ANOVA test. D Expression of 16 MMPs and NTN4 in the BMclusterA/B/C subtypes of TCGA cohort. The upper and lower ends of the boxes represent the interquartile range of values. Lines in the boxes represent median values and black dots represent outliers. Asterisks represent statistical P values (*P < 0.05; **P < 0.01; ***P < 0.001, ****P < 0.0001). Statistical differences between the three subtypes were tested using the ANOVA test
Fig. 6
Fig. 6
Construction of BM prognostic risk model for GC. A, KM survival curves for the high and low BMscore groups in the training set of the Meta cohort. B ROC curves for the training set of Meta cohort. C KM survival curves for the high and low BMscore groups in the validation set of the Meta cohort. D ROC curves for the validation set of Meta cohort. E KM survival curves for the high and low BMscore groups in the GSE84437. F ROC curves of GSE84437.G: KM survival curves for the high and low BMscore groups in the TCGA cohort. H ROC curves of TCGA cohort. I the Hazard ratio for the six genes used to construct the multivariate COX proportional risk regression model. J BMscore for BMclustrA/B/C subtypes in the Meta cohort, GSE84437 cohort, and TCGA cohort. K BMscore for the four ACRG subtypes of GC, including EMT, MSS/TP53 + , MSS/TP53-, and MSI
Fig. 7
Fig. 7
Single-cell analysis of BM gene expression in each cell subpopulation in GC. A The tSNE dimension reduction map for single cell subpopulations in GC. B Expression maps of marker genes in single-cell subpopulations of GC. C Expression of different BM components in different cell subpopulations of GC. D A UMAP projection of the fibroblasts from GC. E Distribution of fibroblasts among patients with different pathological stages of GC. F Expression of proteoglycan components in different subpopulations of fibroblasts
Fig. 8
Fig. 8
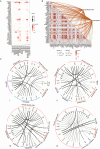
Cellular communication between cell subpopulations of GC. A Expression of 46 differentially expressed BM genes in different cell subpopulations between normal and tumor tissues. B Correlation analysis between 46 differentially expressed BM genes and endothelial cells and fibroblasts. C Circle diagram of cell communication pattern in four pathological stages of GC. The arrow points to the receptor (black short line) and the arrow starts as the ligand (green short line)

Similar articles

References

    1. Wong MCS, Huang J, Chan PSF, Choi P, Lao XQ, Chan SM, et al. Global incidence and mortality of gastric cancer, 1980–2018. JAMA Netw Open. 2021;4(7):e2118457. 10.1001/jamanetworkopen.2021.18457 - DOI - PMC - PubMed
    1. Huang J, Lucero-Prisno DE 3rd, Zhang L, Xu W, Wong SH, Ng SC, et al. Updated epidemiology of gastrointestinal cancers in East Asia. Nat Rev Gastroenterol Hepatol. 2023;20(5):271–87. 10.1038/s41575-022-00726-3 - DOI - PubMed
    1. Yang L, Kartsonaki C, Yao P, de Martel C, Plummer M, Chapman D, et al. The relative and attributable risks of cardia and non-cardia gastric cancer associated with Helicobacter pylori infection in China: a case-cohort study. Lancet Public Health. 2021;6(12):e888–96. 10.1016/S2468-2667(21)00164-X - DOI - PMC - PubMed
    1. Takei S, Kawazoe A, Shitara K. The new era of immunotherapy in gastric cancer. Cancers. 2022;14(4):1054. - PMC - PubMed
    1. Shitara K, Van Cutsem E, Bang YJ, Fuchs C, Wyrwicz L, Lee KW, et al. Efficacy and safety of pembrolizumab or pembrolizumab plus chemotherapy vs chemotherapy alone for patients with first-line, advanced gastric cancer: the KEYNOTE-062 phase 3 randomized clinical trial. JAMA Oncol. 2020;6(10):1571–80. 10.1001/jamaoncol.2020.3370 - DOI - PMC - PubMed

LinkOut - more resources