. 2024 Aug 20;25(1):270.
doi: 10.1186/s12859-024-05816-4.

Modeling relaxation experiments with a mechanistic model of gene expression

Affiliations

Modeling relaxation experiments with a mechanistic model of gene expression

Maxime Estavoyer et al. BMC Bioinformatics. .

Abstract

Background: In the present work, we aimed at modeling a relaxation experiment which consists in selecting a subfraction of a cell population and observing the speed at which the entire initial distribution for a given marker is reconstituted.

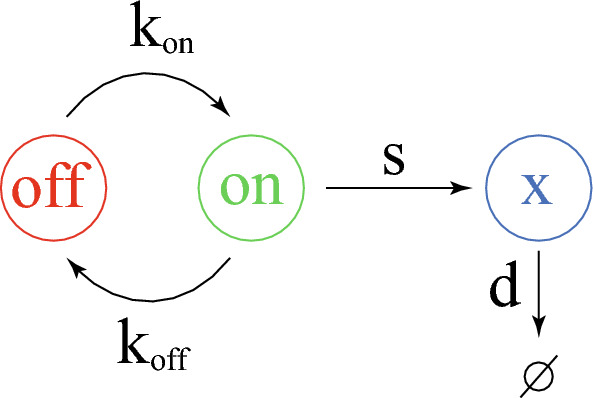
Methods: For this we first proposed a modification of a previously published mechanistic two-state model of gene expression to which we added a state-dependent proliferation term. This results in a system of two partial differential equations. Under the assumption of a linear dependence of the proliferation rate with respect to the marker level, we could derive the asymptotic profile of the solutions of this model.

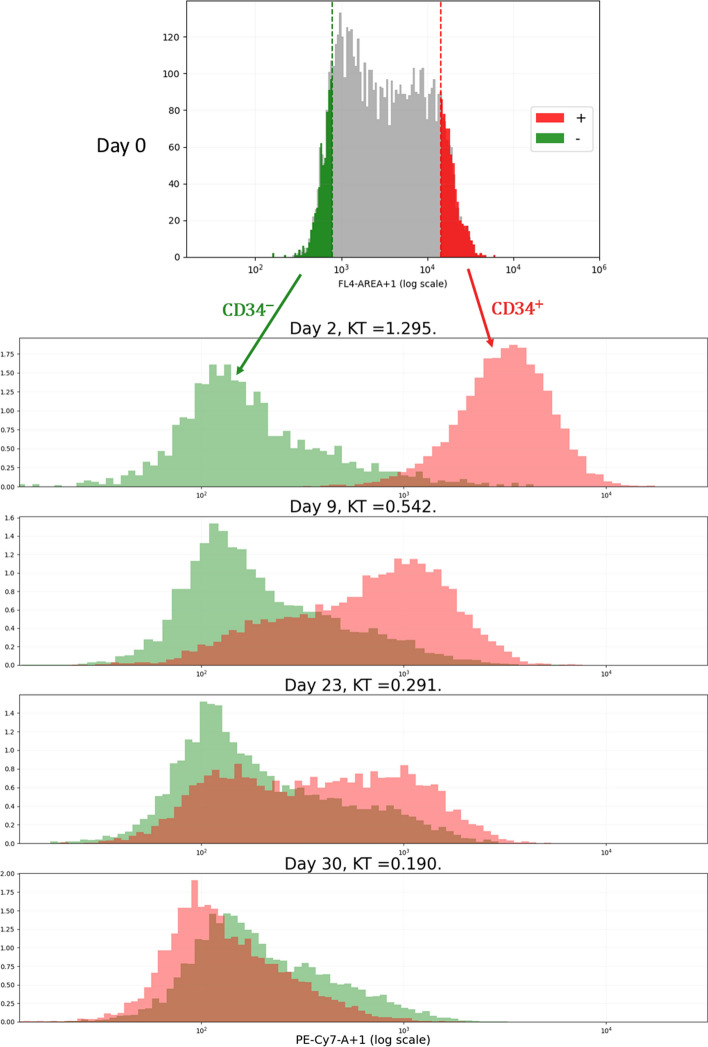
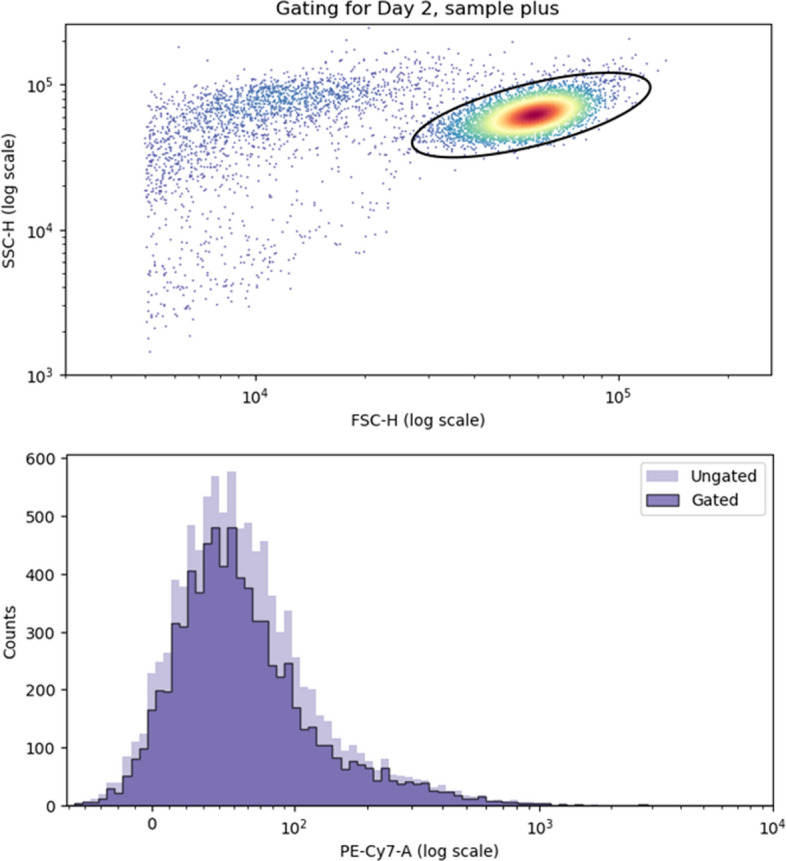
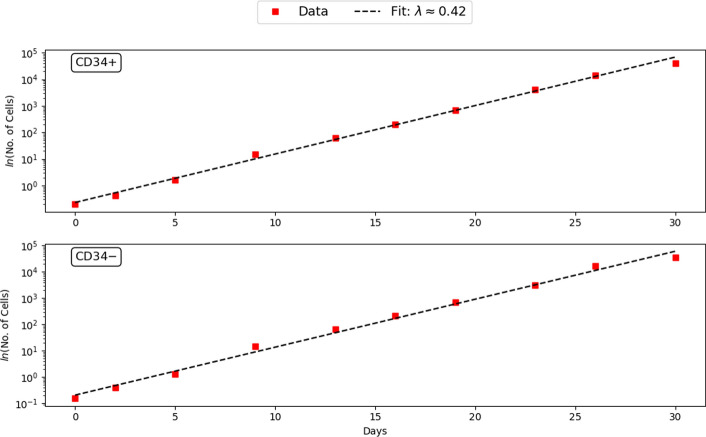
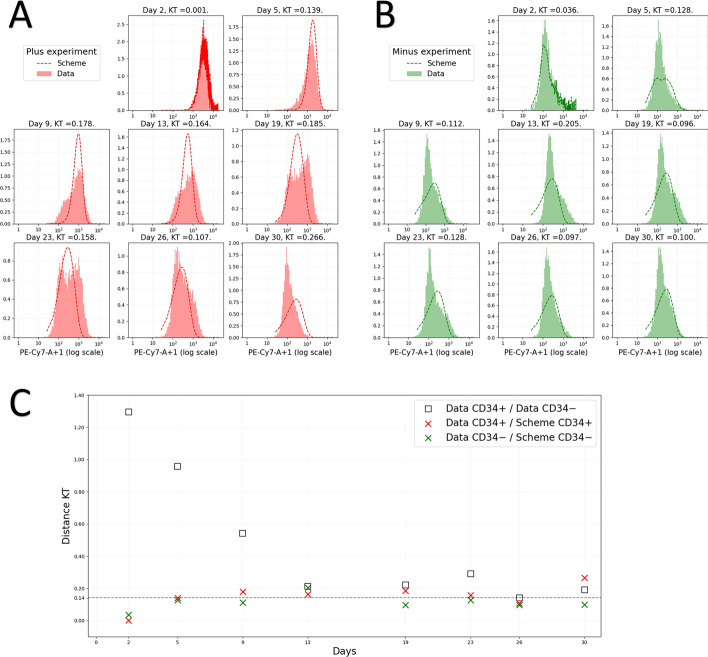
Results: In order to confront our model with experimental data, we generated a relaxation experiment of the CD34 antigen on the surface of TF1-BA cells, starting either from the highest or the lowest CD34 expression levels. We observed in both cases that after approximately 25 days the distribution of CD34 returns to its initial stationary state. Numerical simulations, based on parameter values estimated from the dataset, have shown that the model solutions closely align with the experimental data from the relaxation experiments.

Conclusion: Altogether our results strongly support the notion that cells should be seen and modeled as probabilistic dynamical systems.

Keywords: Asymptotic profile; Relaxation experiments; Two-state model.


Conflict of interest statement

None

Figures

Fig. 1
Fig. 1
The 2-state model of gene expression. The gene opens with a kon rate and closes with a koff rate. Similarly to [11] we only consider protein (x) production (with an s rate) and degradation (with a d rate)
Fig. 2
Fig. 2
The relaxation experiment. TF1-BA cells well labelled with an anti-CD34 antibody and FACS-sorted. The 10 percent most CD34 positive and the 10 percent most CD34 negative cells were sorted, grown in culture for the indicated period of time, where the distribution of cell-surface CD34 expression was assessed. KT: the modified Kantorovich–Rubinstein distance, defined by the Eq. (14), between the two distributions [26]
Fig. 3
Fig. 3
Example of flow cytometry gating. Top. Example of SSC-H along FSC-H plot for raw data from the plus subpopulation on day 2. As the data contain a high proportion of debris cells, we select only those viable cells lying within the black ellipse. Bottom. Fluorescence data before gating (Ungated) and after gating (Gated). For the figures and the ellipse, we used the python package “FlowCal” [27]
Fig. 4
Fig. 4
Estimation of the exponential growth rate λ. The red squares correspond to the number of cells (log scale) at different times for the relaxation experiments: Top. CD34+, Bottom. CD34-. The dotted line in black illustrates the optimal fit of the experimental data. The average of the slopes of the linear regressions minimizing the two experiments is given by the slope λ0.42
Fig. 5
Fig. 5
Likelihood profiles for for kon, koff and d in A and for r1 in B. A. The blue curve represents the function Sd, the red curve Skoff and the green curve Skon. The function Sd is introduced into Eq. (23). B. The grey area corresponds to the range of parameter values for r1 such that the function r is non-positive. Compared with the other parameters, variation in the r1 parameter has a small impact on the minimum Kantorovich–Rubinstein distance
Fig. 6
Fig. 6
Comparison of model and data. On the left the fitting of the CD34+ relaxation experiment (in A) and on the right in green of the CD34- (in B) experiments. Experimental data in logarithmic scale are represented by plain histograms and the numerical results of model (5) are represented by the dotted curves. We initialize the model on day 2, using the biological data. The initial condition is given by (24). Parameter values are given in Table 1. KT: the modified Kantorovich–Rubinstein distance, defined by the Eq. (14). C. Time-dependent evolution of the Kantorovich–Rubinstein distance between model and experimental data. For different days of the experiment, the modified Kantorovich–Rubinstein distance between the two relaxation experiments is depicted using black squares. The minimum distance, reached on day 26, is illustrated by a horizontal dotted line. The red crosses correspond to the modified Kantorovich–Rubinstein distance between the model for the parameter values from Table 1, and the CD34+ cell relaxation experiment. Similarly, the green crosses represent the distance for the CD34- cell relaxation experiment

References

    1. Nicholson DJ. Is the cell really a machine? J Theor Biol. 2019;477:108–26. 10.1016/j.jtbi.2019.06.002. 10.1016/j.jtbi.2019.06.002 - DOI - PubMed
    1. Kupiec JJ. A probabilistic theory for cell differentiation, embryonic mortality and DNA c-value paradox. Specul Sci Technol. 1983;6(5):471–8.
    1. Noble D. Genes and causation. Philos Transact A Math Phys Eng Sci. 2008;366(1878):3001–15. 10.1098/rsta.2008.0086.10.1098/rsta.2008.0086 - DOI - PubMed
    1. Schrödinger E. What is life? The physical aspect of the living cell. Cambridge: Cambridge University Press; 1944.
    1. Chang HH, Hemberg M, Barahona M, Ingber DE, Huang S. Transcriptome-wide noise controls lineage choice in mammalian progenitor cells. Nature. 2008;453(7194):544–7. 10.1038/nature06965 - DOI - PMC - PubMed

LinkOut - more resources