. 2024 Aug 20;23(1):168.
doi: 10.1186/s12943-024-02086-9.

Targeting circ-0034880-enriched tumor extracellular vesicles to impede SPP1highCD206+ pro-tumor macrophages mediated pre-metastatic niche formation in colorectal cancer liver metastasis

Affiliations

Targeting circ-0034880-enriched tumor extracellular vesicles to impede SPP1highCD206+ pro-tumor macrophages mediated pre-metastatic niche formation in colorectal cancer liver metastasis

Jing Zhou et al. Mol Cancer. .

Abstract

Background: Information transmission between primary tumor cells and immunocytes or stromal cells in distal organs is a critical factor in the formation of pre-metastatic niche (PMN). Understanding this mechanism is essential for developing effective therapeutic strategy against tumor metastasis. Our study aims to prove the hypothesis that circ-0034880-enriched tumor-derived extracellular vesicles (TEVs) mediate the formation of PMN and colorectal cancer liver metastasis (CRLM), and targeting circ-0034880-enriched TEVs might be an effective therapeutic strategy against PMN formation and CRLM.

Methods: We utilized qPCR and FISH to measure circRNAs expression levels in human CRC plasma, primary CRC tissues, and liver metastatic tissues. Additionally, we employed immunofluorescence, RNA sequencing, and in vivo experiments to assess the effect mechanism of circ-0034880-enriched TEVs on PMN formation and CRC metastasis. DARTS, CETSA and computational docking modeling were applied to explore the pharmacological effects of Ginsenoside Rb1 in impeding PMN formation.

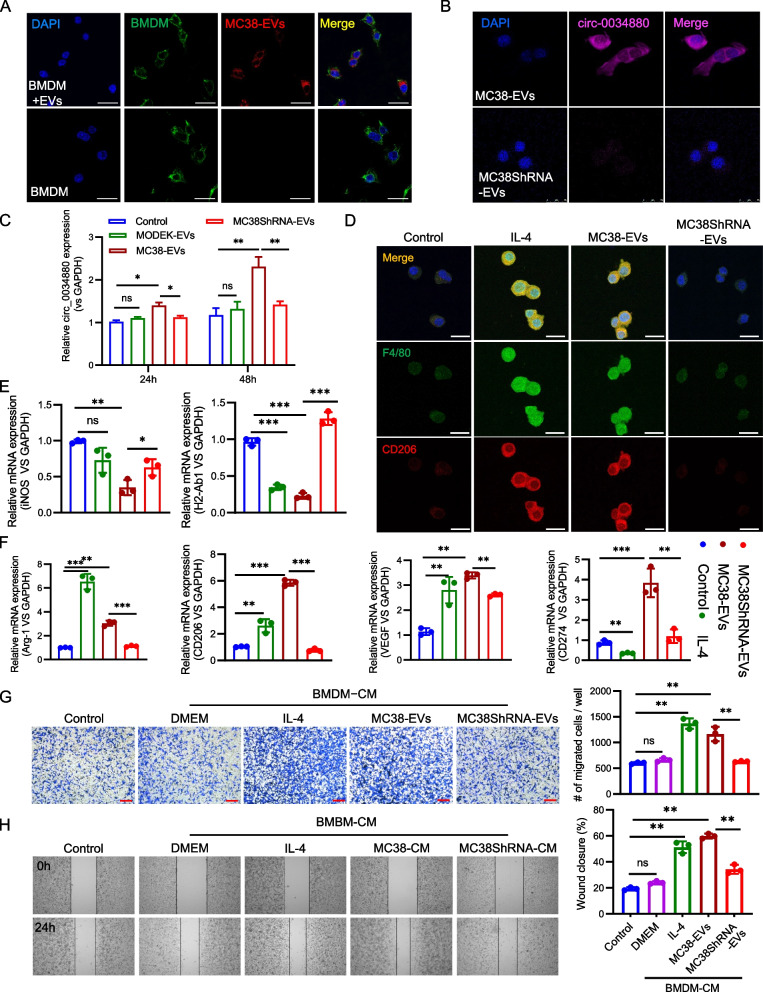
Results: We found that circ-0034880 was highly enriched in plasma extracellular vesicles (EVs) derived from CRC patients and closely associated with CRLM. Functionally, circ-0034880-enriched TEVs entered the liver tissues and were absorbed by macrophages in the liver through bloodstream. Mechanically, TEVs-released circ-0034880 enhanced the activation of SPP1highCD206+ pro-tumor macrophages, reshaping the metastasis-supportive host stromal microenvironment and promoting overt metastasis. Importantly, our mechanistic findings led us to discover that the natural product Ginsenoside Rb1 impeded the activation of SPP1highCD206+ pro-tumor macrophages by reducing circ-0034880 biogenesis, thereby suppressing PMN formation and inhibiting CRLM.

Conclusions: Circ-0034880-enriched TEVs facilitate strong interaction between primary tumor cells and SPP1highCD206+ pro-tumor macrophages, promoting PMN formation and CRLM. These findings suggest the potential of using Ginsenoside Rb1 as an alternative therapeutic agent to reshape PMN formation and prevent CRLM.

Keywords: Circ-0034880; Extracellular vesicles; Ginsenoside Rb1; Pro-tumor macrophages; Tumor metastasis.


Conflict of interest statement

The authors declare no competing interests.

Figures

Fig. 1
Fig. 1
Circ-0034880-enriched plasma EVs correlate with CRLM. A Human blood exosomes database (exoRBase) was applied to analyze the differentially expressed circRNAs in the plasma EVs of 12 CRC patients and 32 healthy volunteers. Red represents high expression and blue represents low expression. The color brightness of each unit is associated with differences in multiples (log 2[AR/N]). Not all the circRNAs in the figure were labeled. B GSE159669 array from GEO database was used to analyze the differentially expressed circRNAs in CRC primary tumor and paired para-carcinoma tissues. Red represents high expression and blue represents low expression. The color brightness of each unit is associated with differences in multiples (log 2[AR/N]). Not all the circRNAs in the figure were labeled. C The top up-regulated circRNAs were screened out through the cross-comparative analysis of circRNAs between plasmas and tissues by Venn diagram assay. Red represents upregulated expressed circRNAs in CRC tissues, blue represents upregulated expressed circRNAs in CRC EVs, and pink represents common upregulated expressed circRNAs. D Heatmap for 13 upregulated expressed circRNAs in the intracellular space and EVs of human CRC cell lines and colonic epithelial cells NCM460. E EVs derived from representative healthy volunteer and CRC patient were analyzed for phenotype (purity and shape) by electron microscopy, and the red arrows indicate the representative separated EVs. Scale bar, 100 nm. F EVs derived from representative healthy volunteer and CRC patient were analyzed for size and particle number by LM10 nanoparticle characterization system. G Immunoblotting assays of TSG101, CD81 and β-actin in representative EVs derived from healthy volunteer and CRC patients (H: healthy volunteer; P: primary CRC; M: metastatic CRC). H qPCR validation and proportion analysis of 13 circRNAs in the EVs derived from healthy volunteer (n = 21), Primary CRC (n = 60): plasma from CRC patients without metastases, Metastatic CRC (n = 60): plasma from CRC patients with liver metastases. I qPCR detection data of circ-0034880 in the EVs derived from healthy volunteer (n = 21), Primary CRC (n = 60) and Metastatic CRC (n = 60). J qPCR detection data of circ-0034880 in the EVs of human CRC cell lines and colonic epithelial cells NCM460. K qPCR detection of circ-0034880 in the EVs of murine colon cancer cell lines MC38 and colonic epithelial cells MODEK. L, M FISH and quantitative assay of circ-0034880 in the tissues from Primary CRC: primary tissues from CRC patients without metastases, Metastatic CRC: metastatic tissues from CRC patients with liver metastases. Scale bar, 50 μm. N FISH detection of has-circ-0034880 in representative human CRC lines LoVo and colonic epithelial cells NCM460. Scale bar, 25 μm. O FISH detection of mmu-circ-0034880 in representative murine colon cancer cell lines MC38 and murine colonic epithelial cells MODEK. Scale bar, 25 μm
Fig. 2
Fig. 2
Circ-0034880-enriched TEVs promote CRC liver metastasis. A Flow chart of animal model establishment for TEVs biodistribution observation. B Biodistribution of TEVs in the potential metastatic organs of mice. Representative bioluminescent images of mice in indicated groups were shown. C qPCR assay of silenced efficiency of circ-0034880 in MC38 cells. D Flow chart of animal model establishment for experimental liver metastasis. E, F Luciferase-based bioluminescence imaging on experimental liver metastasis of the indicated mice treated without EVs or with EVs derived from MODEK cells, or circ-0034880-enriched MC38 cells, or circ-0034880-silenced MC38 cells (shRNA-1 in Fig. 2C was used for K/D of circ-0034880). n = 6 for each group. Representative bioluminescent images of mice in indicated groups were shown in Fig. 2E, and the quantification data (fluorescence intensity) was presented in Fig. 2F. G, I Photograph and quantification of liver metastatic tissues n = 6 for each group. Representative images of liver tissues in indicated groups were shown in Fig. 2G, and the quantification data (liver/body weight, %) was presented in Fig. 2I. H, J Representative HE staining pictures of liver tissue sections from indicated mice were shown in Fig. 2H (up and middle). In addition, the representative immunohistochemical results using anti-CK20 and anti-glypican-3 (GPC-3) antibody were also shown in Fig. 2H to indicate that the metastatic origin of tumor in liver tissues are from colon tissues (down). The quantification data (tumor burden, %) for HE staining results was presented in Fig. 2J. Scale bar, 2 mm (up), 500 μm (middle), 40 μm (down). All results were shown as mean ± SD. Student’s t-test was used to analyze the data. *P < 0.05; **P < 0.01
Fig. 3
Fig. 3
Circ-0034880-enriched TEVs activate CD206+ pro-tumor macrophages in liver pre-metastatic microenvironment. A Flow chart of mice model establishment for detecting the effect of TEVs on the liver pre-metastatic microenvironment. B Multiplexed immunofluorescence assay was used to detect the overall effect of TEVs on the phenotype in the pre-metastatic microenvironment (left: 7 days; right: 14 days). The resected liver tissues were stained with antibodies against CD11B, CD206, α-SMA, Ly6G and CD3. Nuclear staining was done with DAPI. Scale bar, 20 μm (D7), 25 μm (D14). C, D Effect of TEVs on macrophages in the liver pre-metastatic microenvironment was detected by flow cytometry (7 days and 14 days). E FISH and quantitative assay of circ-0034880 in the liver metastatic tissues from Fig. 2E. Scale bar, 50 μm. F Immunofluorescence analysis of TAMs in the liver metastatic tissues from Fig. 2E. The 6 μm O.C.T. tissue cryosections were stained with antibodies against F4/80 and CD206. Nuclear staining was done with DAPI. Scale bar, 50 μm. G, H FISH and immunofluorescence assay of circ-0034880 expression in TAMs form representative clinical primary CRC and CRC liver metastatic lesions. Antibodies against CD86 and CD206 were stained for TAMs, and FITC labelled circ-0034880 probe was applied for circ-0034880 detection. I Correlation between circ-0034880 expression and CD206 expression in above TAMs form representative clinical primary CRC and CRC liver metastatic lesions. Scale bar, 20 μm. All results were shown as mean ± SD. Student’s t-test was used to analyze the data. *, P < 0.05; **, P < 0.01
Fig. 4
Fig. 4
Circ-0034880-enriched TEVs promote CRC cells migration via activating CD206+ pro-tumor macrophages. A Confocal imaging showed the delivery of DiR-labeled EVs (red) to DiO-labeled BMDMs (green). Scale bar, 25 μm. B FISH detection of circ-0034880 in representative BMDMs treated with MC38-EVs or MC38shRNA-EVs for 48 h. Scale bar, 25 μm. C qPCR detection of circ-0034880 in representative BMDMs treated with MC38-EVs or MC38shRNA-EVs for 24 h and 48 h. D Immunofluorescence analysis of CD206+ macrophages in BMDMs treated with MC38-EVs or MC38shRNA-EVs. The BMDMs were stained with antibodies against F4/80 and CD206. Nuclear staining was done with DAPI. Scale bar, 25 μm. E, F qPCR detection of macrophages activation associated genes (Arg-1, CD206, VEGF, CD274, iNOS, H2-Ab1) in BMDMs treated with MC38-EVs or MC38shRNA-EVs for 48 h. G, H Transwell and wound healing assay of MC38 cells treated with indicated conditioned medium (CM) from BMDMs that pretreated with IL-4, MC38-EVs, or MC38shRNA EVs, or none. Representative images were shown and migrated cells were counted. Scale bar, 150 μm. Scale bar, 150 μm. All results were shown as mean ± SD. Student’s t-test was used to analyze the data. *, P < 0.05; **, P < 0.01
Fig. 5
Fig. 5
Circ-0034880-enriched TEVs facilitate the activation of SPP1highCD206+ pro-tumor macrophages by protecting SPP1 from miR-200a-3p and miR-141-3p-mediated degradation. A, B Volcano plots of log2 fold change (FC) and log10 adjusted p value of differentially expressed genes between MC38-EVs-treated BMDMs and control BMDMs or between MC38-EVs-treated BMDMs and MC38shRNA-EVs-treated BMDMs. MC38shRNA-EVs represents EVs derived from MC38 cells of circ-0034880 silencing. C Venn diagram assay of up-regulated genes in MC38-EVs-treated BMDMs and down-regulated genes in MC38shRNA-EVs-treated BMDMs. D Heatmap of top 30 upregulated and downregulated genes. E qPCR validation of the top 10 differentially expressed genes in BMDMs treated with or without circ-0034880 gene silencing. F qPCR detection of SPP1 gene in BMDMs that pretreated with IL-4, MC38-EVs, or MC38shRNA EVs, or none. G Immunoblotting and quantitative assays of SPP1 in BMDMs that pretreated with IL-4, MC38-EVs, or MC38shRNA EVs, or none. H Immunofluorescence and quantitative analysis of SPP1 in BMDMs that pretreated with IL-4, MC38-EVs, or MC38shRNA EVs, or none. Scale bar, 25 μm. I ELISA and quantitative assays of SPP1 levels in the supernatant of BMDMs that pretreated with IL-4, MC38-EVs, or MC38shRNA EVs, or none. J Immunofluorescence analysis of SPP1 and CD206 in the mice liver metastatic tissues from Fig. 2E. Antibody against SPP1 and CD206 were used in this part. Yellow arrow represents SPP1 in TAMs (CD206+), white arrow represents SPP1 in the whole mesenchyme of TME. Scale bar, 20 μm. K CircRNA interactome databases and RegRNA were used to predict the potential target miRNAs of circ-0034880 and SPP1, respectively. Venn diagram showed the mutual putative target miRNAs of circ-0034880 and SPP1. L MiR-200a-3p and miR-141-3p were selected as the potential bridge between circ-0034880 and SPP1. M Interaction between circ-0034880 and AGO2 protein was confirmed by RIP and qPCR assay in H293T cells. N Potential miRNAs (miR-200a-3p and miR-141-3p) that bind with circ-0034880 were detected by qPCR using the anti-AGO2 immunoprecipitates. O Luciferase reporter activity was measured in H293T cells after co-transfection with circ-0034880-WT or circ-0034880-MUT and miR-200a-3p/miR-141-3p mimics. P Luciferase reporter activity was measured in H293T cells after co-transfection with SPP1 3’UTR-WT or SPP1 3’UTR-MUT and miR-200a-3p/miR-141-3p mimics. All results were shown as mean ± SD. Student’s t-test was used to analyze the data. *, P < 0.05; **, P < 0.01
Fig. 6
Fig. 6
Rb1 administration prevents CRC cells migration by impeding circ-0034880-enriched TEVs mediated activation of SPP1highCD206+ pro-tumor macrophages. A Effects of 71 natural products on the expression of circ-0034880 were measured by qPCR. The Heatmap showed the inhibitory degree of different natural products on circ-0034880 expression. B Effects of the selected 4 natural products on the TEVs secretion of MC38 were analyzed by NanoSight. C 3D molecular structure diagram of natural product Ginsenoside Rb1. D, E FISH and quantitative assay of the effects of gene silencing and Ginsenoside Rb1 administration on the expression of circ-0034880 in MC38 cells. Scale bar, 25 μm. F qPCR assay of the circ-0034880 expression in the EVs derived from MC38 cells pretreated with gene silencing and/or Ginsenoside Rb1 administration. G, H FISH and quantitative assay of the effects of different EVs pretreatment on the expression of circ-0034880 in BMDMs. Scale bar, 25 μm. I qPCR assay of the effects of different EVs pretreatment on the expression of circ-0034880 in BMDMs. J, K Immunofluorescence and quantitative analysis of CD206 and SPP1 in the BMDMs treated with DMEM, or MC38-EVs, or MC38shRNA-EVs, or Rb1 + MC38shRNA-EVs. Scale bar, 25 μm. L ELISA assays of secretory SPP1 protein in the supernatant of BMDMs treated with DMEM, or MC38-EVs, or MC38shRNA-EVs, or Rb1 + MC38shRNA-EVs. M qPCR assay of SPP1 in the BMDMs treated with DMEM, or MC38-EVs, or MC38shRNA-EVs, or Rb1 + MC38shRNA-EVs. N qPCR detection of macrophages activation associated genes (Arg-1, CD206, iNOS) in the BMDMs treated with DMEM, or MC38-EVs, or MC38shRNA-EVs, or Rb1 + MC38shRNA-EVs. O, P Transwell and wound healing assay of the effects of different EVs pretreated BMDMs culture supernatant on CRC cell migration. Scale bar, 150 μm. All results were shown as mean ± SD. Student’s t-test was used to analyze the data. *, P < 0.05; **, P < 0.01
Fig. 7
Fig. 7
Rb1 directly binds to QKI and inhibits the biogenesis of circ-0034880. A DARTS experiment was performed to search the direct targets of Rb1 in MC38 cells. Volcano plots of log2 fold change (FC) and log10 adjusted p value of differentially proteins between Rb1-treated MC38 cells and control MC38 cells. Red dots, proteins upregulated in Rb1-treated MC38 cells; blue dots, proteins upregulated in control MC38 cells. B Heatmap of upregulated and downregulated proteins by DARTS assay of Rb1-treated MC38 cells and control MC38 cells. C Venn diagram assay of Rb1 targeted proteins (n = 151) and circRNAs biogenesis associated proteins (n = 17). D The stereo view of MD-optimized complex structure of QKI (Q9QYS9, residue14-203) bound with Ginsenoside Rb1 and the detailed interactions between QKI and Ginsenoside Rb1. E The RMSD analysis of Ginsenoside Rb1 fitted to the backbone of QKI. F, G CETSA experiment was used to evaluate the binding between Rb1 and QKI in thermodynamic levels. The expression level of QKI protein was detected by western blot. H SPR was performed using QKI full length proteins with increasing concentrations of Rb1. The equilibrium dissociation constant (KD) was evaluated according to the response-concentration curve. I The computational docking model showed the Rb1 drug binding domain in QKI protein, and QKI protein shared the same RNA binding domain with Rb1 drug binding domain. The motif of QKI was obtained from ENCORI, and multiple QKI binding sequences were found in the flanking of circ-0034880. J, K, L Expression of QKI mRNA and protein in QKI-silenced MC38 cells and control MC38 cells was measured by qPCR and western blot analysis. M Expression of circ-0034880 in QKI-silenced MC38 cells and control MC38 cells were evaluated by qPCR analysis. All results were shown as mean ± SD. Student’s t-test was used to analyze the data. *, P < 0.05; **, P < 0.01
Fig. 8
Fig. 8
Rb1 administration inhibits CRLM via impeding circ-0034880-enriched TEVs mediated activation of SPP1highCD206+ pro-tumor TAMs. A Flow chart of Rb1 intervention in mice model of experimental liver metastasis. B, C Luciferase-based bioluminescence imaging on experimental liver metastasis of the indicated mice treated without EVs or with EVs derived from circ-0034880-enriched MC38 cells, or circ-0034880-silenced MC38 cells, or Rb1. n = 6 for each group. Representative bioluminescent images of mice in indicated groups were shown in Fig. 8B, and the quantification data (fluorescence intensity) was presented in Fig. 8C. D, E, F, G Photograph and HE staining to observe the effect of Rb1 on liver metastasis of mice colon cancer. Scale bar, 2 mm (up), 500 μm (down). n = 6 for each group. Representative liver tissues images of mice in indicated groups were shown in Fig. 8D, and the quantification data (liver/body weight, %) was presented in Fig. 8F. Representative HE staining pictures of liver tissue sections from indicated mice were shown in Fig. 8E (up and middle). In addition, the representative immunohistochemical results using anti-CK20 and anti-glypican-3 (GPC-3) antibody were also shown in Fig. 8E to indicate that the metastatic origin of tumor in liver tissues are from colon tissues (down). The quantification data (tumor burden, %) for HE staining results was presented in Fig. 8G. Scale bar, 2 mm (up), 500 μm (middle), 40 μm (down). H Immunofluorescence analysis of TAMs in the liver metastatic tissues from above Rb1 intervene model. Scale bar, 50 μm. I FISH assay of circ-0034880 in the liver metastatic tissues from above Rb1 intervene model. Scale bar, 25 μm. J Immunofluorescence analysis of SPP1 in the liver metastatic tissues from above Rb1 intervene model. Scale bar, 20 μm. K, L, M The quantitative assay for Fig. 8H, I, J. N A schematic mechanism underlying interactions between primary CRC cells and macrophages in distant liver organs. All results were shown as mean ± SD. Student’s t-test was used to analyze the data. *, P < 0.05; **, P < 0.01

References

    1. Sung H, Ferlay J, Siegel RL, et al. Global Cancer Statistics 2020: GLOBOCAN Estimates of Incidence and Mortality Worldwide for 36 Cancers in 185 Countries. CA Cancer J Clin. 2021;71:209–49. 10.3322/caac.21660. 10.3322/caac.21660 - DOI - PubMed
    1. Siegel RL, Wagle NS, Cercek A, et al. Colorectal cancer statistics, 2023. CA Cancer J Clin. 2023;73:233–54. 10.3322/caac.21772. 10.3322/caac.21772 - DOI - PubMed
    1. Dekker E, Tanis PJ, Vleugels JLA, et al. Colorectal cancer. Lancet. 2019;394:1467–80. 10.1016/S0140-6736(19)32319-0. 10.1016/S0140-6736(19)32319-0 - DOI - PubMed
    1. Wille-Jørgensen P, Syk I, Smedh K, et al. Effect of More vs Less Frequent Follow-up Testing on Overall and Colorectal Cancer-Specific Mortality in Patients With Stage II or III Colorectal Cancer: The COLOFOL Randomized Clinical Trial. JAMA. 2018;319:2095–103. 10.1001/jama.2018.5623. 10.1001/jama.2018.5623 - DOI - PMC - PubMed
    1. Fares J, Fares MY, Khachfe HH, et al. Molecular principles of metastasis: a hallmark of cancer revisited. Signal Transduct Target Ther. 2020;5:28. 10.1038/s41392-020-0134-x. 10.1038/s41392-020-0134-x - DOI - PMC - PubMed

MeSH terms