. 2024 Aug;13(16):e70122.
doi: 10.1002/cam4.70122.

WNT5A is a putative epi-driver of prostate cancer metastasis to the bone

Affiliations

WNT5A is a putative epi-driver of prostate cancer metastasis to the bone

Emma J Wilkinson et al. Cancer Med. 2024 Aug.

Abstract

Background: Current diagnostic tools are unable to distinguish low-grade indolent prostate cancer (PrCa) from that with a propensity to become metastatic and/or lethal. Recent evidence suggests that reprogramming of the transcriptome may drive the metastatic phenotype, and that this reprogramming is controlled, at least in part, by epigenetic changes to the DNA of cancer cells, including methylation. These changes, referred to as 'epigenetic drivers,' have previously been associated with cancer cell survival.

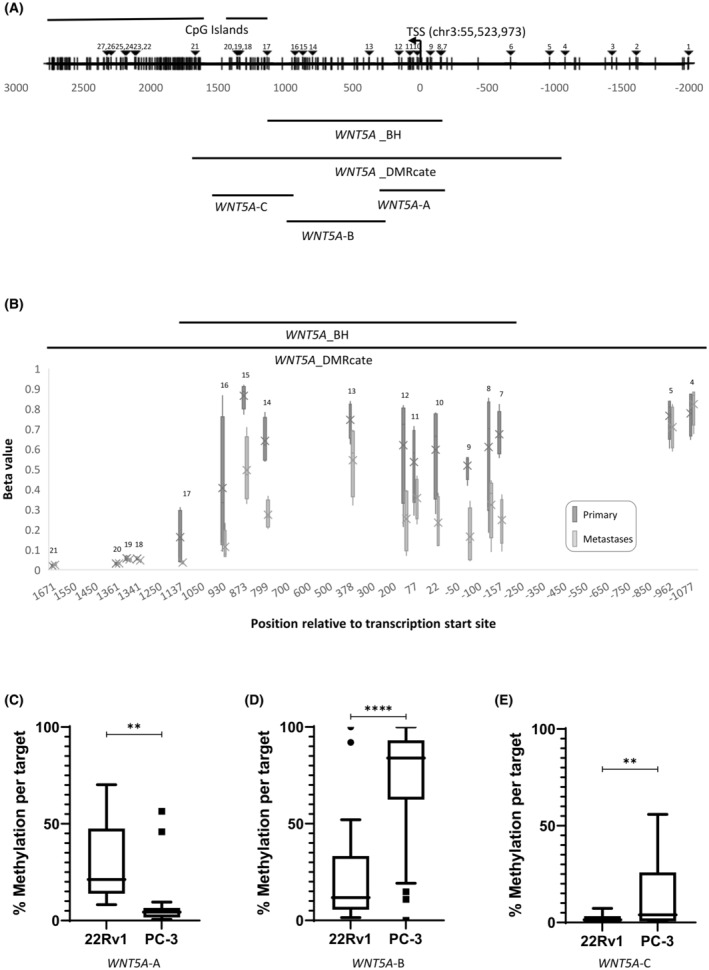
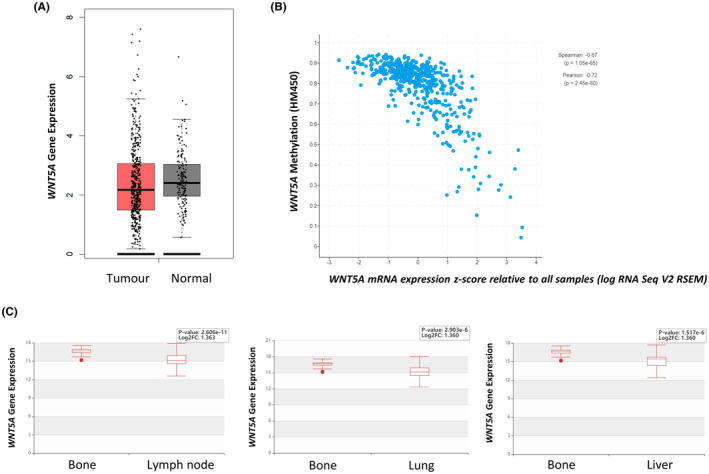
Methods: Here, using Illumina Methylation EPIC array data of paired primary PrCa and metastatic bone samples, we identified WNT5A as a putative epi-driver of PrCa metastasis to the bone, which was further validated in vitro.

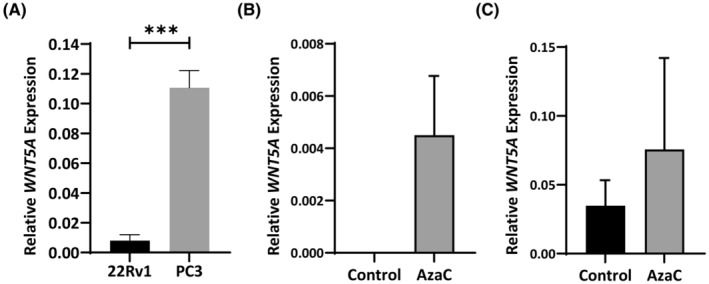
Results: Significantly higher WNT5A methylation was observed in primary PrCa samples and 22Rv1 cells compared to metastatic bone samples and PC-3 cells. This higher methylation was associated with significantly lower WNT5A gene expression.

Conclusion: Given the limited effective therapies available for metastatic cancer sufferers, particularly those whose disease has metastasised to the bone, WNT5A presents as a potential putative target for therapy.

Keywords: DNA methylation; epigenetic driver; gene expression; metastasis; prostate cancer.


Conflict of interest statement

The authors declare no conflict of interest.

Figures

FIGURE 1
FIGURE 1
(A) Schematic representation of the promoter region of WNT5A. Transcription start site (TSS) at chr3: 55,523,973 (hg19) and CpG islands are indicated. CpG sites are indicated by vertical lines. CpG sites interrogated by the Illumina Methylation EPIC array are indicated by triangles and labelled 1–27. Region from bumphunter (WNT5A_BH) and DMRcate (WNT5A_DMRcate) analyses are indicated. Region amplified using primer sets WNT5A‐A, WNT5A‐B and WNT5A‐C and analysed by bisulphite sequencing are indicated. (B) WNT5A methylation in paired primary PrCa and metastatic bone samples. Methylation status of the 17 CpG sites within the significantly differentially methylated region found in WNT5A with DMRcate analysis in tumour (dark grey) and paired bone metastases (light grey) as determined using the EPIC array. The significantly differentially methylated region found by bumphunter analysis (11 CpGs) is indicated. CpG numbers correspond to (A). The box plots depict the spread of beta values for each CpG across the four patient samples in each group (primary vs. metastasis). The mean of the group is labelled with a cross. The beta values are taken from many reads of ‘methylated’ or ‘unmethylated’ to generate a percentage methylated (1 being fully methylated, 0 being unmethylated) per sample. CpG site #6 failed quality control. (C–E) Average WNT5A methylation across the region encompassed by primer sets WNT5A‐A (18 CpGs) (C), WNT5A‐B (30 CpGs) (D) and WNT5A‐C (20 CpGs) (E) in prostate cancer cells, 22Rv1 and PC‐3. Statistical significance was determined using a paired t‐test, **p < 0.01, ****p < 0.0001.
FIGURE 2
FIGURE 2
(A) WNT5A expression in prostate cancer cell lines. WNT5A mRNA levels are expressed relative to GAPDH mRNA. Values are shown as mean ± standard error (n = 3). (B, C) WNT5A expression is not altered by 5‐aza‐2′‐deoxycytidine (AzaC) treatment. Total RNA was isolated from 22Rv1 (B) or PC‐3 (C) cells untreated or treated with AzaC. mRNA levels are expressed relative to GAPDH mRNA. Values are shown as mean ± standard error (n = 3). Statistical significance was determined using a Students t‐test, ***p < 0.001.
FIGURE 3
FIGURE 3
Methylation status of WNT5A in 22Rv1 cells. (A) Diagrammatic representation of the methylation at each CpG site within the region encompassed by WNT5A‐A, B and C in 22Rv1 cells. Percentage methylation is specified by colour, blue indicating a CpG is unmethylated, red indicating a CpG is methylated. (B–D) Average methylation across region encompassed by primer sets WNT5A‐A (B), WNT5A‐B (C), WNT5A‐C (D). Statistical significance was determined using a paired t‐test, ***p < 0.001.
FIGURE 4
FIGURE 4
Methylation status of WNT5A in PC‐3 cells. (A) Diagrammatic representation of the methylation at each CpG site within the region encompassed by WNT5A‐A, B and C in PC‐3 cells. Percentage methylation is specified by colour, blue indicating a CpG is unmethylated, red indicating a CpG is methylated. (B–D) Average methylation across region encompassed by primer sets WNT5A‐A (B), WNT5A‐B (C), WNT5A‐C (D). Statistical significance was determined using a paired t‐test, *p < 0.05, ****p < 0.0001.
FIGURE 5
FIGURE 5
WNT5A expression in publicly available datasets. (A) WNT5A expression in tumour (n = 492; red) versus normal prostate samples (n = 152; grey) from TCGA‐PRAD. (B) Correlation between WNT5A methylation and mRNA expression in primary prostate TCGA‐PRAD tumours, taken from the cBioPortal. WNT5A methylation (β‐value) is plotted on the y‐axis, a higher value indicates higher methylation. WNT5A mRNA expression z‐score is plotted on the x‐axis, a higher value indicates higher expression. (C) WNT5A gene expression in unpaired patient samples of bone (n = 20), lymph node (n = 69), lung (n = 22) and liver (n = 21) metastases. Data and images were taken from the Human Cancer Metastasis Database in 2021 (EXP00337‐9).

Similar articles

Cited by

References

    1. Howlader N, Noone AM, Krapcho M, et al. (eds) SEER cancer statistics review, 1975‐2017. National Cancer Institute; 2020. https://seer.cancer.gov/csr/1975_2017/
    1. Hernandez RK, Wade SW, Reich A, Pirolli M, Liede A, Lyman GH. Incidence of bone metastases in patients with solid tumors: analysis of oncology electronic medical records in the United States. BMC Cancer. 2018;18(1):44. - PMC - PubMed
    1. Gandaglia G, Abdollah F, Schiffmann J, et al. Distribution of metastatic sites in patients with prostate cancer: a population‐based analysis. Prostate. 2014;74(2):210‐216. - PubMed
    1. Nørgaard M, Jensen A, Jacobsen JB, Cetin K, Fryzek JP, Sørensen HT. Skeletal related events, bone metastasis and survival of prostate cancer: a population based cohort study in Denmark (1999 to 2007). J Urol. 2010;184(1):162‐167. - PubMed
    1. Wang L, Lu B, He M, Wang Y, Wang Z, Du L. Prostate cancer incidence and mortality: global status and temporal trends in 89 countries from 2000 to 2019. Front Public Health. 2022;10:811044. - PMC - PubMed