. 2024 Apr 23:15:1339866.
doi: 10.3389/fphys.2024.1339866. eCollection 2024.

Sex-specific cardiovascular risk factors in the UK Biobank

Affiliations

Sex-specific cardiovascular risk factors in the UK Biobank

Skyler R St Pierre et al. Front Physiol. .

Abstract

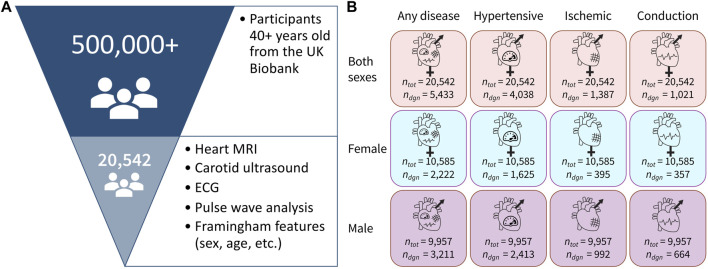
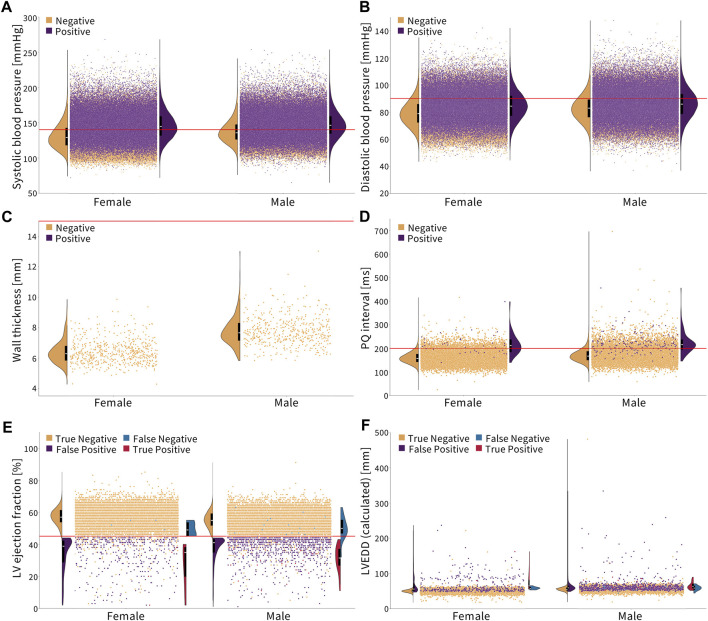
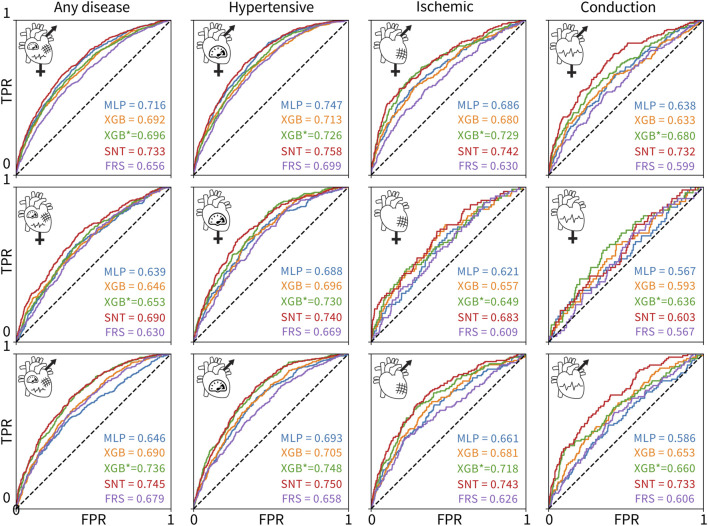
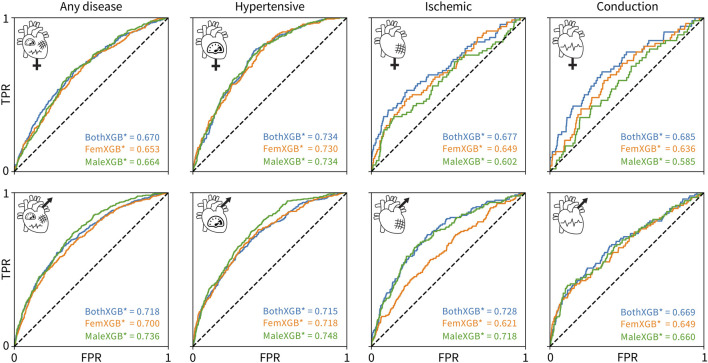
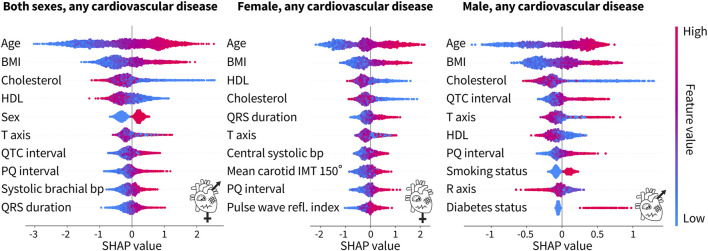
The lack of sex-specific cardiovascular disease criteria contributes to the underdiagnosis of women compared to that of men. For more than half a century, the Framingham Risk Score has been the gold standard to estimate an individual's risk of developing cardiovascular disease based on the age, sex, cholesterol levels, blood pressure, diabetes status, and the smoking status. Now, machine learning can offer a much more nuanced insight into predicting the risk of cardiovascular diseases. The UK Biobank is a large database that includes traditional risk factors and tests related to the cardiovascular system: magnetic resonance imaging, pulse wave analysis, electrocardiograms, and carotid ultrasounds. Here, we leverage 20,542 datasets from the UK Biobank to build more accurate cardiovascular risk models than the Framingham Risk Score and quantify the underdiagnosis of women compared to that of men. Strikingly, for a first-degree atrioventricular block and dilated cardiomyopathy, two conditions with non-sex-specific diagnostic criteria, our study shows that women are under-diagnosed 2× and 1.4× more than men. Similarly, our results demonstrate the need for sex-specific criteria in essential primary hypertension and hypertrophic cardiomyopathy. Our feature importance analysis reveals that out of the top 10 features across three sexes and four disease categories, traditional Framingham factors made up between 40% and 50%; electrocardiogram, 30%-33%; pulse wave analysis, 13%-23%; and magnetic resonance imaging and carotid ultrasound, 0%-10%. Improving the Framingham Risk Score by leveraging big data and machine learning allows us to incorporate a wider range of biomedical data and prediction features, enhance personalization and accuracy, and continuously integrate new data and knowledge, with the ultimate goal to improve accurate prediction, early detection, and early intervention in cardiovascular disease management. Our analysis pipeline and trained classifiers are freely available at https://github.com/LivingMatterLab/CardiovascularDiseaseClassification.

Keywords: UK Biobank; cardiovascular; heart disease; risk factors; sex differences.


Conflict of interest statement

The authors declare that the research was conducted in the absence of any commercial or financial relationships that could be construed as a potential conflict of interest. The author(s) declared that they were an editorial board member of Frontiers, at the time of submission. This had no impact on the peer review process and the final decision.

Figures

FIGURE 1
FIGURE 1
Dataset overview. (A) Out of 500,000+ participants in the UK Biobank study, we selected a group of 20,542 participants who underwent magnetic resonance imaging, carotid ultrasounds, ECG, and pulse wave analysis. We also selected participants with available data for all of the Framingham Risk Score features. (B) Data are separated in 12 variants with three sex groups and four cardiovascular disease categories, where n tot is the total number of people in the dataset and n diag is the number of people in that dataset who have been diagnosed with the corresponding condition.
FIGURE 2
FIGURE 2
Diagnosing cardiovascular disease via simple, non-sex-specific cut-offs. The red line indicates the diagnostic cut-off. The truncated violin plots show the distribution of men and women for each color-coded population, with the box plot inside showing the mean in white and the 25th and 75th percentiles. (A, B) Essential primary hypertension is diagnosed with a systolic blood pressure greater than or equal to 140 mmHg and/or diastolic blood pressure greater than or equal to 90 mmHg (Williams et al., 2018). Women who are not diagnosed with hypertension, on average, have a lower systolic and diastolic blood pressure compared to men. (C) Hypertrophic cardiomyopathy is diagnosed with a wall thickness greater than 15 mm (Elliott et al., 2014). None of the individuals in this cohort met the condition. Healthy women have a notably lower wall thickness on average than men. (D) First-degree AV block is diagnosed with a PQ interval greater than 200 ms (Holmqvist and Daubert, 2013). Healthy women have a lower PQ interval on average than men. (E, F) Dilated cardiomyopathy is diagnosed by a left ventricle ejection fraction less than 45% and a left ventricle end-diastolic diameter greater than 112% of the diameter predicted based on the body surface area and age (Arora et al., 2010; Orphanou et al., 2022). Women have a slightly higher ejection fraction and lower left ventricle end-diastolic diameter on average than men, which is represented in orange.
FIGURE 3
FIGURE 3
ROC curves and AUC scores for the 60 classifiers evaluated on 12 test sets. The rows correspond to (1) both sexes, (2) female-only, and (3) male-only datasets. The columns correspond to the (1) any, (2) hypertensive, (3) ischemic, and (4) conduction diseases. The colors of the curves indicate the different model types: MLP deep learning baseline (blue), untuned XGBoost (orange), tuned XGBoost baseline for the state-of-the-art model (green), SAINT (red), and XGBoost trained and tuned on Framingham Risk Score features only (purple). The true positive rate is plotted versus the false positive rate.
FIGURE 4
FIGURE 4
Cross-evaluation results using tuned XGBoost classifiers. The classifiers trained on both sexes are colored blue, the classifiers trained on only female data are colored orange, and the classifiers trained on only male data are colored green. The rows show the ROC and AUC for a given trained classifier in predicting a given disease for only-female data, top, or only-male data, bottom. The columns correspond to any cardiovascular disease, hypertensive diseases, ischemic diseases, and conduction diseases, from left to right. The true positive rate is plotted versus the false positive rate.
FIGURE 5
FIGURE 5
Top 10 features from the tuned XGBoost classifiers trained on both sexes, female only, and male only for any cardiovascular disease. For both sexes, the top four features for the prediction of cardiovascular disease are traditional risk factors, while ECG features and a blood pressure feature from pulse wave analysis make up the rest of the top 10. For the female-only dataset, in addition to the top four traditional risk factors, there is a mix of ECG, pulse wave, and carotid ultrasound features. For the male-only dataset, six of the features are traditional risk factors while the rest are ECG features. Each dot corresponds to a person in the SHAP analysis dataset. A positive SHAP value indicates the contribution to a diagnosis of cardiovascular disease. Bright red corresponds to a high feature value, e.g., old age, while bright blue corresponds to a low feature value, e.g., young age. The binary categories of sex, smoking status, and diabetes status are red for male, smoker, and diabetic, respectively, while blue represents the opposite.

Similar articles

References

    1. Abadi M., Agarwal A., Barham P., Brevdo E., Chen Z., Citro C., et al. (2016). TensorFlow: large-scale machine learning on heterogeneous distributed systems. arXiv:10.48550/arXiv.1603.04467 - DOI
    1. Aceña V., Martín de Diego I., Fernández R. R., Moguerza M. J. (2022). Minimally overfitted learners: a general framework for ensemble learning. Knowledge-Based Syst. 254, 109669. 10.1016/j.knosys.2022.109669 - DOI
    1. Alaa A. M., Bolton T., Angelantonio E. D., Rudd J. H. F., van der Schaar M. (2019). Cardiovascular disease risk prediction using automated machine learning: a prospective study of 423,604 UK biobank participants. PLOS ONE 14, e0213653. 10.1371/journal.pone.0213653 - DOI - PMC - PubMed
    1. Alber M., Buganza Tepole A., Cannon W., De S., Dura-Bernal S., Garikipati K., et al. (2019). Integrating machine learning and multiscale modeling: perspectives, challenges, and opportunities in the biological, biomedical, and behavioral sciences. npj Digit. Med. 2, 115. 10.1038/s41746-019-0193-y - DOI - PMC - PubMed
    1. Arik S. O., Pfister T. (2020). Tabnet: attentive interpretable tabular learning. arXiv :10.48550/arXiv.1908.07442 - DOI

LinkOut - more resources