. 2024 Aug 5:15:1382538.
doi: 10.3389/fimmu.2024.1382538. eCollection 2024.

Inhibition of insulin-like growth factors increases production of CXCL9/10 by macrophages and fibroblasts and facilitates CD8+ cytotoxic T cell recruitment to pancreatic tumours

Affiliations

Inhibition of insulin-like growth factors increases production of CXCL9/10 by macrophages and fibroblasts and facilitates CD8+ cytotoxic T cell recruitment to pancreatic tumours

Patrick Freeman et al. Front Immunol. .

Abstract

Pancreatic ductal adenocarcinoma (PDAC) is a highly lethal malignancy with an urgent unmet clinical need for new therapies. Using a combination of in vitro assays and in vivo preclinical models we demonstrate that therapeutic inhibition of the IGF signalling axis promotes the accumulation of CD8+ cytotoxic T cells within the tumour microenvironment of PDAC tumours. Mechanistically, we show that IGF blockade promotes macrophage and fibroblast production of the chemokines CXCL9 and CXCL10 to facilitate CD8+ T cell recruitment and trafficking towards the PDAC tumour. Exploring this pathway further, we show that IGF inhibition leads to increased STAT1 transcriptional activity, correlating with a downregulation of the AKT/STAT3 signalling axis, in turn promoting Cxcl9 and Cxcl10 gene transcription. Using patient derived tumour explants, we also demonstrate that our findings translate into the human setting. PDAC tumours are frequently described as "immunologically cold", therefore bolstering CD8+ T cell recruitment to PDAC tumours through IGF inhibition may serve to improve the efficacy of immune checkpoint inhibitors which rely on the presence of CD8+ T cells in tumours.

Keywords: CD8+ T cell; CXCL9/10; IGF; fibroblast; macrophage; pancreatic cancer; tumour microenvironment.


Conflict of interest statement

Author MO was employed by AstraZeneca. The remaining authors declare that the research was conducted in the absence of any commercial or financial relationships that could be construed as a potential conflict of interest.

Figures

Figure 1
Figure 1
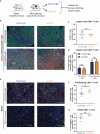
IGF blockade leads to an increase in cytotoxic T cell accumulation in pancreatic tumours (A) Top, LSL-KrasG12D/+;LSL-Trp53R172H/+;Pdx-1-Cre (KPC) derived FC1242 cells were orthotopically implanted into the pancreas tail of syngeneic C57BL-6J recipient mice. Mice were treated by intraperitoneal injection with either IgG2 control antibody (60 mg/kg) or IGF-blocking antibody MEDI-573 (60 mg/kg) at days 14, 17 and 21 post implantation. Pancreatic tumours were harvested at day 22 post implantation. Below, tumour weights at harvest for both treatment groups (n = 5 mice per treatment group), *P ≤ 0.05 using Mann-Whitney U test. (B) Immunohistochemical staining of CD3+ T cells in formalin fixed paraffin embedded tissues from orthotopic murine PDAC tumours treated with IgG2 control antibody or IGF-blocking antibody MEDI-573. Scale bar; 50 μm. (C) Quantification of CD3 staining. Data displayed as total CD3+ T cells among all cells. A total of 5-8 fields of view counted/mouse tumour, n = 5 mice per treatment group, *P ≤ 0.05 using Mann-Whitney U test. (D) Immunofluorescent staining of CD8 (green), and nuclei (blue) in formalin fixed paraffin embedded tissues from orthotopic murine PDAC tumours treated with IgG2 (control) antibody or IGF blocking antibody MEDI-573. Scale bar 50 μm. (E) Quantification of CD8 staining. Data displayed as total CD8+ T cells among all cells. A total of 5-8 fields of view counted/ mouse tumour, n = 5 mice per treatment group, ***P ≤ 0.001 using unpaired t test. (F) Immunofluorescent staining of CD8 (red), granzyme B (green) and nuclei (blue) in formalin fixed paraffin embedded tissues from orthotopic murine PDAC tumours treated with IgG2 (control) antibody or IGF blocking antibody MEDI-573. Scale bar 50 μm. (G) Quantification of functionally active CD8+ T cells in IgG control treated and anti-IGF treated orthotopic murine pancreatic tumours. Data displayed as percentage of CD8+/GranzymeB+ cells among all cells. A total of 5-8 fields of view counted/mouse tumour, n= 5 mice per treatment group, ns; P > 0.05 using Mann-Whitney U test. (H) Immunofluorescent staining of CD8 (green), PD1 (red) and nuclei (blue) in formalin fixed paraffin embedded tissues from orthotopic murine PDAC tumours treated with IgG2 (control) antibody or IGF blocking antibody MEDI-573. Scale bar 50 μm. (I) Quantification of PD1+ CD8+ T cells in IgG control treated and anti-IGF treated orthotopic murine pancreatic tumours. Data displayed as either percentage of CD8+ T cells among all cells or PD1+/CD8+ T cells among all cells. A total of 5-8 fields of view counted/mouse tumour, n= 5 mice per treatment group, ns; P > 0.05, **P ≤ 0.01 using Mann-Whitney U test.
Figure 2
Figure 2
IGF blockade does not affect CD8+ T cell priming, survival or proliferation within the PDAC TME. (A) LSL-KrasG12D/+;LSL-Trp53R172H/+;Pdx-1-Cre (KPC) derived FC1242 cells were orthotopically implanted into the pancreas tail of syngeneic C57BL-6J recipient mice. Mice were treated by intraperitoneal injection with either IgG2 control antibody (60 mg/kg) or IGF-blocking antibody MEDI-573 (60 mg/kg) at days 14, 17 and 21 post implantation. Mesenteric lymph nodes were harvested at day 22 post implantation. (B) Top, immunofluorescent staining of CD8 (green), Ki67 (red) and nuclei (blue) in formalin fixed paraffin embedded mesenteric lymph nodes from mice bearing orthotopic PDAC tumours treated with IgG2 (control) antibody or IGF blocking antibody MEDI-573. Scale bar 50 μm. Below, immunofluorescent staining of CD8 (green), Granzyme B (red) and nuclei (blue) in formalin fixed paraffin embedded mesenteric lymph nodes from mice bearing orthotopic PDAC tumours treated with IgG2 (control) antibody or IGF blocking antibody MEDI-573. Scale bar 50 μm. (C) Quantification of CD8 staining in mesenteric lymph nodes. Data displayed as total CD8+ T cells among all cells. A total of 3 fields of view counted/mouse lymph node, n = 5 mice per treatment group, ns; P > 0.05 using Mann-Whitney U test. (D) Quantification of Ki67+/CD8+ T cells and Granzyme B+/CD8+ T cells in mesenteric lymph nodes in IgG control treated and anti-IGF treated mice bearing orthotopic pancreatic tumours. Data displayed as percentage of Ki67+/CD8+ T cells and Granzyme B+/CD8+ T cells among all CD8+ T cells. A total of 3 fields of view counted/mouse tumour, n= 5 mice per treatment group, ns; P > 0.05 using Mann-Whitney U test. (E) Top, immunofluorescent staining of CD8 (green), Ki67 (red) and nuclei (blue) in formalin fixed paraffin embedded tissues from orthotopic murine PDAC tumours treated with IgG2 (control) antibody or IGF blocking antibody MEDI-573. Bottom, Immunofluorescent staining of CD8 (green), cleaved caspase 3 (red) and nuclei (blue) in formalin fixed paraffin embedded tissues from orthotopic murine PDAC tumours treated with IgG2 (control) antibody or IGF blocking antibody MEDI-573. Scale bar 50 μm. (F) Quantification of proliferating CD8+ T cells in IgG control treated and anti-IGF treated orthotopic murine pancreatic tumours. Data displayed as percentage of CD8+/Ki67+ cells among all CD8+ T cells. (G) Quantification of viable CD8+ T cells in IgG control treated and anti-IGF treated orthotopic murine pancreatic tumours. Data displayed as percentage of CD8+/CC3- cells among all CD8+ T cells. A total of 5-8 fields of view counted/mouse tumour, n= 5 mice per treatment group, ns; P > 0.05 using Mann-Whitney U test.
Figure 3
Figure 3
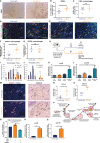
TAM and CAF derived chemokines CXCL9 and CXCL10 facilitate CD8+ T cell recruitment to PDAC tumours upon IGF blockade. (A) Immunohistochemical staining of αSMA in formalin fixed paraffin embedded tissues from orthotopic murine PDAC tumours treated with IgG2 control antibody or IGF-blocking antibody MEDI-573. Scale bar; 50 µm. (B) Quantification of αSMA staining. Data displayed as total αSMA+ area/total tumour area. A total of 5-8 fields of view counted/mouse tumour, n = 5 mice per treatment group, *P ≤ 0.05 using Mann-Whitney U test. (C) Quantification of F480 staining. Data displayed as % F480+ cells among all cells. A total of 5-8 fields of view counted/mouse tumour, n = 5 mice per treatment group, ns; P > 0.05 using Mann-Whitney U test. (D) Immunofluorescent staining of F480 (green), MHCII (red) and nuclei (blue) in formalin fixed paraffin embedded tissues from orthotopic murine PDAC tumours treated with IgG2 (control) antibody or IGF blocking antibody MEDI-573. Scale bar 50 µm. White arrows denote cells which are positive for both F480 and MHCII. (E) Immunofluorescent staining of F480 (green), CD206 (red) and nuclei (blue) in formalin fixed paraffin embedded tissues from orthotopic murine PDAC tumours treated with IgG2 (control) antibody or IGF blocking antibody MEDI-573. Scale bar 50 µm. White arrows denote cells which are positive for both F480 and CD206. (F) Quantification of MHCII+/F480+ macrophages in IgG control treated and anti-IGF treated orthotopic murine pancreatic tumours. Data displayed as percentage of MHCII+/F480+ cells among all cells. A total of 5-8 fields of view counted/mouse tumour, n= 5 mice per treatment group, * P ≤ 0.05 using Mann-Whitney U test. (G) Quantification of CD206+/F480+ macrophages in IgG control treated and anti-IGF treated orthotopic murine pancreatic tumours. Data displayed as percentage of CD206+/F480+ cells among all cells. A total of 5-8 fields of view counted/mouse tumour, n= 5 mice per treatment group, ns; P > 0.05 using Mann-Whitney U test. (H) LSL-KrasG12D/+;LSL-Trp53R172H/+;Pdx-1-Cre (KPC) derived FC1242 cells were orthotopically implanted into the pancreas of syngeneic recipient (C57BL/6J) mice. Mice were treated with IgG2 control antibody or IGF-blocking antibody MEDI-573 at days 23. Tumours were harvested and digested at day 25 post implantation with TAMs (CD45+/F4/80+ cells) and non-immune stromal cells (CD45-/zsGreen-a) being sorted by flow cytometry and subsequently subjected to transcriptional analysis. (I) Quantification of Il10, Tgfb, IL6, Tnfa, Cxcl9, Cxcl10 AND Cxcl12 mRNA expression levels in zsGreen-/CD45+/F4/80+ tumour associated macrophages isolated from murine PDAC tumours treated with IgG2 control antibody or IGF-blocking antibody MEDI-573 (n=3). **P ≤ 0.01 using unpaired t tests (J) Quantification of Col1a1, Col1a2, Fn1, Il6, Cxcl9, Cxcl10 and Cxcl12 mRNA expression levels in zsGreen-/CD45- stromal fibroblasts isolated from murine PDAC tumours treated with IgG2 control antibody or IGF-blocking antibody MEDI-573 (n=3). **P ≤ 0.01 using unpaired t tests. (K) Quantification of Cxcl9 and (L) Cxcl10 mRNA expression levels in primary murine fibroblasts isolated from the pancreata of wild-type C57BL/6J mice and treated with scrambled control siRNA (5 µM) Igfr1 siRNA (5 µM) Igf1r (5 µM) or a combination of both Igf1r and Insr siRNAs (5 µM). Expression data displayed as fold change compared to scrambled control siRNA treatment *, P ≤ 0.05; **P ≤ 0.01 using one-way ANOVA with Tukey’s multiple comparisons post hoc test. (M) Left, Immunofluorescent staining of CXCL9 (red) and nuclei (blue) in formalin fixed paraffin embedded tissues from orthotopic murine PDAC tumours treated with IgG2 (control) antibody or IGF blocking antibody MEDI-573. White arrows denote CXCL9+ cells. Right, Immunohistochemical staining of CXCL10 in formalin fixed paraffin embedded tissues from orthotopic murine PDAC tumours treated with IgG2 control antibody or IGF-blocking antibody MEDI-573. Black arrows denote CXCL10+ cells. Scale bar 50 µm. (N) Quantification of CXCL9+ cells in IgG control treated and anti-IGF treated orthotopic murine pancreatic tumours. Data displayed as percentage of CXCL9+ cells among all cells. A total of 5-8 fields of view counted/mouse tumour, n= 5 mice per treatment group, *P ≤ 0.05 using Mann-Whitney U test. (O) Quantification of CXCL10+ cells in IgG control treated and anti-IGF treated orthotopic murine pancreatic tumours. Data displayed as percentage of CXCL10+ cells among all cells. A total of 5-8 fields of view counted/mouse tumour, n= 5 mice per treatment group, **P ≤ 0.01 using Mann-Whitney U test. (P) Summary schematic for CD8+ T cell chemotaxis assay. Fibroblast conditioned media was generated from primary murine fibroblasts isolated from the pancreata of wild-type C57BL/6J mice and treated with IgG control antibody (100 µg/ml) or IGF-blocking antibody MEDI-573 (100 µg/ml). Fresh primary murine fibroblasts were cultured in treated fibroblast conditioned media for 48 hours and conditioned media collected for use in CD8+ T cell chemotaxis assays. Migration of primary murine CD8+ T cells through a 5 µm transwell insert towards fibroblast conditioned media was measured after 15 hours using a haemocytometer. CD8+ T cells were treated with or without the CXCR3 antagonist SCH 546738 (10 nM) before inclusion in migration assay. (Q) Data are presented as the number of migratory T cells as a fold change compared to the IgG control treated fibroblast conditioned media AFTER 15 hr. n=3, *P ≤ 0.05, **P ≤ 0.01, ***P ≤ 0.001 using one-way ANOVA with Tukey’s multiple comparisons test. (R) Quantification of Cxcl9 and (S) Cxcl10 mRNA expression levels in primary murine fibroblasts isolated from the pancreata of wild-type C57BL/6J mice and treated with IgG control antibody (100 µg/ml) or IGF-blocking antibody MEDI-573 (100 µg/ml) for 24 hours. Expression data displayed as fold change compared to IgG control treatment. n=3, ***P ≤ 0.001 using Mann-Whitney U test.
Figure 4
Figure 4
IGF blockade reverses phosphorylation of STAT3 in TAMs and CAFs to facilitate STAT1 induction of Cxcl9 and Cxcl10 genes (A) Top, immunofluorescent staining of F480 (green), pSTAT3 (red) and nuclei (blue) in formalin fixed paraffin embedded tissues from orthotopic murine PDAC tumours treated with IgG2 (control) antibody or IGF blocking antibody MEDI-573. Bottom, immunofluorescent staining of F480 (green), pSTAT1(red) and nuclei (blue) in formalin fixed paraffin embedded tissues from orthotopic murine PDAC tumours treated with IgG2 (control) antibody or IGF blocking antibody MEDI-573. Scale bar 50 µm. (B) Quantification of the number of F480+ macrophages displaying active pSTAT3 signalling in IgG control treated and anti-IGF treated orthotopic murine pancreatic tumours. Data displayed as percentage of pSTAT3+/F480+ macrophages among all F480+ macrophages. (C) Quantification of the number of F480+ macrophages displaying active pSTAT1 signalling in IgG control treated and anti-IGF treated orthotopic murine pancreatic tumours. Data displayed as percentage of pSTAT1+/F480+ macrophages among all F480+ macrophages. A total of 5-8 fields of view counted/mouse tumour, n= 5 mice per treatment group, *P ≤ 0.05, **P ≤ 0.01 using Mann-Whitney U test. (D) Top, immunofluorescent staining of αSMA (green), pSTAT3 (red) and nuclei (blue) in formalin fixed paraffin embedded tissues from orthotopic murine PDAC tumours treated with IgG2 (control) antibody or IGF blocking antibody MEDI-573. Bottom, immunofluorescent staining of PDGFRβ (green), pSTAT1 (red) and nuclei (blue) in formalin fixed paraffin embedded tissues from orthotopic murine PDAC tumours treated IgG2 (control) antibody or IGF blocking antibody MEDI-573. Scale bar 50 µm. (E) Quantification of the number of αSMA+ fibroblasts displaying active pSTAT3 signalling in IgG control treated and anti-IGF treated orthotopic murine pancreatic tumours. Data displayed as percentage of pSTAT3+/αSMA+ fibroblasts among all αSMA+ fibroblasts. (F) Quantification of the number of PDGFRβ+ fibroblasts displaying active pSTAT1 signalling in IgG control treated and anti-IGF treated orthotopic murine pancreatic tumours. Data displayed as percentage of pSTAT1+/PDGFRβ+ fibroblasts among all PDGFRβ+ fibroblasts. A total of 5-8 fields of view counted/mouse tumour, n= 5 mice per treatment group, *P ≤ 0.05, **P ≤ 0.01 using Mann-Whitney U test. (G) Schematic to display experimental design of mechanistic study assessing the role of STAT signalling in controlling response to IGF blockade in BMDMS/Fibroblasts. (H) Immunoblotting analysis of primary murine fibroblasts and (I) primary murine bone-marrow derived macrophages in response to IGF blockade. Whole cell lysates were probed for both total and phosphorylated AKT, total and phosphorylated STAT3 as well as GAPDH loading control. (J) Quantification of Stat1 mRNA expression levels in primary murine fibroblasts and treated with fibroblast conditioned media supplemented with either IgG control antibody (100 µg/ml), IGF-blocking antibody MEDI-573 (100 µg/ml) or recombinant IFNγ (50 ng/ml) for 1, 2, 4 or 6 hrs. n=3, **P ≤ 0.01, ****P ≤ 0.0001 using two-way ANOVA with Dunnett’s multiple comparisons test. (K) Quantification of Icam1, Irf1 and Oas2 mRNA expression levels in primary murine fibroblasts and treated with fibroblast conditioned media supplemented with either IgG control antibody (100 µg/ml), IGF-blocking antibody MEDI-573 (100 µg/ml) or recombinant IFNγ (50 ng/ml) for 6 hrs. n=3, ****P ≤ 0.0001 using two-way ANOVA with Dunnett’s multiple comparisons test. (L) Immunocytochemistry staining of STAT1 (red) and nuclei (blue) in primary murine fibroblasts and treated with fibroblast conditioned media supplemented with either IgG control antibody (100 µg/ml), IGF-blocking antibody MEDI-573 (100 µg/ml) or recombinant IFNγ (50 ng/ml) for 6 hrs. Bottom right, quantification of STAT1+ area/total cell number in IgG control, anti-IGF and IFNγ treated fibroblasts. Data displayed as fold change compared to IgG control treatment. n=3, **P ≤ 0.01,***P ≤ 0.001 using one-way ANOVA with Bonferroni’s multiple comparisons test.
Figure 5
Figure 5
IGF blockade leads to increased CD8+ T cell recruitment towards human PDAC conditioned media utilising the precision cut tumour slice model (A) Schematic detailing the workflow for each fresh PDAC sample and generation of 250 µm precision cut tumour slices. (B) Left, densitometry data displaying expression of CXCL9 in conditioned media of PCTS tissue treated with IgG2 (control) antibody or IGF blocking antibody MEDI-573 for 72 hours, analysed by immunoblotting. Data displayed as fold change compared to the IgG2 control antibody of CXCL9/Ponceau loading control. n=3, *P ≤ 0.05 using one-sample t test. Right, representative immunoblotting analysis of PCTS CM, using ponceau as loading control. (C) Migration of Jurkat T cells through a 5 µm transwell insert towards PCTS conditioned media was measured after 15 hours using a haemocytometer. Conditioned media was generated from PCTS samples treated with IgG control antibody (100 µg/ml) or IGF-blocking antibody MEDI-573 (100 µg/ml) for 72 hours. (D) Data are presented separately for each patient displaying the number of migratory Jurkat T cells as a fold change compared to the IgG control treated PCTS conditioned media AFTER 15 hr. n=5. (E) Immunofluorescent staining of CD8 (green) and nuclei (blue) in formalin fixed paraffin embedded tissues from day 0 control PCTS samples, or PCTS samples treated with IgG2 (control) antibody or IGF blocking antibody MEDI-573 for 72 hours. Scale bar 50 µm. (F) Immunofluorescent staining of CD8 (green), cleaved caspase 3 (red) and nuclei (blue) in formalin fixed paraffin embedded tissues from PCTS samples treated with IgG2 (control) antibody or IGF blocking antibody MEDI-573 for 72 hours. Scale bar 50 µm. (G) Immunofluorescent staining of CD8 (green), ki67 (red) and nuclei (blue) in formalin fixed paraffin embedded tissues from PCTS samples treated with IgG2 (control) antibody or IGF blocking antibody MEDI-573 for 72 hours. Scale bar 50 µm. (H) Quantification of CD8+ T cells in Day 0 control, IgG control treated and anti-IGF treated PCTS samples. Data displayed as fold change of CD8+ T cells among all cells compared to day 0 control slices. A total of 3-4 fields of view counted/slice, n= 4 slices per treatment group, ns; P > 0.05, **P ≤ 0.01 one-way ANOVA Bonferroni’s multiple comparison post hoc test. (I) Quantification of CC3+ CD8+ T cells and Ki67+ CD8+ T cells in IgG control treated and anti-IGF treated PCTS samples. Data displayed as fold change of either CC3+ CD8+ T cells or Ki67+ CD8+ among all CD8+ T cells compared to IgG control treatment. A total of 3-4 fields of view counted/slice, n= 6 slices per treatment group, ns; P > 0.05 using two-way ANOVA with Bonferroni’s multiple comparisons test. (J) Picrosirius red staining of collagen fibres in formalin fixed paraffin embedded tissues from PCTS samples treated with IgG2 (control) antibody (top) or IGF blocking antibody MEDI-573 (bottom) for 72 hours. (K) Quantification of picrosirius red staining in PCTS samples. Data displayed as fold change in picrosirius red area over total area stained compared to IgG control treatment. n=4, *P ≤ 0.05 using one-sample t test.
Figure 6
Figure 6
Inhibition of the IGF signalling axis facilitates T cell recruitment towards the PDAC TME. Summary schematic detailing the proposed mechanism through which IGF blockade facilitates CD8+ T cell recruitment towards the PDAC TME. IGF blockade inhibits STAT3 signalling in both TAMs and CAFs driving STAT1 mediated transcription of the T cell chemokines Cxcl9/10. Concomitantly, IGF blockade leads to a reduction in collagen deposition which may further facilitate CD8+ T cell infiltration into and through the PDAC TME.

Similar articles

Cited by

References

    1. Li D, Xie K, Wolff R, Abbruzzese JL. Pancreatic cancer. Lancet. (2004) 363:1049–57. doi: 10.1016/S0140-6736(04)15841-8 - DOI - PubMed
    1. Rahib L, Smith BD, Aizenberg R, Rosenzweig AB, Fleshman JM, Matrisian LM. Projecting cancer incidence and deaths to 2030: the unexpected burden of thyroid, liver, and pancreas cancers in the United States. Cancer Res. (2014) 74:2913–21. doi: 10.1158/0008-5472.CAN-14-0155 - DOI - PubMed
    1. Ireland L, Santos A, Ahmed MS, Rainer C, Nielsen SR, Quaranta V, et al. . Chemoresistance in pancreatic cancer is driven by stroma-derived insulin-like growth factors. Cancer Res. (2016) 76:6851–63. doi: 10.1158/0008-5472.CAN-16-1201 - DOI - PMC - PubMed
    1. Royal RE, Levy C, Turner K, Mathur A, Hughes M, Kammula US, et al. . Phase 2 trial of single agent Ipilimumab (anti-CTLA-4) for locally advanced or metastatic pancreatic adenocarcinoma. J Immunother (Hagerstown Md: 1997). (2010) 33:828. doi: 10.1097/CJI.0b013e3181eec14c - DOI - PMC - PubMed
    1. Siegel RL, Miller KD, Fuchs HE, Jemal A. Cancer statistics, 2022. CA: A Cancer J Clin. (2022) 72:7–33. doi: 10.3322/caac.21708 - DOI - PubMed

MeSH terms